| Param | Original file | Final file |
|---|---|---|
| Filename | modeM0/AS1T05_010T01_9000005016_35005cztM0_level2.evt | modeM0/AS1T05_010T01_9000005016_35005cztM0_level2_quad_clean.evt |
| Size (bytes) | 442,794,240 | 78,822,720 |
| Size | 422.3 MB | 75.2 MB |
| Events in quadrant A | 2,595,323 | 508,427 |
| Events in quadrant B | 3,119,275 | 516,335 |
| Events in quadrant C | 3,049,343 | 500,590 |
| Events in quadrant D | 4,269,470 | 473,610 |
| Mode M0 | |||
|---|---|---|---|
| Quadrant | BADHDUFLAG | Total packets | Discarded packets |
| A | 0 | 11331 | 3 |
| B | 0 | 13007 | 2 |
| C | 0 | 12239 | 2 |
| D | 0 | 16676 | 2 |
| Mode M9 | |||
|---|---|---|---|
| Quadrant | BADHDUFLAG | Total packets | Discarded packets |
| A | 0 | 32 | 0 |
| B | 0 | 32 | 0 |
| C | 0 | 32 | 0 |
| D | 0 | 33 | 0 |
| Mode SS | |||
|---|---|---|---|
| Quadrant | BADHDUFLAG | Total packets | Discarded packets |
| A | 0 | 112 | 0 |
| B | 0 | 112 | 0 |
| C | 0 | 112 | 0 |
| D | 0 | 112 | 0 |
| Quadrant | Total seconds | Saturated seconds | Saturation percentage |
|---|---|---|---|
| A | 5549 | 10 | 0.180213% |
| B | 5549 | 108 | 1.946297% |
| C | 5549 | 117 | 2.108488% |
| D | 5549 | 135 | 2.432871% |
Noise dominated data is calculated using 1-second bins in cleaned event files. If a bin has >2000 counts, and if more than 50% of those come from <1% of pixels, then it is considered to be noise-dominated and hence unusable.
| Quadrant | # 1 sec bins | Bins with >0 counts | Bins with >2000 counts | High rate bins dominated by noise | Noise dominated (total time) | Noise dominated (detector-on time) | Marked lightcurve |
|---|---|---|---|---|---|---|---|
| A | 7133 | 5550 | 2 | 2 | 0.03% | 0.04% | 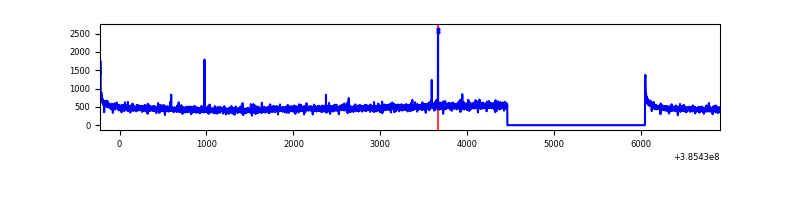 |
| B | 7133 | 5550 | 56 | 56 | 0.79% | 1.01% | 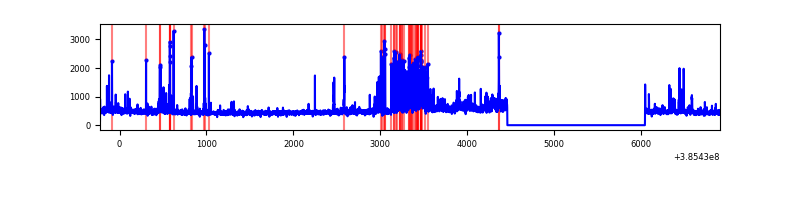 |
| C | 7133 | 5550 | 97 | 97 | 1.36% | 1.75% | 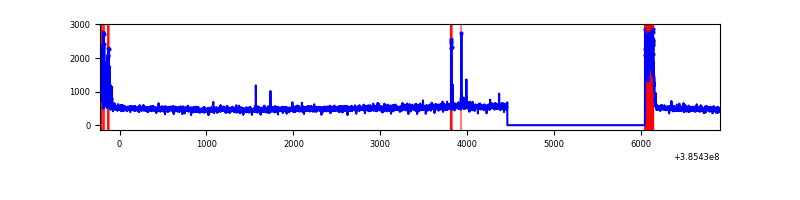 |
| D | 7133 | 5550 | 102 | 102 | 1.43% | 1.84% | 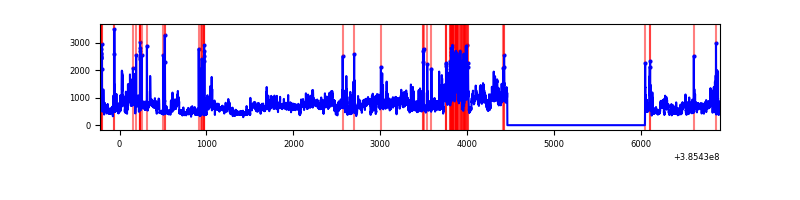 |
Top three noisy pixels from each quadrant. If the there are fewer than three noisy pixels in the level2.evt file, extra rows are filled as -1
| Pixel properties | Quadrant properties | ||||||
|---|---|---|---|---|---|---|---|
| Quadrant | DetID | PixID | Counts | Sigma | Mean | Median | Sigma |
| A | 10 | 83 | 75311 | 577.35 | 645 | 634 | 129.3 |
| A | 13 | 254 | 9079 | 65.29 | 645 | 634 | 129.3 |
| A | 15 | 169 | 8524 | 61.0 | 645 | 634 | 129.3 |
| B | 5 | 172 | 271993 | 2195.58 | 643 | 625 | 123.6 |
| B | 0 | 190 | 123143 | 991.27 | 643 | 625 | 123.6 |
| B | 0 | 197 | 70387 | 564.43 | 643 | 625 | 123.6 |
| C | 0 | 10 | 300975 | 2054.01 | 631 | 637 | 146.2 |
| C | 15 | 214 | 230463 | 1571.78 | 631 | 637 | 146.2 |
| C | 15 | 159 | 25481 | 169.91 | 631 | 637 | 146.2 |
| D | 8 | 195 | 1209837 | 7875.37 | 627 | 610 | 153.5 |
| D | 10 | 118 | 176369 | 1144.67 | 627 | 610 | 153.5 |
| D | 5 | 223 | 115024 | 745.15 | 627 | 610 | 153.5 |
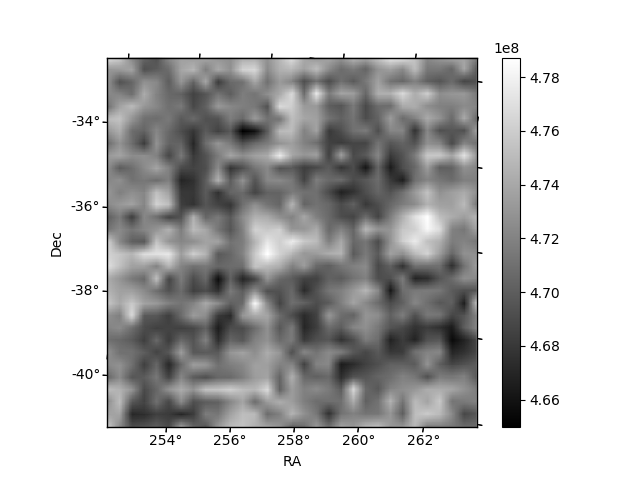
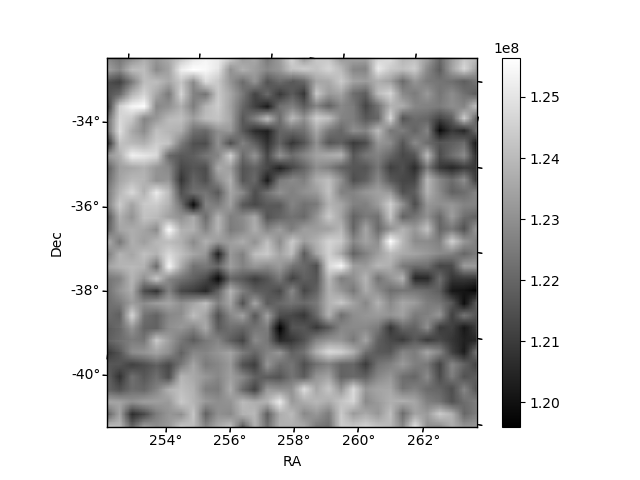
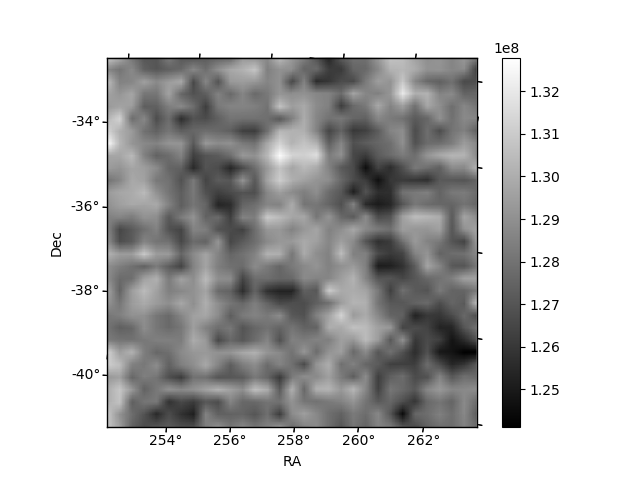
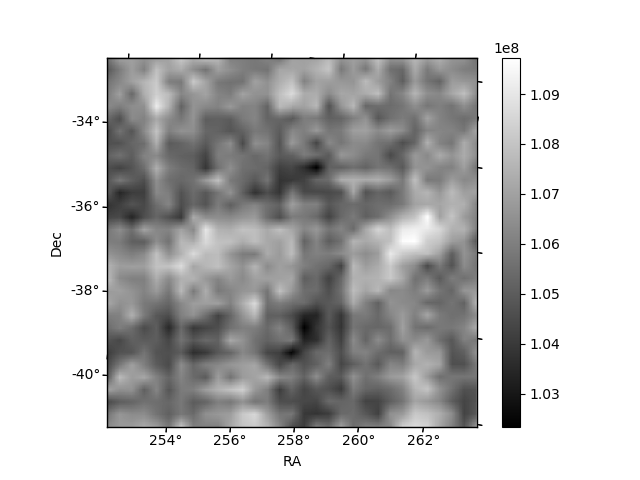
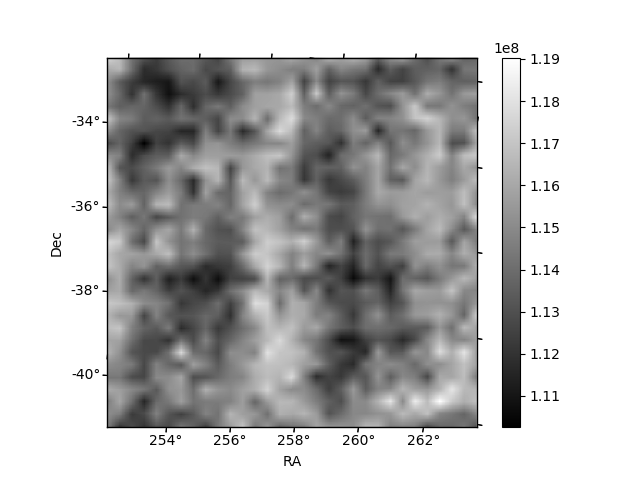
Histogram calculated using DETX and DETY for each event in the final _common_clean file
| Quadrant A | 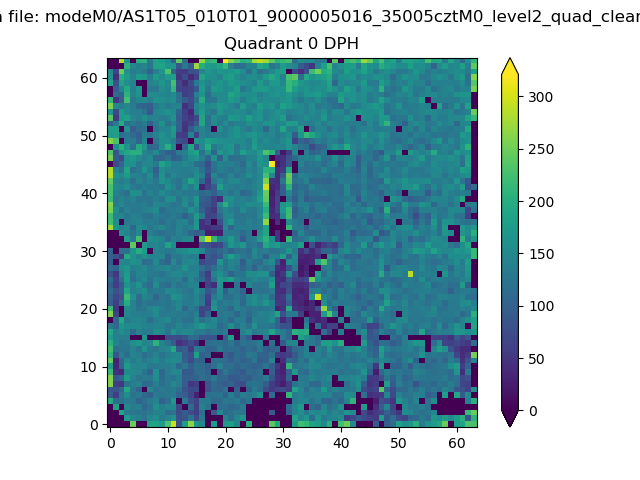 |
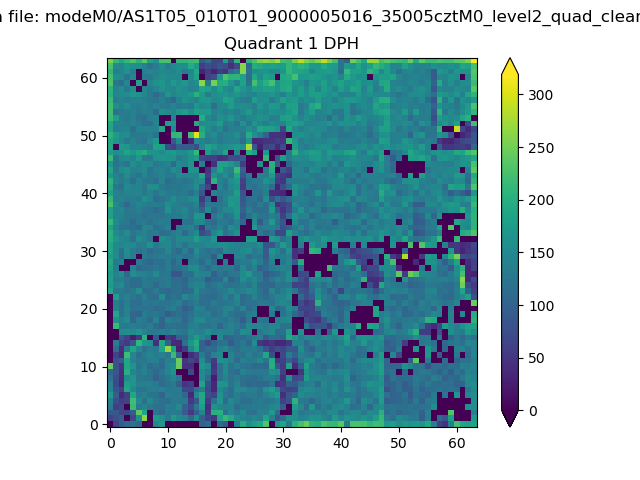 |
Quadrant B |
|---|---|---|---|
| Quadrant D | 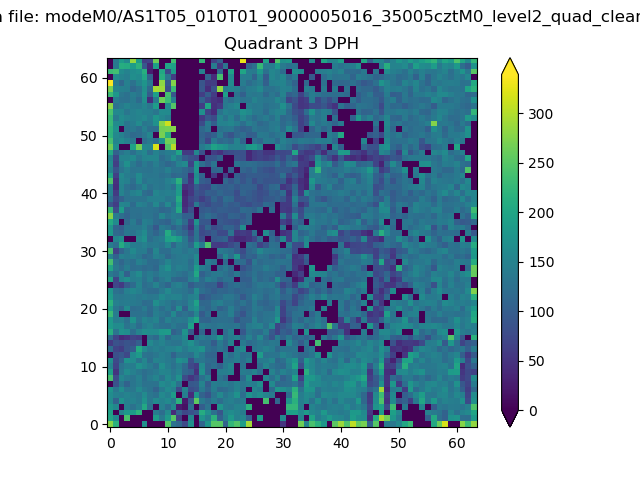 |
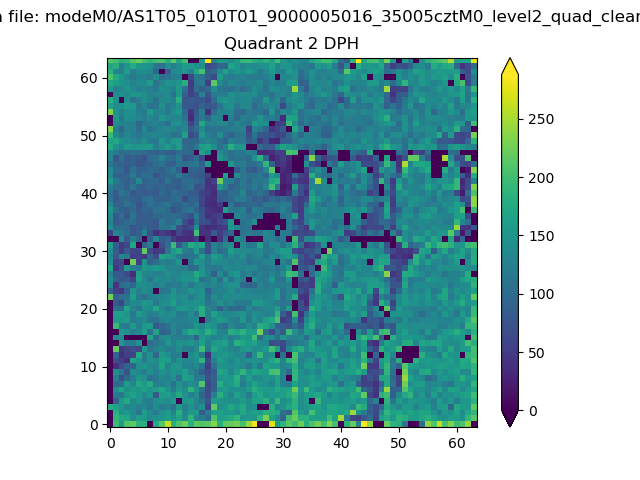 |
Quadrant C |
| Plot type | Count rate plots | Images |
|---|---|---|
| Comparison with Poisson distribution Blue bars denote a histogram of data divided into 1 sec bins. Red curve is a Poisson curve with rate = median count rate of data. |
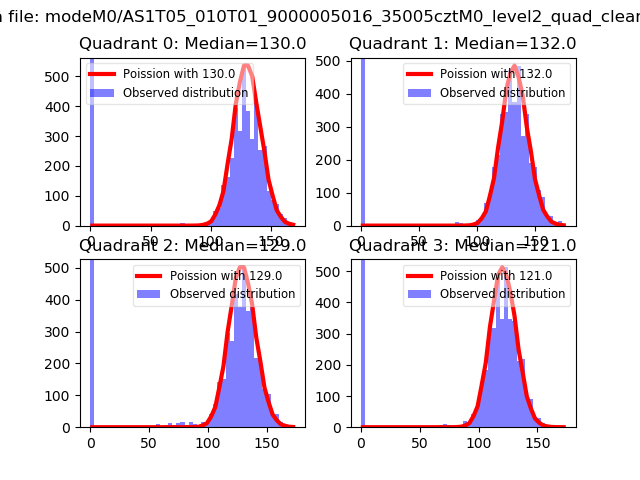 |
 |
| Quadrant-wise count rates Data is divided into 100 sec bins |
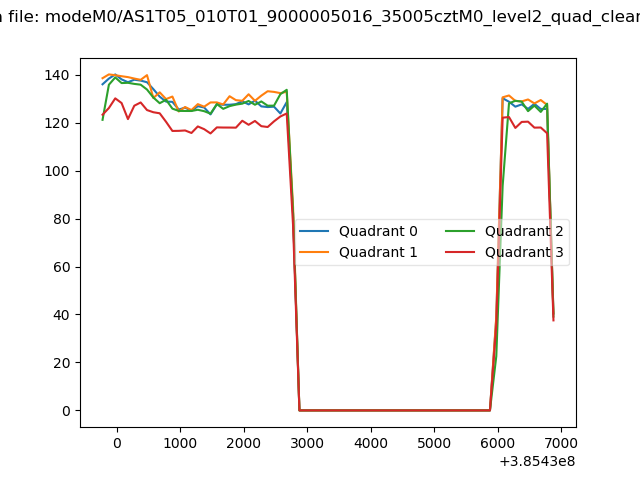 |
|
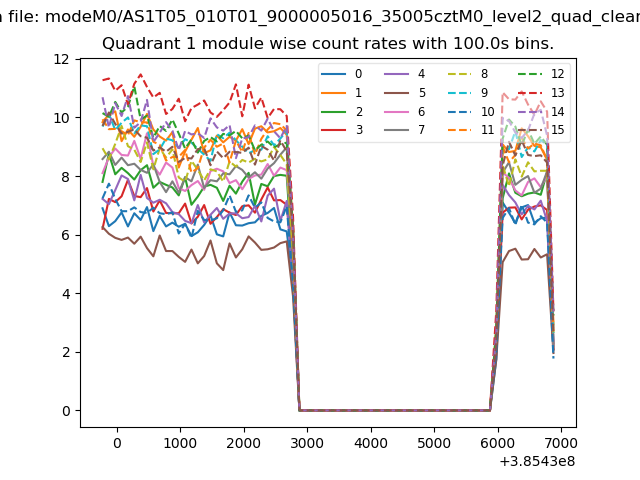
| Module-wise count rates for Quadrant A Data is divided into 100 sec bins |
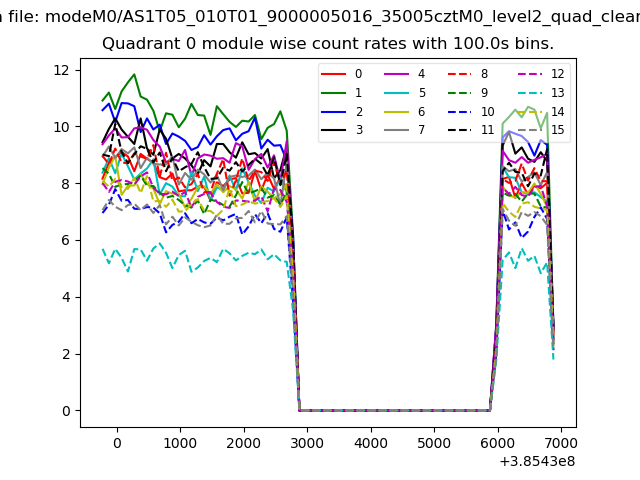 |
 |
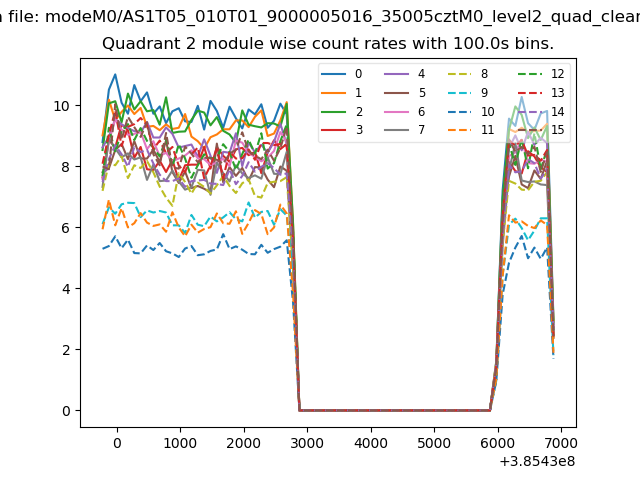
| Module-wise count rates for Quadrant B Data is divided into 100 sec bins |
 |
 |
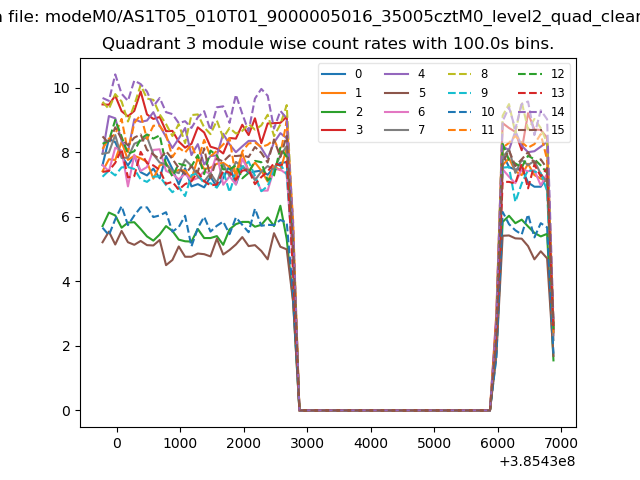
| Module-wise count rates for Quadrant C Data is divided into 100 sec bins |
 |
 |
| Module-wise count rates for Quadrant D Data is divided into 100 sec bins |
 |
 |
| Parameter | Plot |
|---|---|
| CZT HV Monitor | 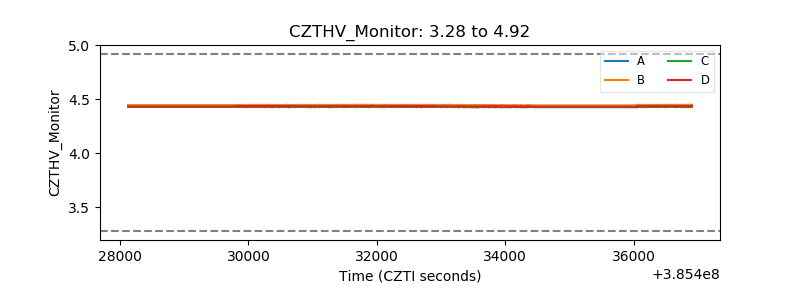 |
| D_VDD | 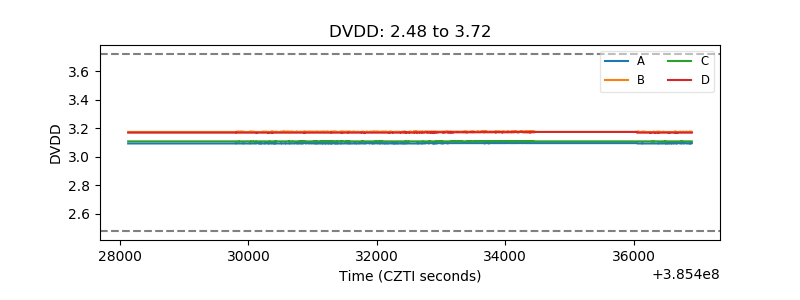 |
| Temperature 1 | 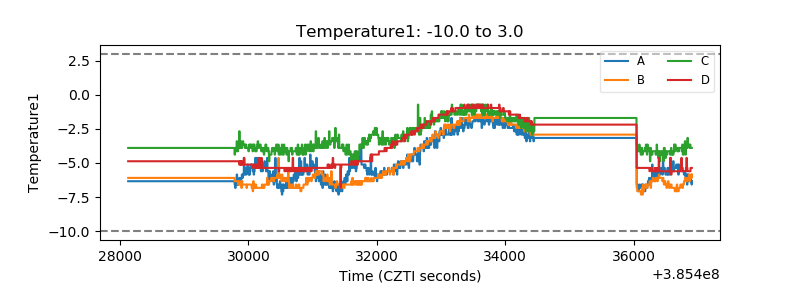 |
| Veto HV Monitor | 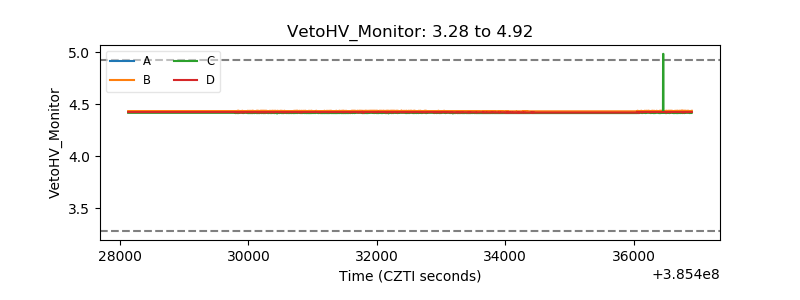 |
| Veto LLD | 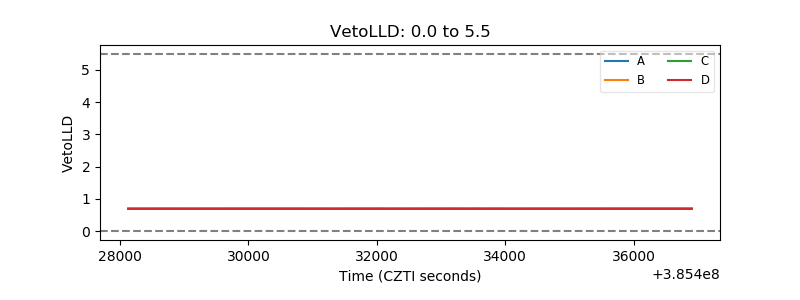 |
| Alpha Counter |  |
| _CPM_Rate | 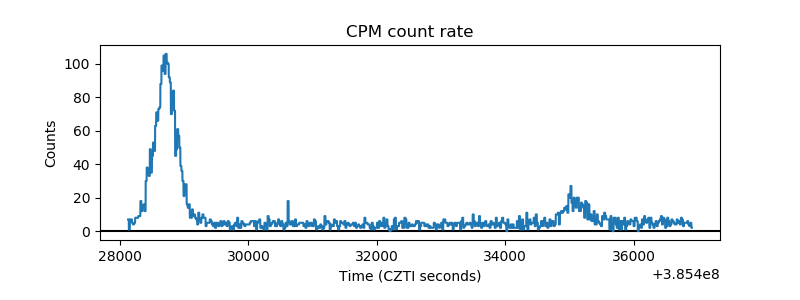 |
| CZT Counter | 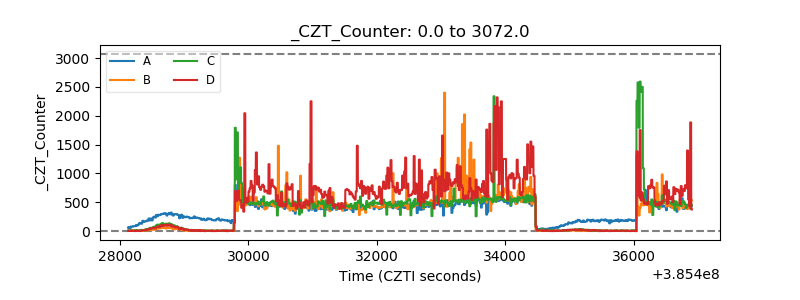 |
| +2.5 Volts monitor |  |
| +5 Volts monitor |  |
| _ROLL_ROT | 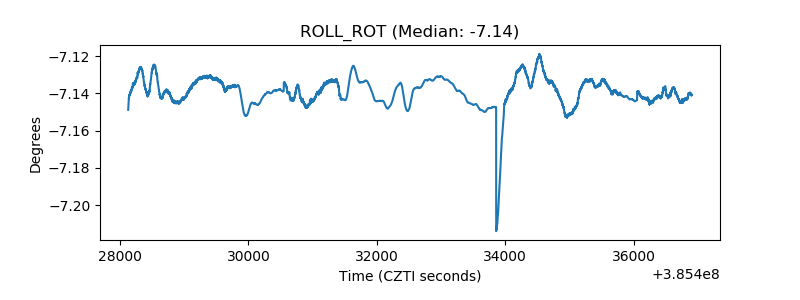 |
| _Roll_DEC | 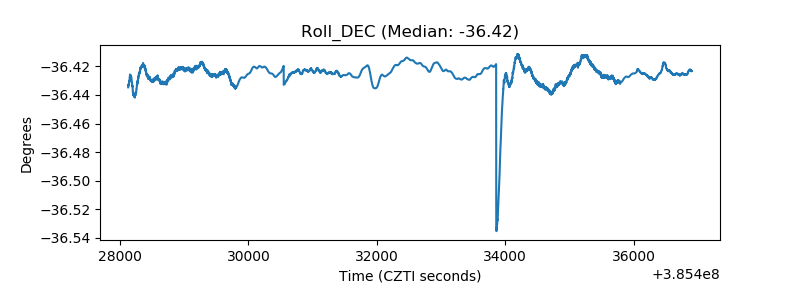 |
| _Roll_RA | 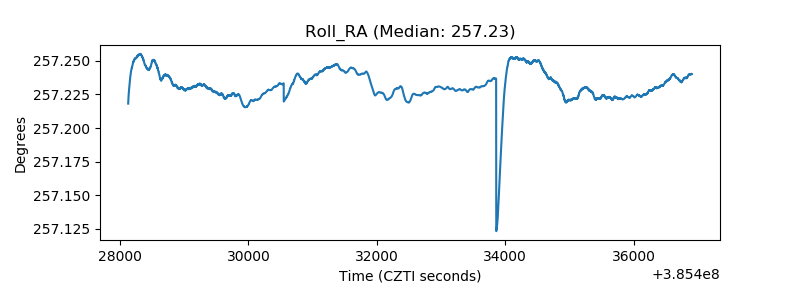 |
| Veto Counter | 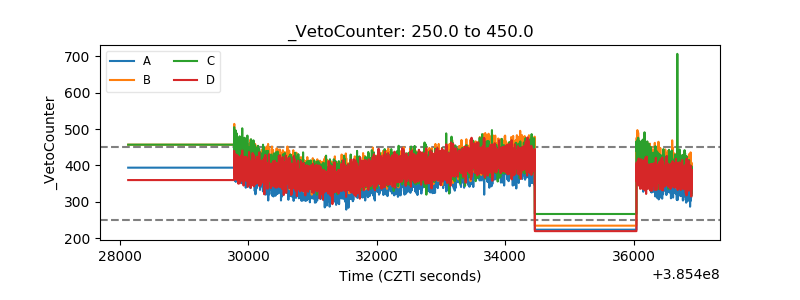 |