| Param | Original file | Final file |
|---|---|---|
| Filename | modeM0/AS1T05_010T01_9000005016_35029cztM0_level2.evt | modeM0/AS1T05_010T01_9000005016_35029cztM0_level2_quad_clean.evt |
| Size (bytes) | 453,386,880 | 66,075,840 |
| Size | 432.4 MB | 63.0 MB |
| Events in quadrant A | 2,819,850 | 417,407 |
| Events in quadrant B | 3,065,039 | 420,056 |
| Events in quadrant C | 3,014,690 | 409,344 |
| Events in quadrant D | 4,477,670 | 388,617 |
| Mode M0 | |||
|---|---|---|---|
| Quadrant | BADHDUFLAG | Total packets | Discarded packets |
| A | 0 | 11455 | 3 |
| B | 0 | 12240 | 2 |
| C | 0 | 11972 | 2 |
| D | 0 | 16949 | 2 |
| Mode M9 | |||
|---|---|---|---|
| Quadrant | BADHDUFLAG | Total packets | Discarded packets |
| A | 0 | 28 | 0 |
| B | 0 | 28 | 0 |
| C | 0 | 28 | 0 |
| D | 0 | 29 | 0 |
| Mode SS | |||
|---|---|---|---|
| Quadrant | BADHDUFLAG | Total packets | Discarded packets |
| A | 0 | 106 | 0 |
| B | 0 | 106 | 0 |
| C | 0 | 106 | 0 |
| D | 0 | 106 | 0 |
| Quadrant | Total seconds | Saturated seconds | Saturation percentage |
|---|---|---|---|
| A | 5215 | 10 | 0.191755% |
| B | 5215 | 47 | 0.901246% |
| C | 5215 | 48 | 0.920422% |
| D | 5215 | 231 | 4.429530% |
Noise dominated data is calculated using 1-second bins in cleaned event files. If a bin has >2000 counts, and if more than 50% of those come from <1% of pixels, then it is considered to be noise-dominated and hence unusable.
| Quadrant | # 1 sec bins | Bins with >0 counts | Bins with >2000 counts | High rate bins dominated by noise | Noise dominated (total time) | Noise dominated (detector-on time) | Marked lightcurve |
|---|---|---|---|---|---|---|---|
| A | 7217 | 5216 | 0 | 0 | 0.00% | 0.00% | 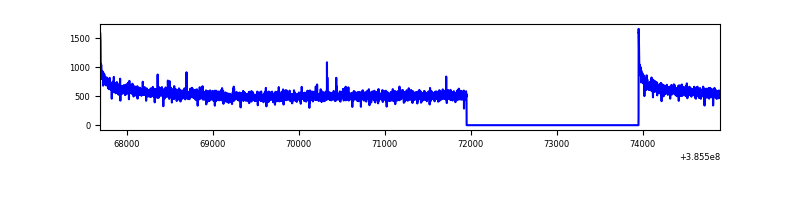 |
| B | 7217 | 5216 | 25 | 25 | 0.35% | 0.48% | 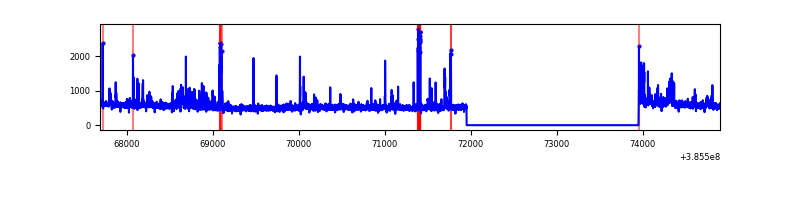 |
| C | 7217 | 5216 | 37 | 37 | 0.51% | 0.71% | 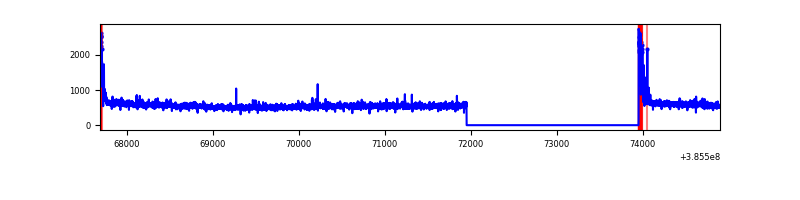 |
| D | 7217 | 5216 | 192 | 192 | 2.66% | 3.68% | 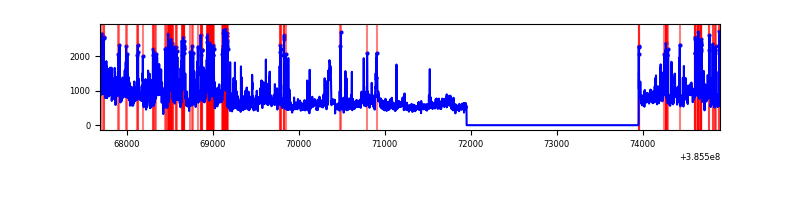 |
Top three noisy pixels from each quadrant. If the there are fewer than three noisy pixels in the level2.evt file, extra rows are filled as -1
| Pixel properties | Quadrant properties | ||||||
|---|---|---|---|---|---|---|---|
| Quadrant | DetID | PixID | Counts | Sigma | Mean | Median | Sigma |
| A | 10 | 83 | 80459 | 564.8 | 705 | 695 | 141.2 |
| A | 13 | 6 | 13213 | 88.64 | 705 | 695 | 141.2 |
| A | 13 | 254 | 8281 | 53.72 | 705 | 695 | 141.2 |
| B | 4 | 232 | 80654 | 614.39 | 698 | 687 | 130.2 |
| B | 5 | 200 | 69721 | 530.39 | 698 | 687 | 130.2 |
| B | 5 | 172 | 64647 | 491.41 | 698 | 687 | 130.2 |
| C | 15 | 214 | 219620 | 1430.68 | 669 | 678 | 153.0 |
| C | 0 | 10 | 129491 | 841.73 | 669 | 678 | 153.0 |
| C | 14 | 67 | 38051 | 244.21 | 669 | 678 | 153.0 |
| D | 8 | 195 | 1056267 | 6525.47 | 662 | 647 | 161.8 |
| D | 10 | 118 | 505553 | 3121.15 | 662 | 647 | 161.8 |
| D | 1 | 47 | 87117 | 534.53 | 662 | 647 | 161.8 |
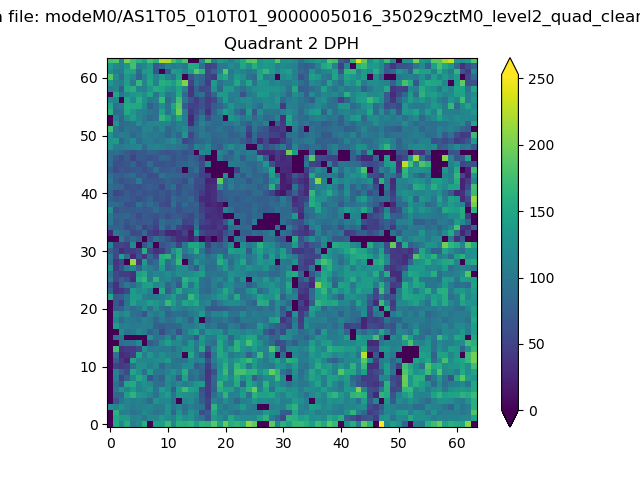
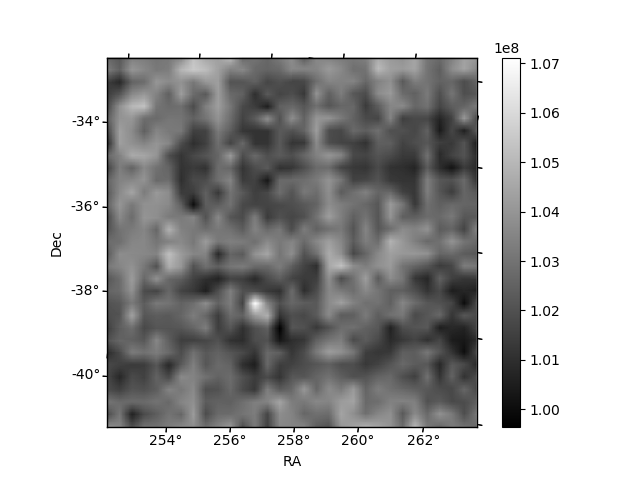
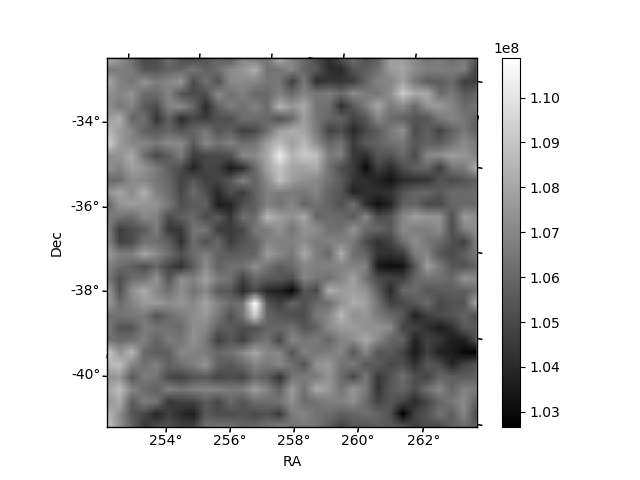
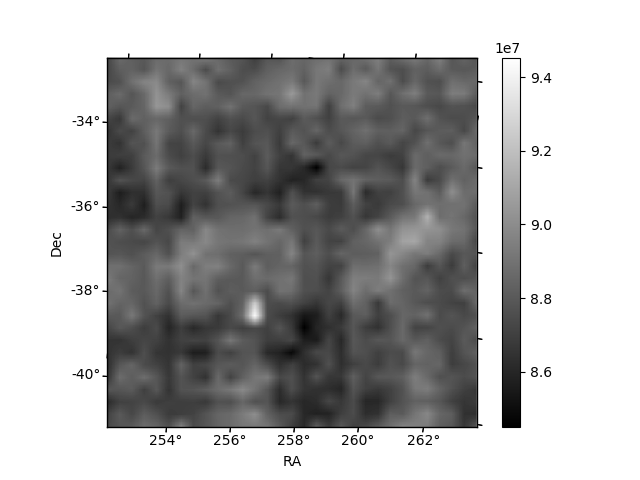
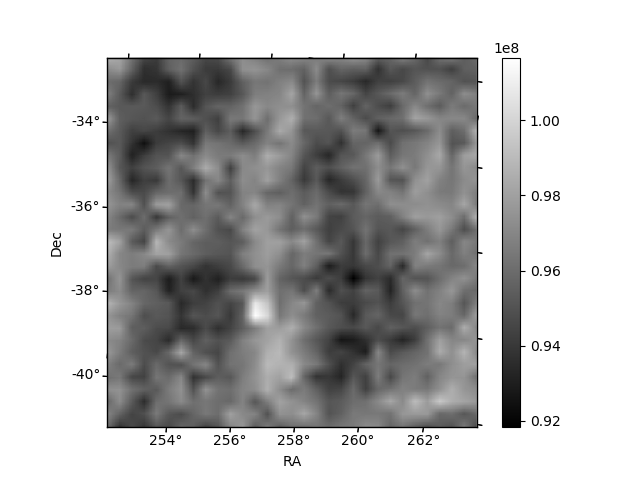
Histogram calculated using DETX and DETY for each event in the final _common_clean file
| Quadrant A | 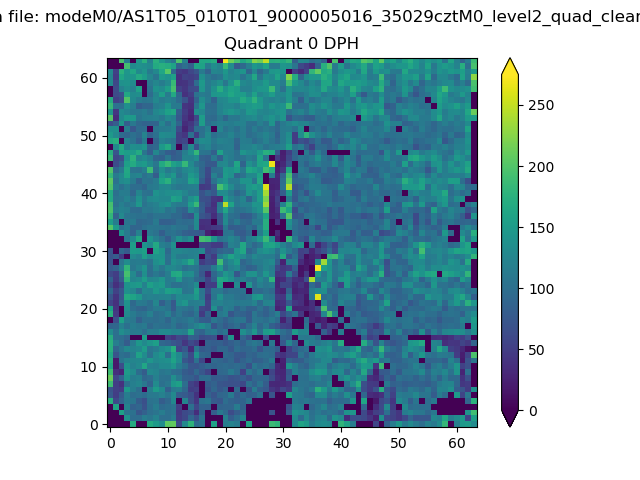 |
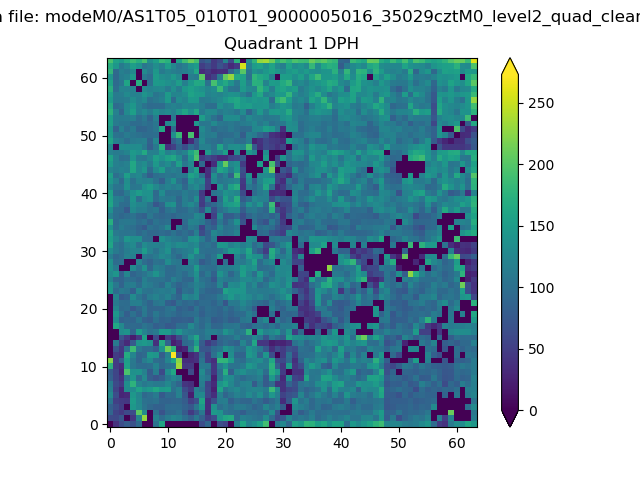 |
Quadrant B |
|---|---|---|---|
| Quadrant D | 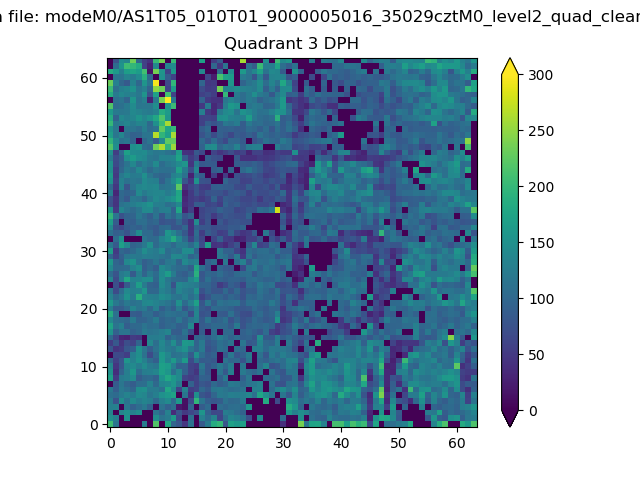 |
 |
Quadrant C |
| Plot type | Count rate plots | Images |
|---|---|---|
| Comparison with Poisson distribution Blue bars denote a histogram of data divided into 1 sec bins. Red curve is a Poisson curve with rate = median count rate of data. |
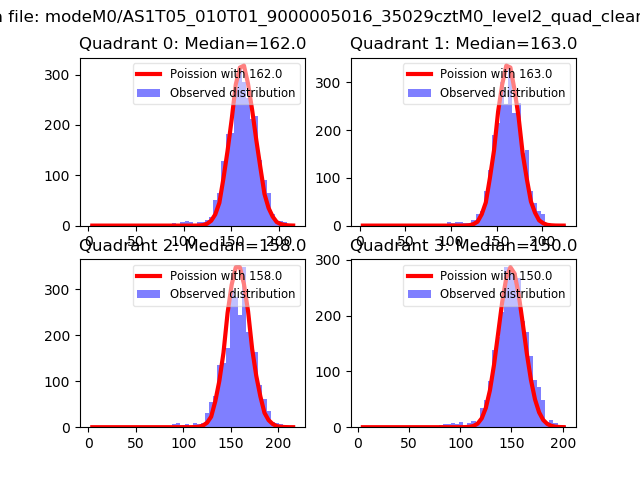 |
 |
| Quadrant-wise count rates Data is divided into 100 sec bins |
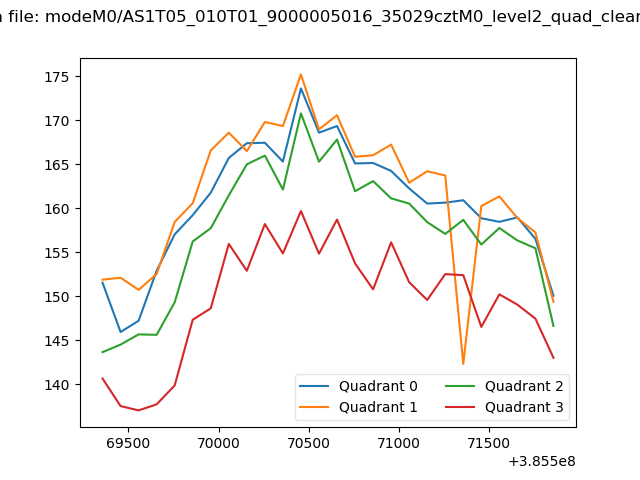 |
|
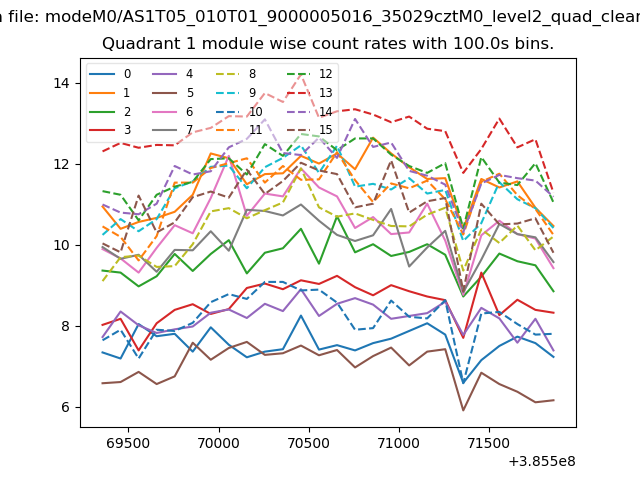
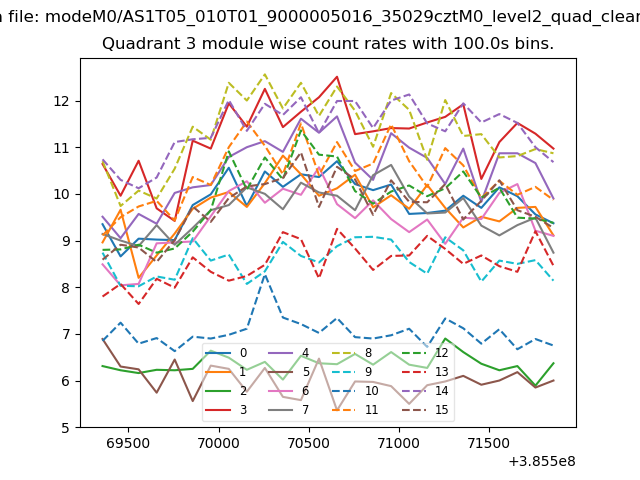
| Module-wise count rates for Quadrant A Data is divided into 100 sec bins |
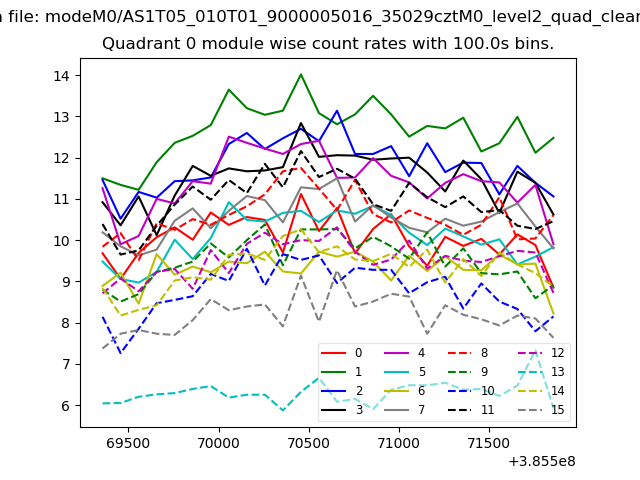 |
 |
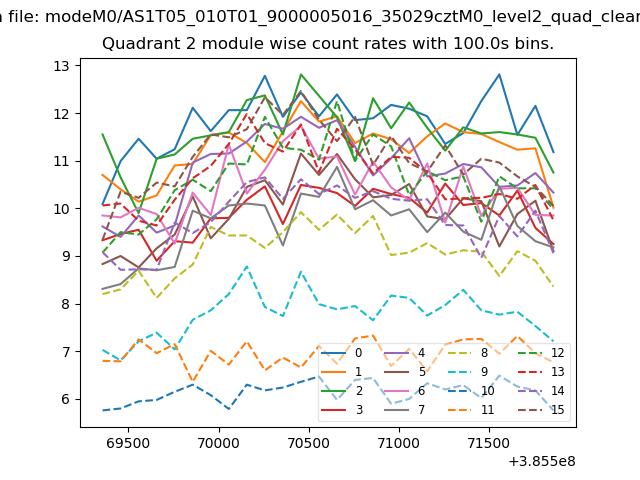
| Module-wise count rates for Quadrant B Data is divided into 100 sec bins |
 |
 |
| Module-wise count rates for Quadrant C Data is divided into 100 sec bins |
 |
 |
| Module-wise count rates for Quadrant D Data is divided into 100 sec bins |
 |
 |
| Parameter | Plot |
|---|---|
| CZT HV Monitor | 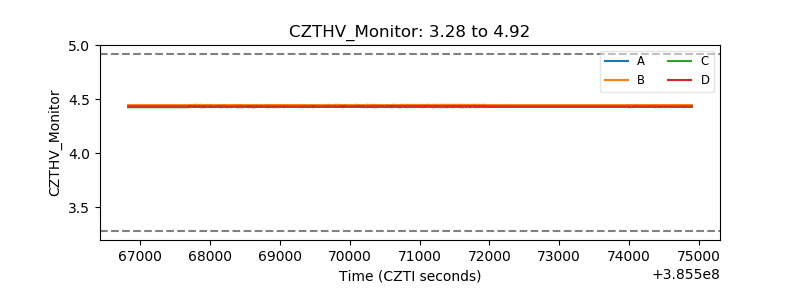 |
| D_VDD | 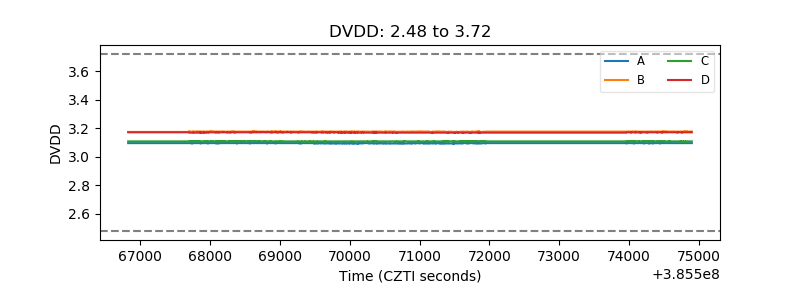 |
| Temperature 1 | 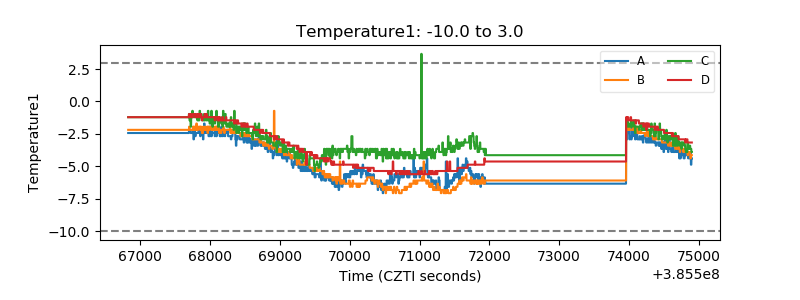 |
| Veto HV Monitor | 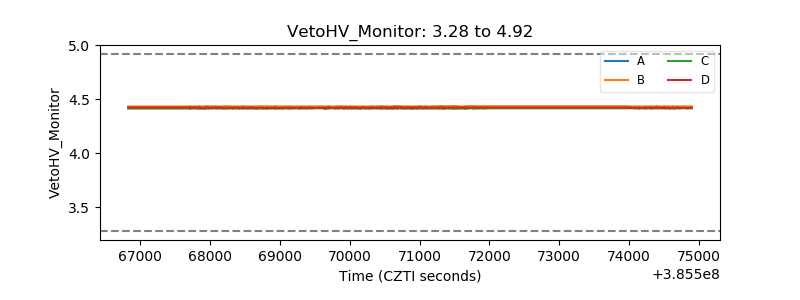 |
| Veto LLD | 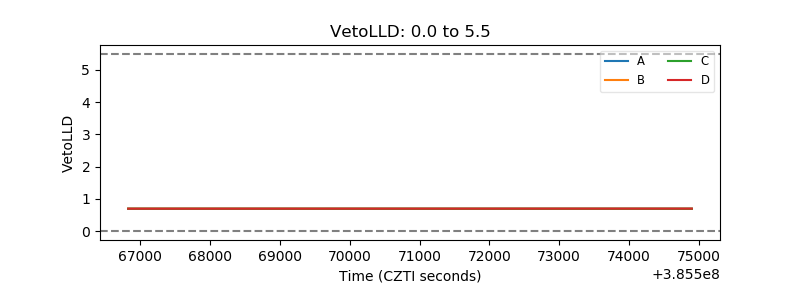 |
| Alpha Counter | 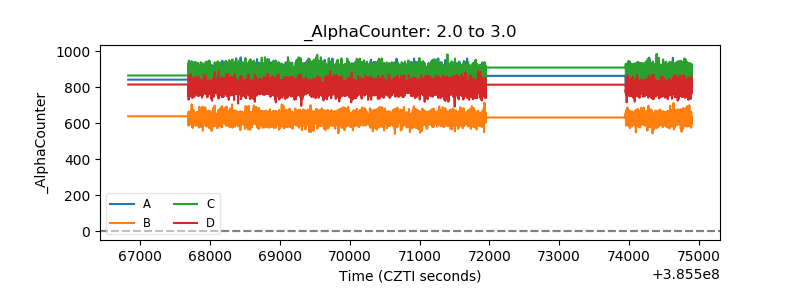 |
| _CPM_Rate |  |
| CZT Counter | 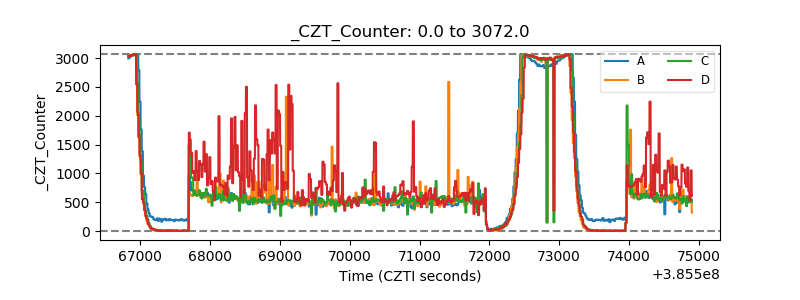 |
| +2.5 Volts monitor |  |
| +5 Volts monitor |  |
| _ROLL_ROT | 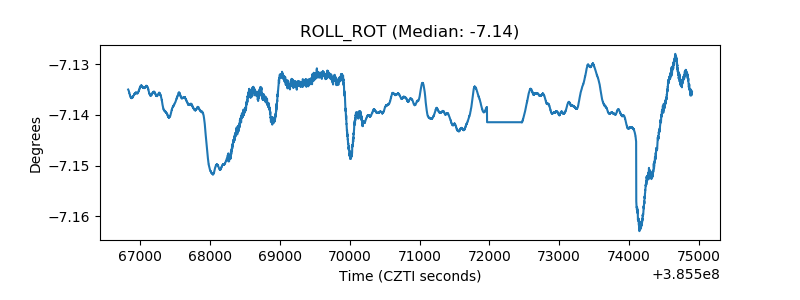 |
| _Roll_DEC | 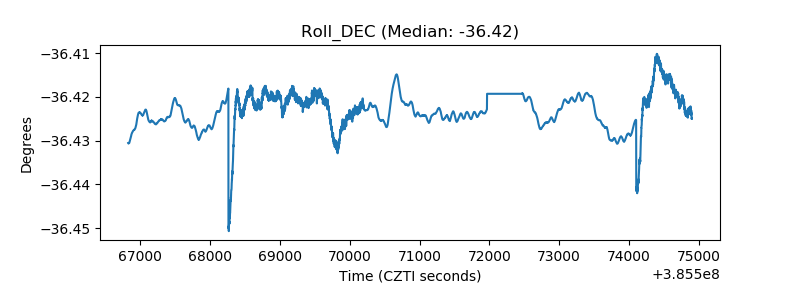 |
| _Roll_RA | 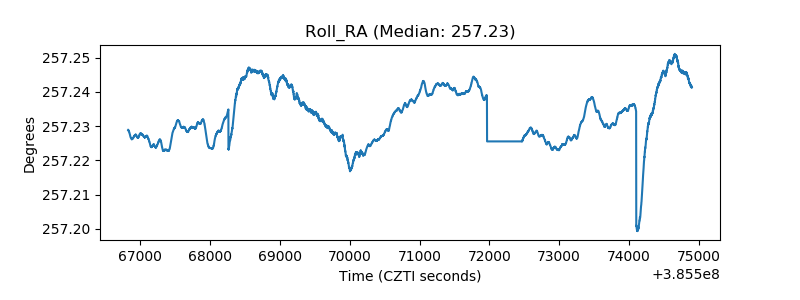 |
| Veto Counter | 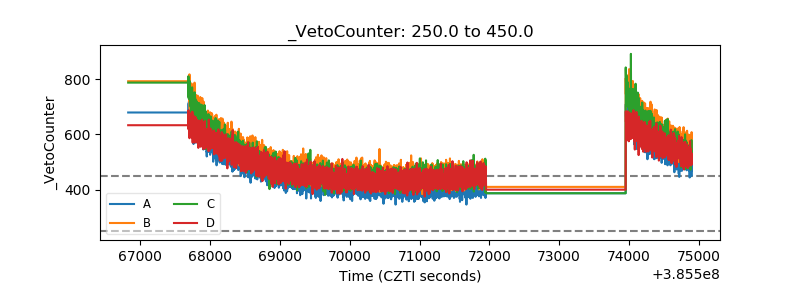 |