| Param | Original file | Final file |
|---|---|---|
| Filename | modeM0/AS1A10_053T44_9000005020cztM0_level2.fits | modeM0/AS1A10_053T44_9000005020cztM0_level2_quad_clean.evt |
| Size (bytes) | 57,585,600 | 41,921,280 |
| Size | 54.9 MB | 40.0 MB |
| Events in quadrant A | 357,136 | 224,106 |
| Events in quadrant B | 331,826 | 223,652 |
| Events in quadrant C | 359,252 | 224,196 |
| Events in quadrant D | 303,222 | 204,072 |
| Mode M0 | |||
|---|---|---|---|
| Quadrant | BADHDUFLAG | Total packets | Discarded packets |
| A | 0 | 11559 | 0 |
| B | 0 | 14459 | 0 |
| C | 0 | 12151 | 0 |
| D | 0 | 17000 | 0 |
| Mode M9 | |||
|---|---|---|---|
| Quadrant | BADHDUFLAG | Total packets | Discarded packets |
| A | 0 | 24 | 0 |
| B | 0 | 24 | 0 |
| C | 0 | 24 | 0 |
| D | 0 | 24 | 0 |
| Mode SS | |||
|---|---|---|---|
| Quadrant | BADHDUFLAG | Total packets | Discarded packets |
| A | 0 | 116 | 0 |
| B | 0 | 116 | 0 |
| C | 0 | 116 | 0 |
| D | 0 | 116 | 0 |
| Quadrant | Total seconds | Saturated seconds | Saturation percentage |
|---|---|---|---|
| A | 5613 | 12 | 0.213789% |
| B | 5613 | 337 | 6.003919% |
| C | 5613 | 37 | 0.659184% |
| D | 5613 | 181 | 3.224657% |
Noise dominated data is calculated using 1-second bins in cleaned event files. If a bin has >2000 counts, and if more than 50% of those come from <1% of pixels, then it is considered to be noise-dominated and hence unusable.
| Quadrant | # 1 sec bins | Bins with >0 counts | Bins with >2000 counts | High rate bins dominated by noise | Noise dominated (total time) | Noise dominated (detector-on time) | Marked lightcurve |
|---|---|---|---|---|---|---|---|
| A | 7736 | 5612 | 0 | 0 | 0.00% | 0.00% | 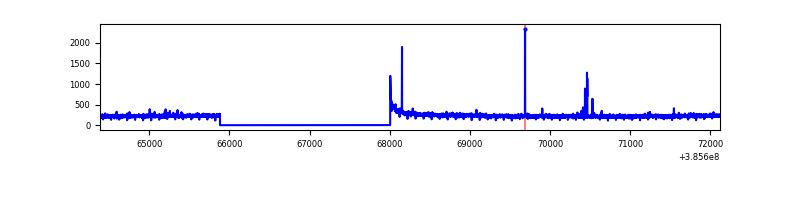 |
| B | 7736 | 5609 | 0 | 0 | 0.00% | 0.00% | 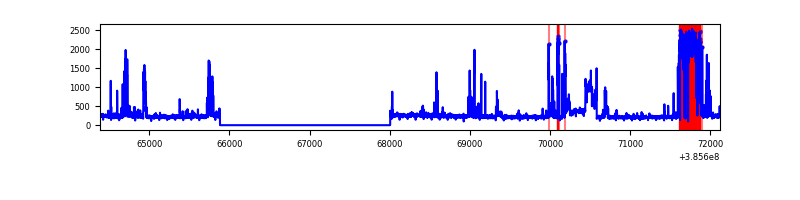 |
| C | 7737 | 5610 | 0 | 0 | 0.00% | 0.00% | 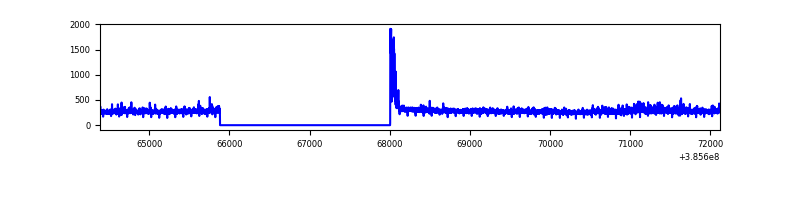 |
| D | 7737 | 5612 | 0 | 0 | 0.00% | 0.00% | 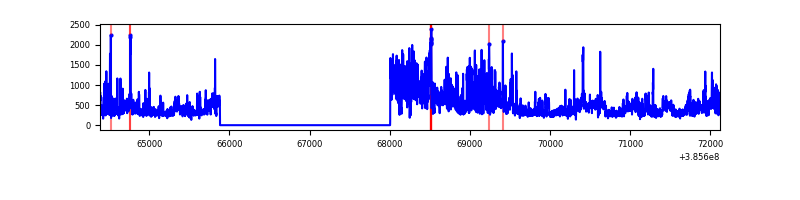 |
Top three noisy pixels from each quadrant. If the there are fewer than three noisy pixels in the level2.evt file, extra rows are filled as -1
| Pixel properties | Quadrant properties | ||||||
|---|---|---|---|---|---|---|---|
| Quadrant | DetID | PixID | Counts | Sigma | Mean | Median | Sigma |
| A | 7 | 110 | 345 | 10.37 | 93 | 88 | 24.8 |
| A | 9 | 19 | 292 | 8.23 | 93 | 88 | 24.8 |
| A | 14 | 79 | 272 | 7.42 | 93 | 88 | 24.8 |
| B | 3 | 80 | 267 | 9.4 | 87 | 84 | 19.5 |
| B | 2 | 9 | 263 | 9.19 | 87 | 84 | 19.5 |
| B | 5 | 232 | 216 | 6.78 | 87 | 84 | 19.5 |
| C | 1 | 80 | 304 | 8.1 | 95 | 90 | 26.4 |
| C | 1 | 81 | 298 | 7.87 | 95 | 90 | 26.4 |
| C | 1 | 65 | 286 | 7.42 | 95 | 90 | 26.4 |
| D | 10 | 189 | 242 | 6.55 | 86 | 80 | 24.7 |
| D | 10 | 113 | 238 | 6.39 | 86 | 80 | 24.7 |
| D | 6 | 62 | 228 | 5.99 | 86 | 80 | 24.7 |
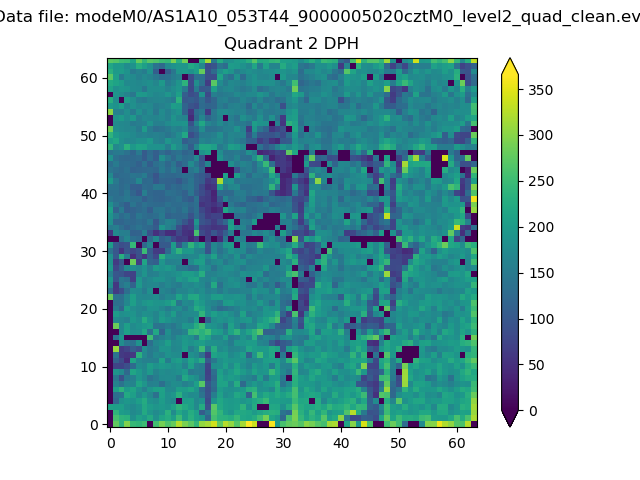
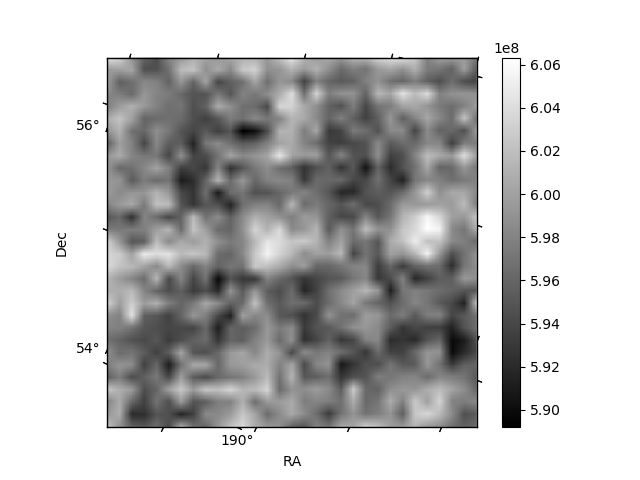
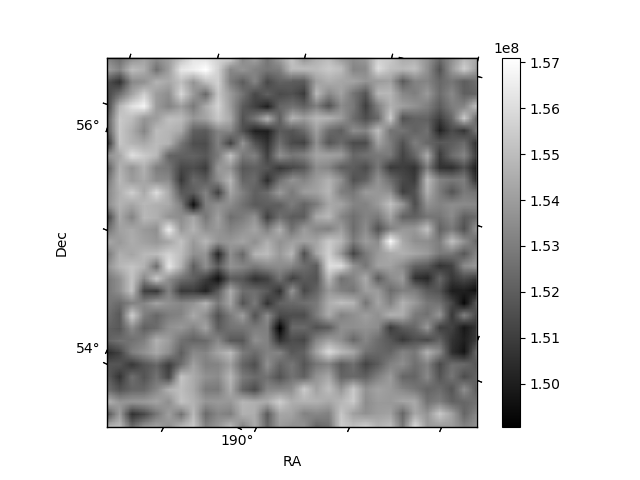
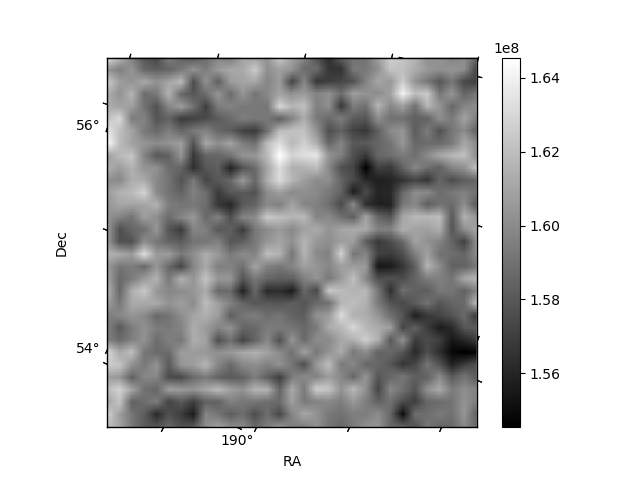
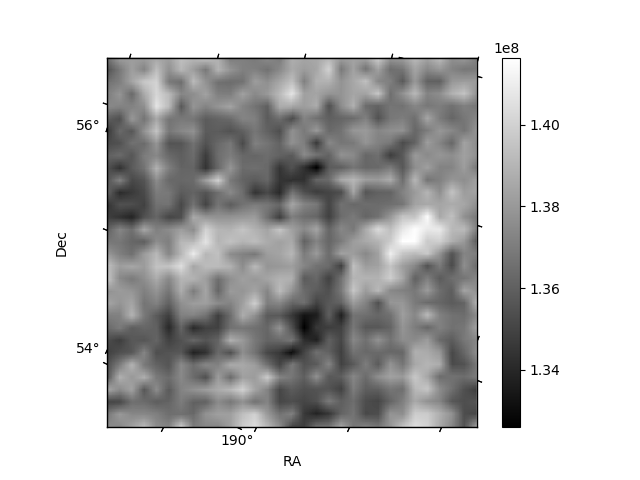
Histogram calculated using DETX and DETY for each event in the final _common_clean file
| Quadrant A | 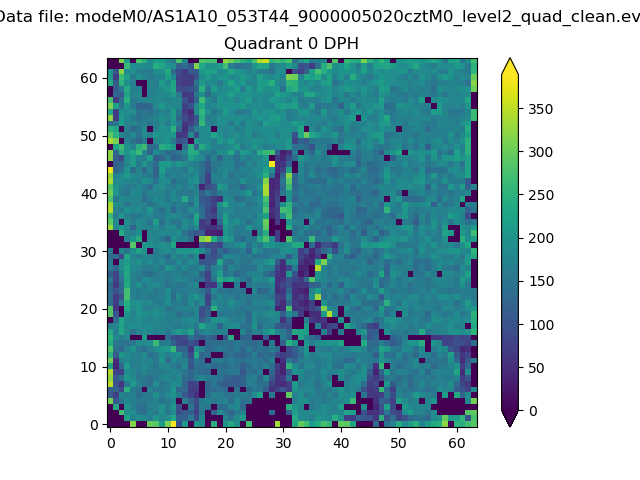 |
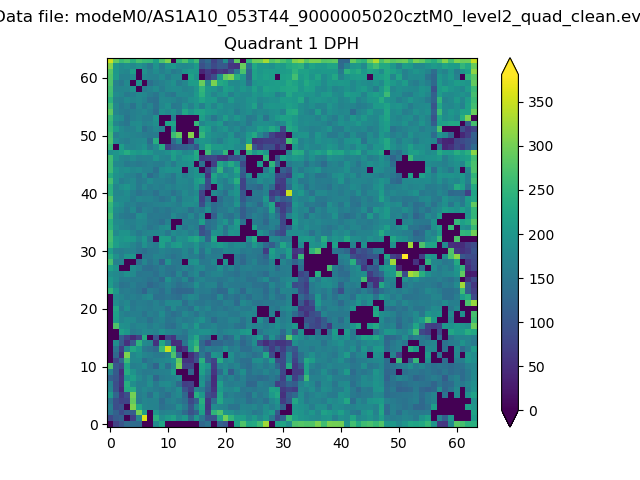 |
Quadrant B |
|---|---|---|---|
| Quadrant D | 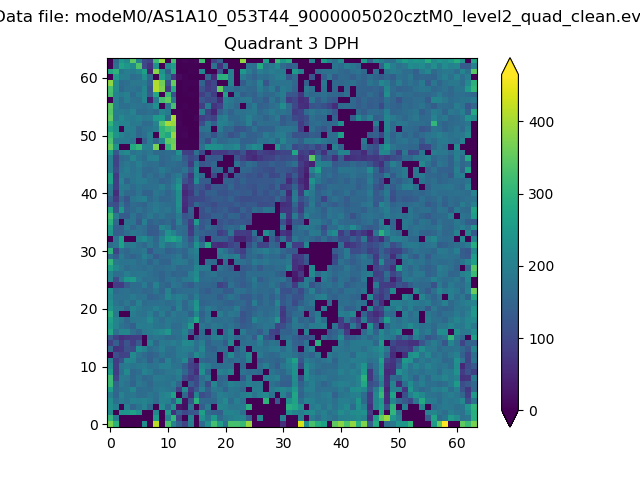 |
 |
Quadrant C |
| Plot type | Count rate plots | Images |
|---|---|---|
| Comparison with Poisson distribution Blue bars denote a histogram of data divided into 1 sec bins. Red curve is a Poisson curve with rate = median count rate of data. |
 |
 |
| Quadrant-wise count rates Data is divided into 100 sec bins |
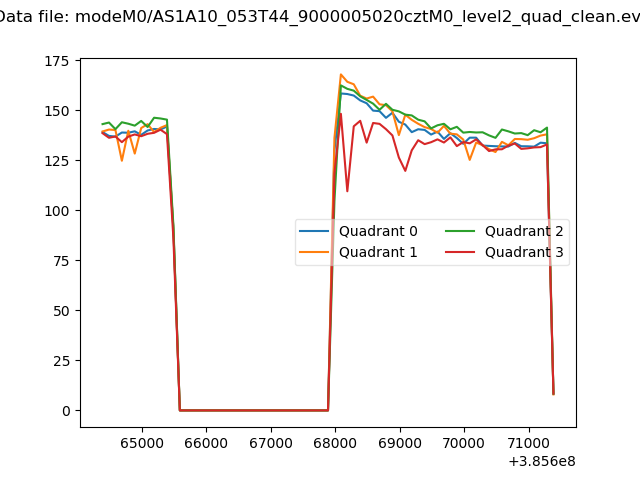 |
|
| Module-wise count rates for Quadrant A Data is divided into 100 sec bins |
 |
 |
| Module-wise count rates for Quadrant B Data is divided into 100 sec bins |
 |
 |
| Module-wise count rates for Quadrant C Data is divided into 100 sec bins |
 |
 |
| Module-wise count rates for Quadrant D Data is divided into 100 sec bins |
 |
 |
| Parameter | Plot |
|---|---|
| CZT HV Monitor | 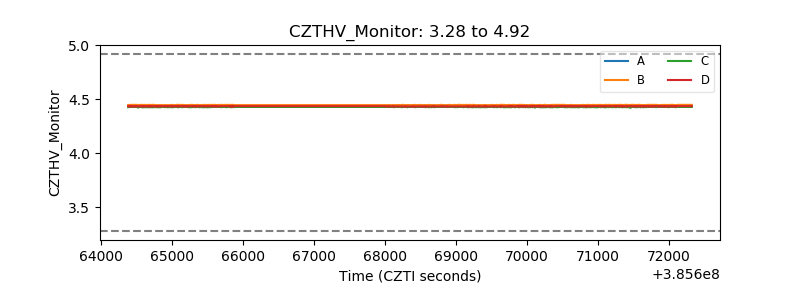 |
| D_VDD | 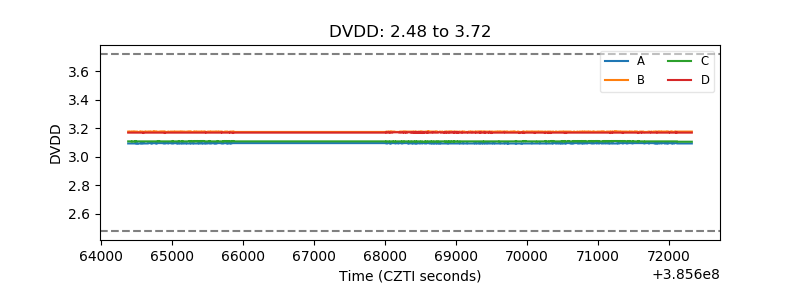 |
| Temperature 1 |  |
| Veto HV Monitor |  |
| Veto LLD | 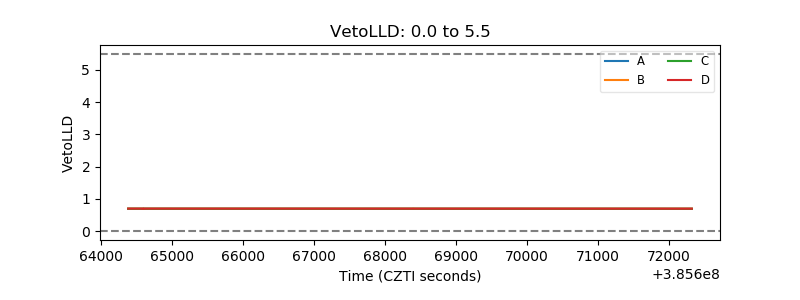 |
| Alpha Counter |  |
| _CPM_Rate | 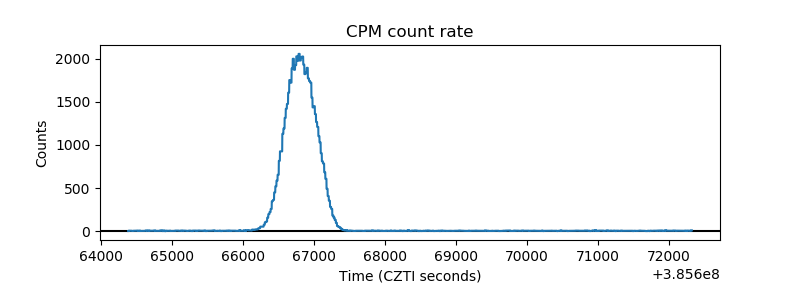 |
| CZT Counter | 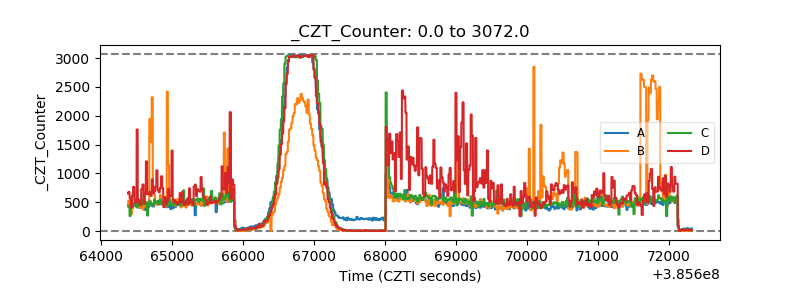 |
| +2.5 Volts monitor |  |
| +5 Volts monitor | 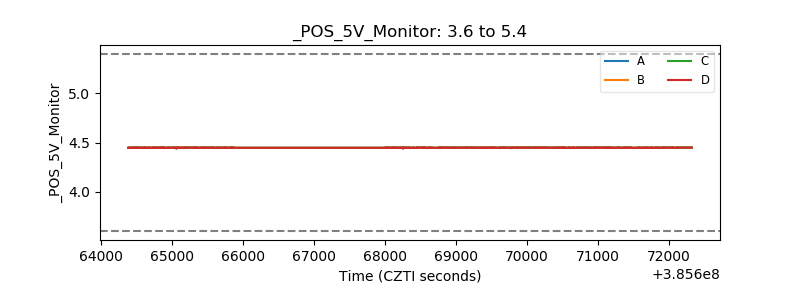 |
| _ROLL_ROT | 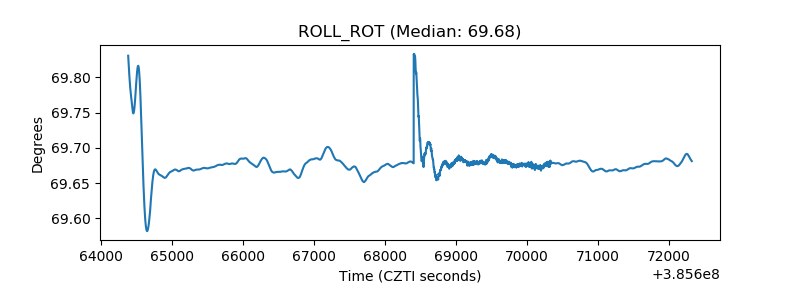 |
| _Roll_DEC | 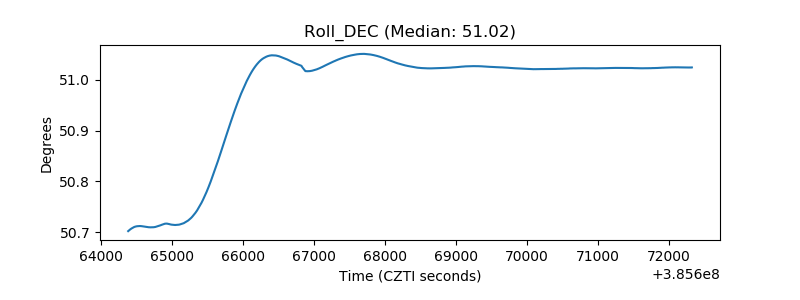 |
| _Roll_RA | 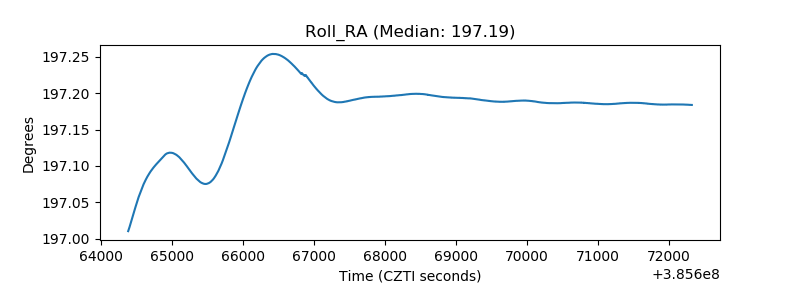 |
| Veto Counter | 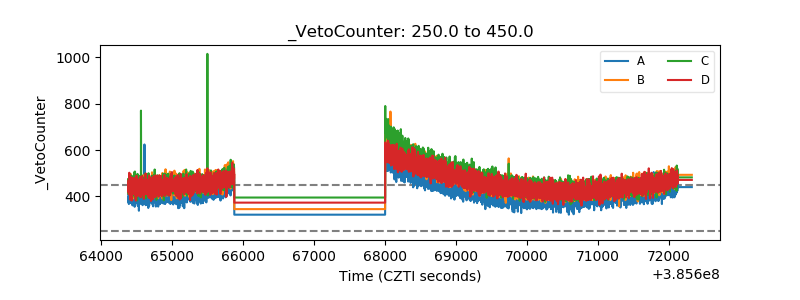 |