| Param | Original file | Final file |
|---|---|---|
| Filename | modeM0/AS1A10_057T01_9000005022cztM0_level2.fits | modeM0/AS1A10_057T01_9000005022cztM0_level2_quad_clean.evt |
| Size (bytes) | 618,649,920 | 556,663,680 |
| Size | 590.0 MB | 530.9 MB |
| Events in quadrant A | 3,842,470 | 3,360,440 |
| Events in quadrant B | 3,588,972 | 3,214,296 |
| Events in quadrant C | 3,739,604 | 3,157,354 |
| Events in quadrant D | 3,121,528 | 2,683,536 |
| Mode M0 | |||
|---|---|---|---|
| Quadrant | BADHDUFLAG | Total packets | Discarded packets |
| A | 0 | 133876 | 0 |
| B | 0 | 157113 | 0 |
| C | 0 | 140007 | 0 |
| D | 0 | 219371 | 0 |
| Mode M9 | |||
|---|---|---|---|
| Quadrant | BADHDUFLAG | Total packets | Discarded packets |
| A | 0 | 252 | 0 |
| B | 0 | 252 | 0 |
| C | 0 | 252 | 0 |
| D | 0 | 252 | 0 |
| Mode SS | |||
|---|---|---|---|
| Quadrant | BADHDUFLAG | Total packets | Discarded packets |
| A | 0 | 1324 | 0 |
| B | 0 | 1324 | 0 |
| C | 0 | 1324 | 0 |
| D | 0 | 1324 | 0 |
| Quadrant | Total seconds | Saturated seconds | Saturation percentage |
|---|---|---|---|
| A | 64758 | 133 | 0.205380% |
| B | 64758 | 2515 | 3.883690% |
| C | 64758 | 517 | 0.798357% |
| D | 64758 | 4024 | 6.213904% |
Noise dominated data is calculated using 1-second bins in cleaned event files. If a bin has >2000 counts, and if more than 50% of those come from <1% of pixels, then it is considered to be noise-dominated and hence unusable.
| Quadrant | # 1 sec bins | Bins with >0 counts | Bins with >2000 counts | High rate bins dominated by noise | Noise dominated (total time) | Noise dominated (detector-on time) | Marked lightcurve |
|---|---|---|---|---|---|---|---|
| A | 88871 | 64749 | 0 | 0 | 0.00% | 0.00% |  |
| B | 88871 | 64649 | 0 | 0 | 0.00% | 0.00% |  |
| C | 88870 | 64744 | 0 | 0 | 0.00% | 0.00% |  |
| D | 88871 | 64669 | 0 | 0 | 0.00% | 0.00% | 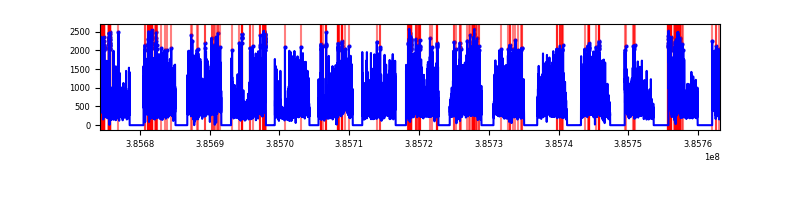 |
Top three noisy pixels from each quadrant. If the there are fewer than three noisy pixels in the level2.evt file, extra rows are filled as -1
| Pixel properties | Quadrant properties | ||||||
|---|---|---|---|---|---|---|---|
| Quadrant | DetID | PixID | Counts | Sigma | Mean | Median | Sigma |
| A | 7 | 110 | 3164 | 9.1 | 1003 | 947 | 243.7 |
| A | 9 | 19 | 3059 | 8.67 | 1003 | 947 | 243.7 |
| A | 0 | 29 | 2999 | 8.42 | 1003 | 947 | 243.7 |
| B | 2 | 9 | 3125 | 11.97 | 952 | 911 | 185.0 |
| B | 3 | 80 | 2759 | 9.99 | 952 | 911 | 185.0 |
| B | 2 | 8 | 2575 | 8.99 | 952 | 911 | 185.0 |
| C | 1 | 81 | 3164 | 8.8 | 989 | 931 | 253.7 |
| C | 1 | 80 | 3077 | 8.46 | 989 | 931 | 253.7 |
| C | 3 | 203 | 2956 | 7.98 | 989 | 931 | 253.7 |
| D | 7 | 3 | 2362 | 6.58 | 893 | 820 | 234.3 |
| D | 10 | 113 | 2322 | 6.41 | 893 | 820 | 234.3 |
| D | 4 | 160 | 2305 | 6.34 | 893 | 820 | 234.3 |
Histogram calculated using DETX and DETY for each event in the final _common_clean file
| Quadrant A |  |
 |
Quadrant B |
|---|---|---|---|
| Quadrant D |  |
 |
Quadrant C |
| Plot type | Count rate plots | Images |
|---|---|---|
| Comparison with Poisson distribution Blue bars denote a histogram of data divided into 1 sec bins. Red curve is a Poisson curve with rate = median count rate of data. |
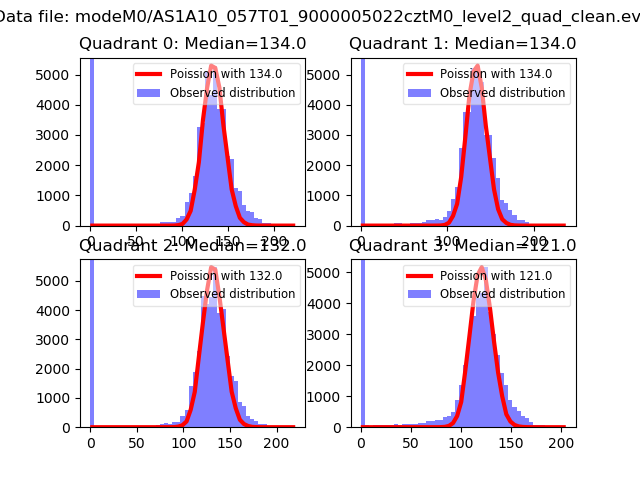 |
 |
| Quadrant-wise count rates Data is divided into 100 sec bins |
 |
|
| Module-wise count rates for Quadrant A Data is divided into 100 sec bins |
 |
 |
| Module-wise count rates for Quadrant B Data is divided into 100 sec bins |
 |
 |
| Module-wise count rates for Quadrant C Data is divided into 100 sec bins |
 |
 |
| Module-wise count rates for Quadrant D Data is divided into 100 sec bins |
 |
 |
| Parameter | Plot |
|---|---|
| CZT HV Monitor |  |
| D_VDD | 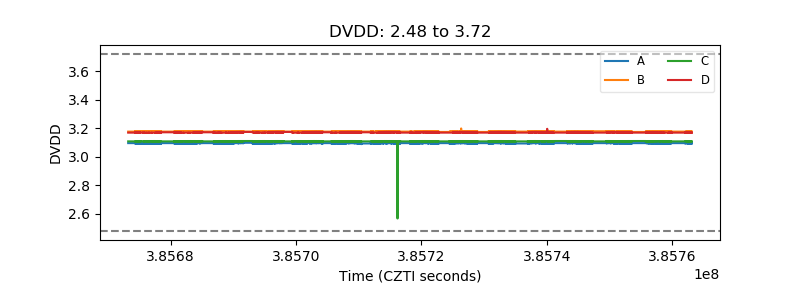 |
| Temperature 1 |  |
| Veto HV Monitor |  |
| Veto LLD |  |
| Alpha Counter |  |
| _CPM_Rate |  |
| CZT Counter |  |
| +2.5 Volts monitor |  |
| +5 Volts monitor |  |
| _ROLL_ROT |  |
| _Roll_DEC |  |
| _Roll_RA |  |
| Veto Counter |  |