| Param | Original file | Final file |
|---|---|---|
| Filename | modeM0/AS1A10_057T01_9000005022_35048cztM0_level2.evt | modeM0/AS1A10_057T01_9000005022_35048cztM0_level2_quad_clean.evt |
| Size (bytes) | 459,489,600 | 66,669,120 |
| Size | 438.2 MB | 63.6 MB |
| Events in quadrant A | 2,480,607 | 424,953 |
| Events in quadrant B | 2,880,258 | 424,509 |
| Events in quadrant C | 3,244,824 | 417,943 |
| Events in quadrant D | 4,948,492 | 378,088 |
| Mode M0 | |||
|---|---|---|---|
| Quadrant | BADHDUFLAG | Total packets | Discarded packets |
| A | 0 | 10912 | 3 |
| B | 0 | 12152 | 2 |
| C | 0 | 12784 | 2 |
| D | 0 | 18416 | 2 |
| Mode M9 | |||
|---|---|---|---|
| Quadrant | BADHDUFLAG | Total packets | Discarded packets |
| A | 0 | 26 | 0 |
| B | 0 | 26 | 0 |
| C | 0 | 26 | 0 |
| D | 0 | 27 | 0 |
| Mode SS | |||
|---|---|---|---|
| Quadrant | BADHDUFLAG | Total packets | Discarded packets |
| A | 0 | 110 | 0 |
| B | 0 | 110 | 0 |
| C | 0 | 110 | 0 |
| D | 0 | 110 | 0 |
| Quadrant | Total seconds | Saturated seconds | Saturation percentage |
|---|---|---|---|
| A | 5321 | 5 | 0.093967% |
| B | 5321 | 98 | 1.841759% |
| C | 5321 | 144 | 2.706258% |
| D | 5321 | 334 | 6.277016% |
Noise dominated data is calculated using 1-second bins in cleaned event files. If a bin has >2000 counts, and if more than 50% of those come from <1% of pixels, then it is considered to be noise-dominated and hence unusable.
| Quadrant | # 1 sec bins | Bins with >0 counts | Bins with >2000 counts | High rate bins dominated by noise | Noise dominated (total time) | Noise dominated (detector-on time) | Marked lightcurve |
|---|---|---|---|---|---|---|---|
| A | 7025 | 5322 | 0 | 0 | 0.00% | 0.00% | 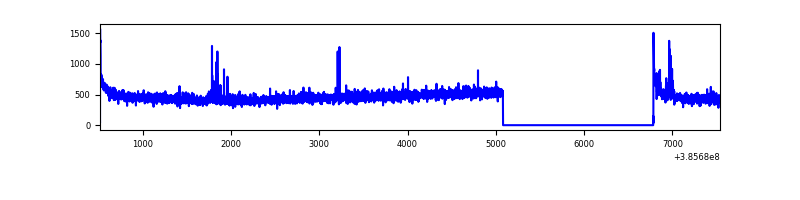 |
| B | 7025 | 5322 | 63 | 63 | 0.90% | 1.18% | 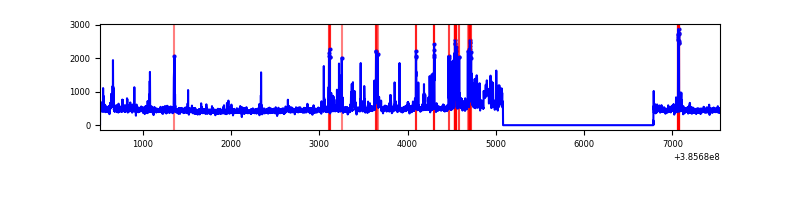 |
| C | 7025 | 5322 | 157 | 157 | 2.23% | 2.95% | 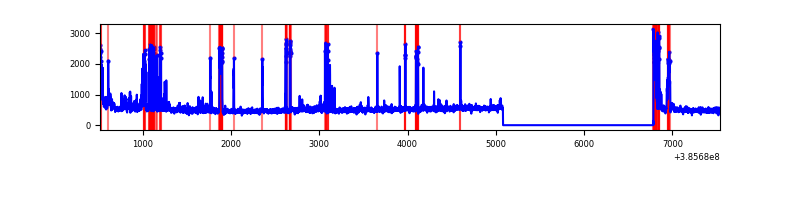 |
| D | 7025 | 5322 | 329 | 329 | 4.68% | 6.18% | 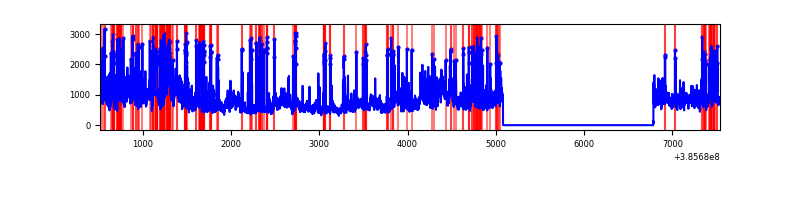 |
Top three noisy pixels from each quadrant. If the there are fewer than three noisy pixels in the level2.evt file, extra rows are filled as -1
| Pixel properties | Quadrant properties | ||||||
|---|---|---|---|---|---|---|---|
| Quadrant | DetID | PixID | Counts | Sigma | Mean | Median | Sigma |
| A | 10 | 83 | 75584 | 609.4 | 611 | 599 | 123.0 |
| A | 7 | 3 | 18289 | 143.77 | 611 | 599 | 123.0 |
| A | 10 | 255 | 13104 | 101.63 | 611 | 599 | 123.0 |
| B | 5 | 172 | 166280 | 1415.71 | 605 | 588 | 117.0 |
| B | 0 | 190 | 123465 | 1049.89 | 605 | 588 | 117.0 |
| B | 5 | 200 | 121623 | 1034.15 | 605 | 588 | 117.0 |
| C | 3 | 233 | 531946 | 3829.72 | 596 | 600 | 138.7 |
| C | 15 | 214 | 220868 | 1587.6 | 596 | 600 | 138.7 |
| C | 0 | 10 | 138413 | 993.3 | 596 | 600 | 138.7 |
| D | 8 | 195 | 1061317 | 7497.04 | 578 | 563 | 141.5 |
| D | 12 | 227 | 554014 | 3911.6 | 578 | 563 | 141.5 |
| D | 13 | 249 | 285090 | 2010.94 | 578 | 563 | 141.5 |
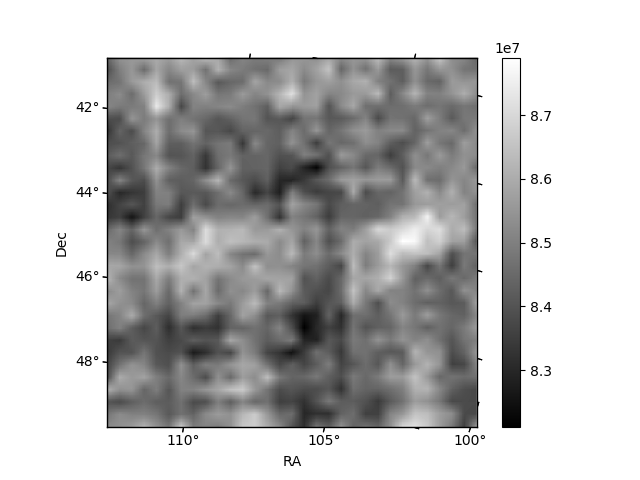
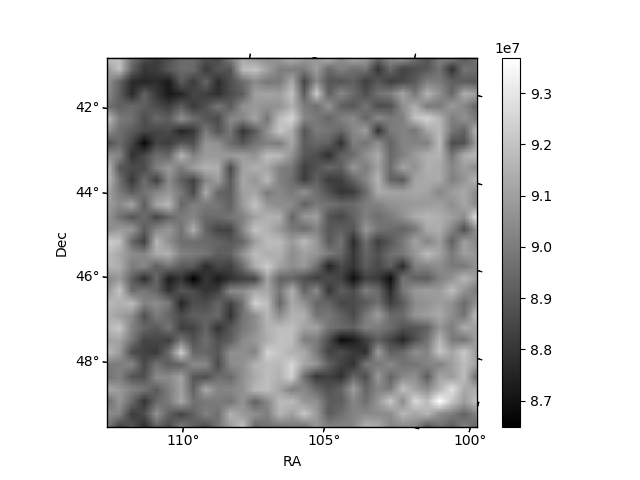
Histogram calculated using DETX and DETY for each event in the final _common_clean file
| Quadrant A | 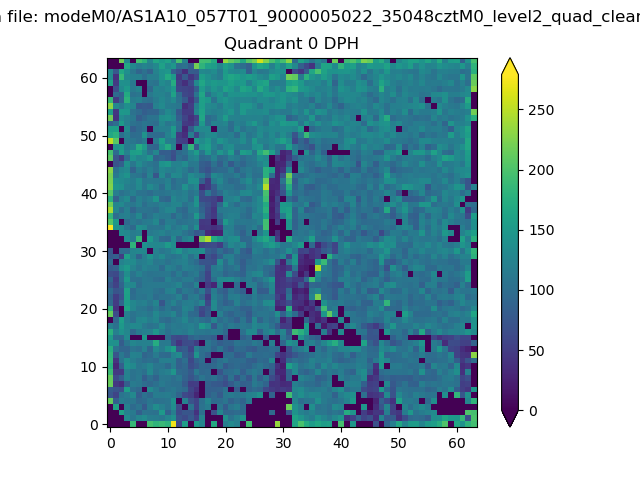 |
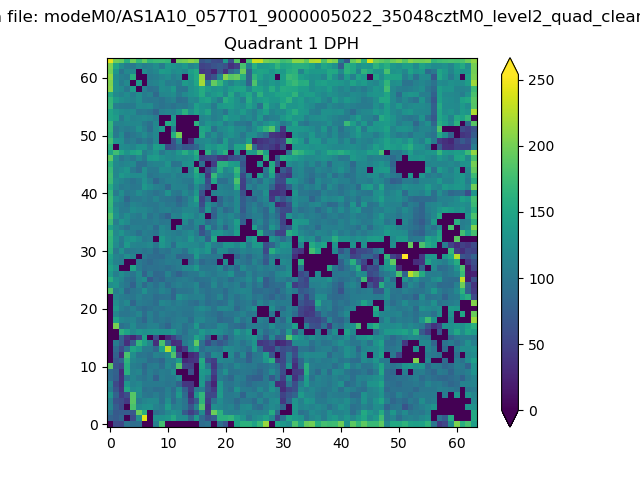 |
Quadrant B |
|---|---|---|---|
| Quadrant D | 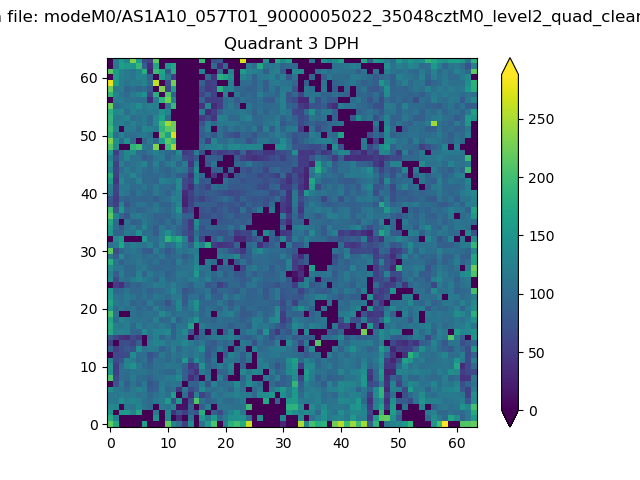 |
 |
Quadrant C |
| Plot type | Count rate plots | Images |
|---|---|---|
| Comparison with Poisson distribution Blue bars denote a histogram of data divided into 1 sec bins. Red curve is a Poisson curve with rate = median count rate of data. |
 |
 |
| Quadrant-wise count rates Data is divided into 100 sec bins |
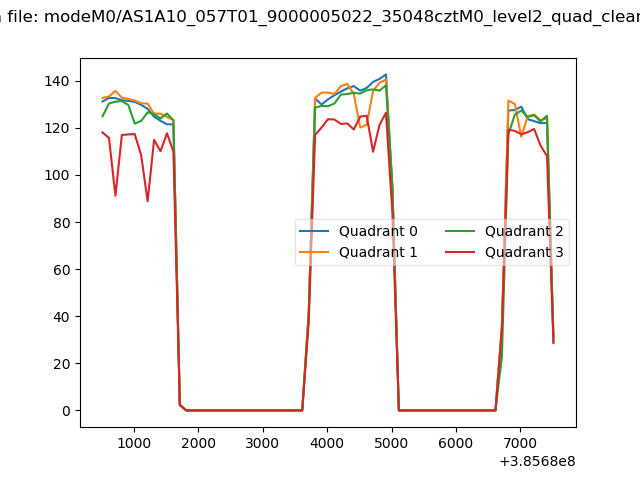 |
|
| Module-wise count rates for Quadrant A Data is divided into 100 sec bins |
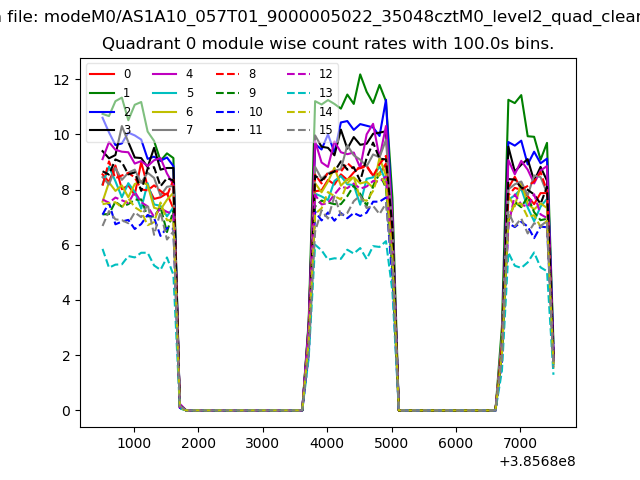 |
 |
| Module-wise count rates for Quadrant B Data is divided into 100 sec bins |
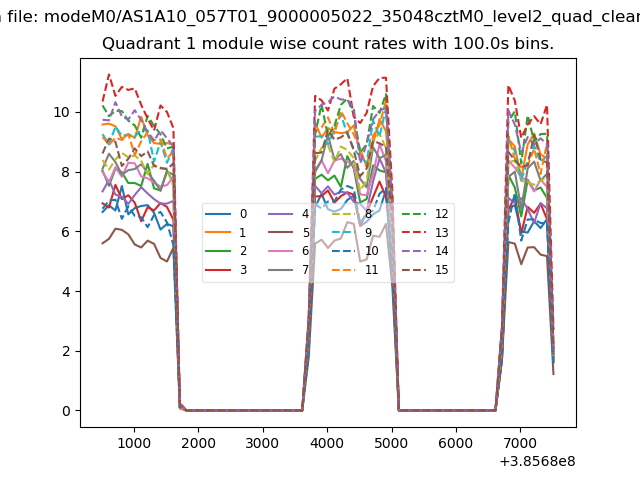 |
 |
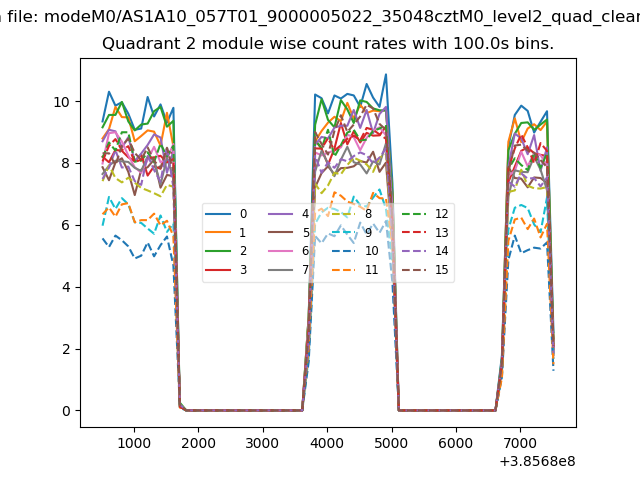
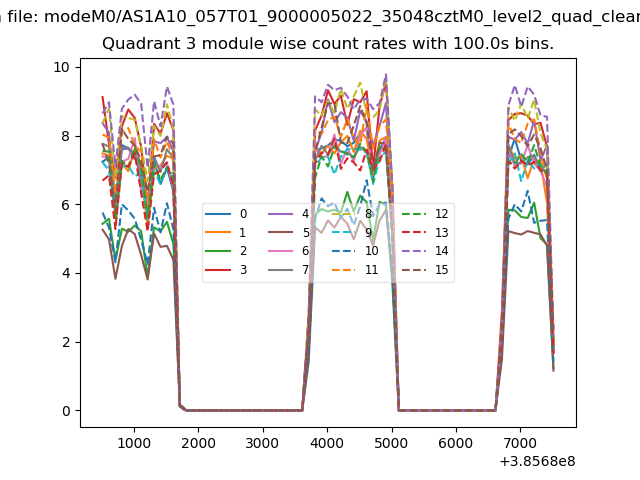
| Module-wise count rates for Quadrant C Data is divided into 100 sec bins |
 |
 |
| Module-wise count rates for Quadrant D Data is divided into 100 sec bins |
 |
 |
| Parameter | Plot |
|---|---|
| CZT HV Monitor | 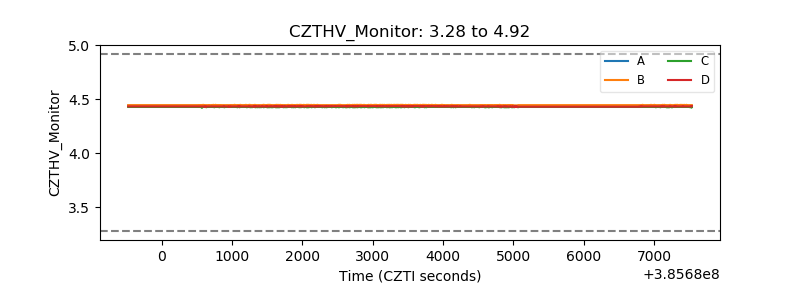 |
| D_VDD | 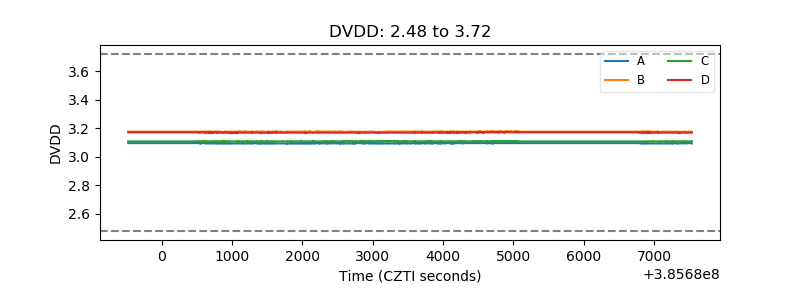 |
| Temperature 1 | 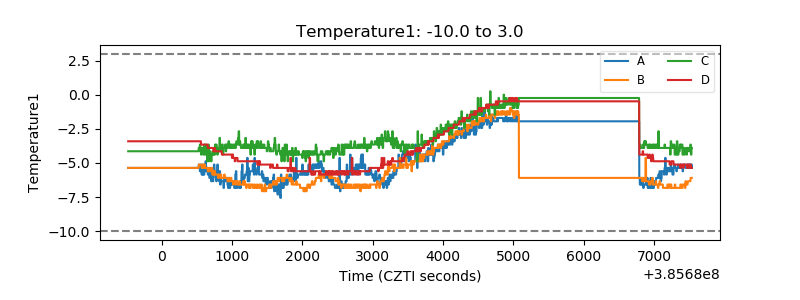 |
| Veto HV Monitor |  |
| Veto LLD | 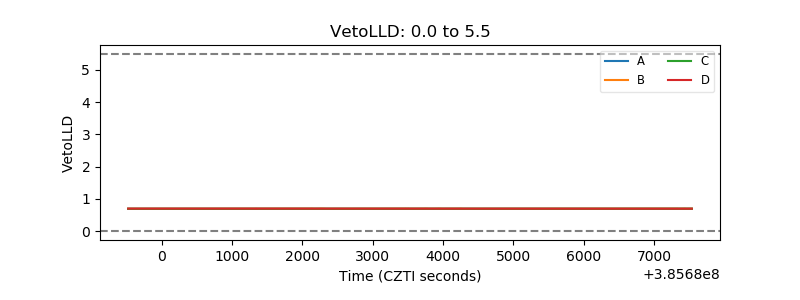 |
| Alpha Counter | 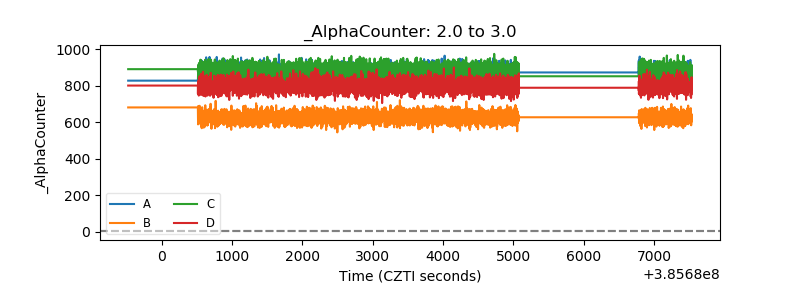 |
| _CPM_Rate | 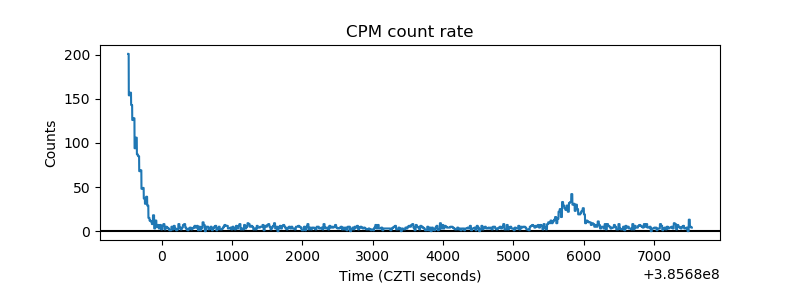 |
| CZT Counter | 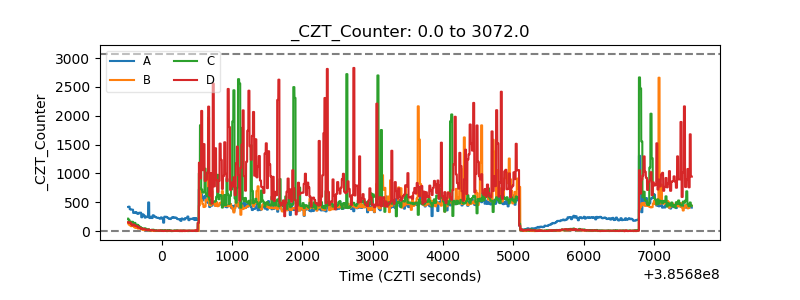 |
| +2.5 Volts monitor |  |
| +5 Volts monitor |  |
| _ROLL_ROT | 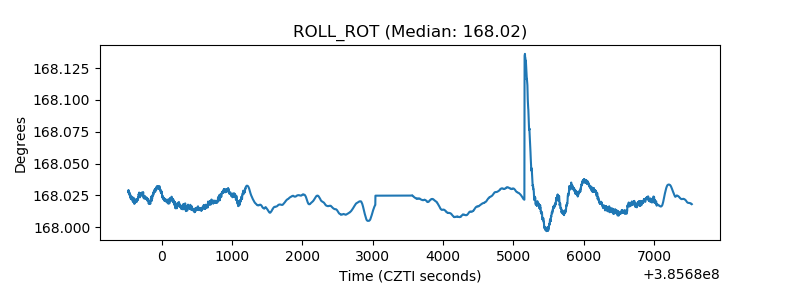 |
| _Roll_DEC | 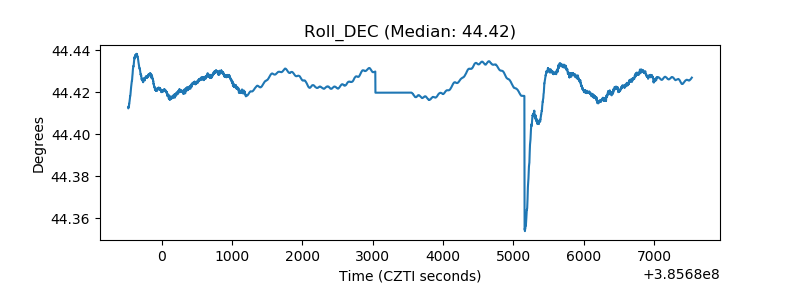 |
| _Roll_RA | 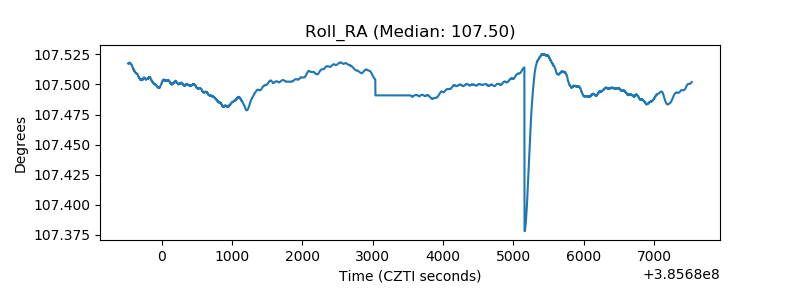 |
| Veto Counter | 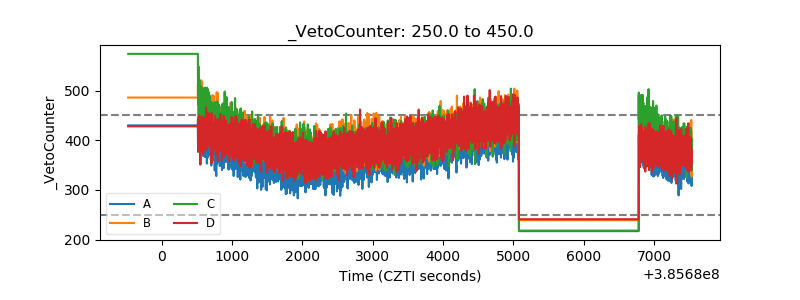 |