| Param | Original file | Final file |
|---|---|---|
| Filename | modeM0/AS1A10_057T01_9000005022_35053cztM0_level2.evt | modeM0/AS1A10_057T01_9000005022_35053cztM0_level2_quad_clean.evt |
| Size (bytes) | 1,298,511,360 | 203,221,440 |
| Size | 1.2 GB | 193.8 MB |
| Events in quadrant A | 7,424,815 | 1,311,467 |
| Events in quadrant B | 9,249,050 | 1,295,880 |
| Events in quadrant C | 7,851,510 | 1,293,871 |
| Events in quadrant D | 13,740,411 | 1,170,000 |
| Mode M0 | |||
|---|---|---|---|
| Quadrant | BADHDUFLAG | Total packets | Discarded packets |
| A | 0 | 32097 | 5 |
| B | 0 | 37515 | 4 |
| C | 0 | 32232 | 4 |
| D | 0 | 51925 | 4 |
| Mode M9 | |||
|---|---|---|---|
| Quadrant | BADHDUFLAG | Total packets | Discarded packets |
| A | 0 | 43 | 0 |
| B | 0 | 43 | 0 |
| C | 0 | 43 | 0 |
| D | 0 | 44 | 0 |
| Mode SS | |||
|---|---|---|---|
| Quadrant | BADHDUFLAG | Total packets | Discarded packets |
| A | 0 | 318 | 0 |
| B | 0 | 318 | 0 |
| C | 0 | 318 | 0 |
| D | 0 | 318 | 0 |
| Quadrant | Total seconds | Saturated seconds | Saturation percentage |
|---|---|---|---|
| A | 15714 | 33 | 0.210004% |
| B | 15714 | 565 | 3.595520% |
| C | 15714 | 26 | 0.165458% |
| D | 15714 | 1062 | 6.758305% |
Noise dominated data is calculated using 1-second bins in cleaned event files. If a bin has >2000 counts, and if more than 50% of those come from <1% of pixels, then it is considered to be noise-dominated and hence unusable.
| Quadrant | # 1 sec bins | Bins with >0 counts | Bins with >2000 counts | High rate bins dominated by noise | Noise dominated (total time) | Noise dominated (detector-on time) | Marked lightcurve |
|---|---|---|---|---|---|---|---|
| A | 19892 | 15717 | 9 | 9 | 0.05% | 0.06% | 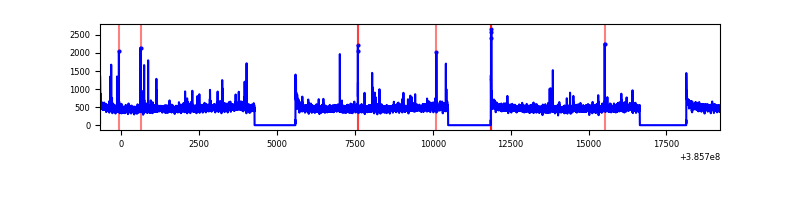 |
| B | 19892 | 15717 | 321 | 321 | 1.61% | 2.04% |  |
| C | 19892 | 15717 | 13 | 13 | 0.07% | 0.08% | 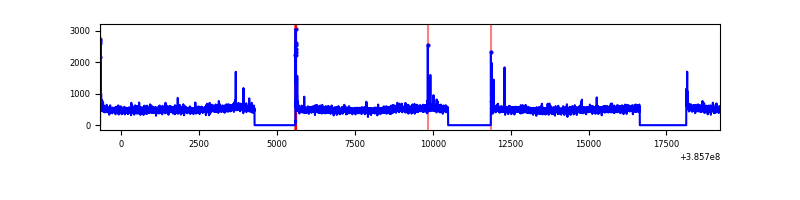 |
| D | 19892 | 15717 | 957 | 957 | 4.81% | 6.09% |  |
Top three noisy pixels from each quadrant. If the there are fewer than three noisy pixels in the level2.evt file, extra rows are filled as -1
| Pixel properties | Quadrant properties | ||||||
|---|---|---|---|---|---|---|---|
| Quadrant | DetID | PixID | Counts | Sigma | Mean | Median | Sigma |
| A | 10 | 83 | 182199 | 489.07 | 1837 | 1801 | 368.9 |
| A | 9 | 143 | 57773 | 151.74 | 1837 | 1801 | 368.9 |
| A | 7 | 16 | 32284 | 82.64 | 1837 | 1801 | 368.9 |
| B | 5 | 172 | 1288702 | 3784.6 | 1797 | 1750 | 340.0 |
| B | 5 | 200 | 506166 | 1483.36 | 1797 | 1750 | 340.0 |
| B | 4 | 232 | 172438 | 501.95 | 1797 | 1750 | 340.0 |
| C | 15 | 214 | 646935 | 1561.6 | 1787 | 1800 | 413.1 |
| C | 14 | 67 | 101173 | 240.54 | 1787 | 1800 | 413.1 |
| C | 0 | 10 | 81009 | 191.73 | 1787 | 1800 | 413.1 |
| D | 8 | 195 | 3138401 | 7538.37 | 1724 | 1673 | 416.1 |
| D | 13 | 249 | 1451042 | 3483.21 | 1724 | 1673 | 416.1 |
| D | 5 | 223 | 719085 | 1724.13 | 1724 | 1673 | 416.1 |
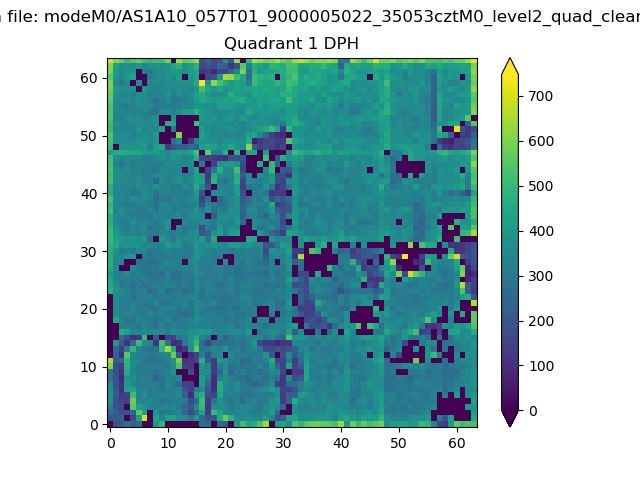
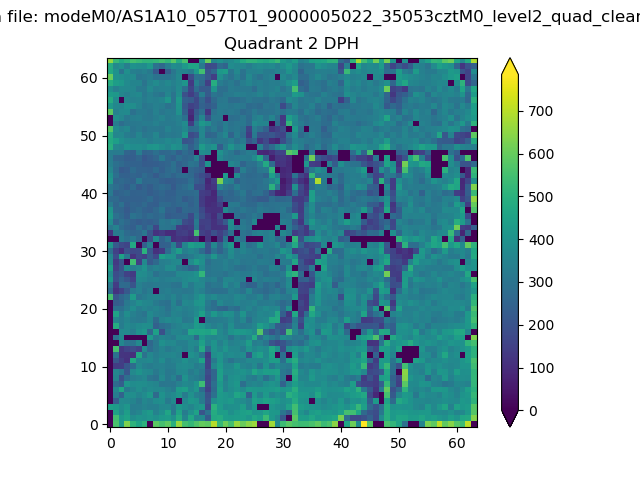
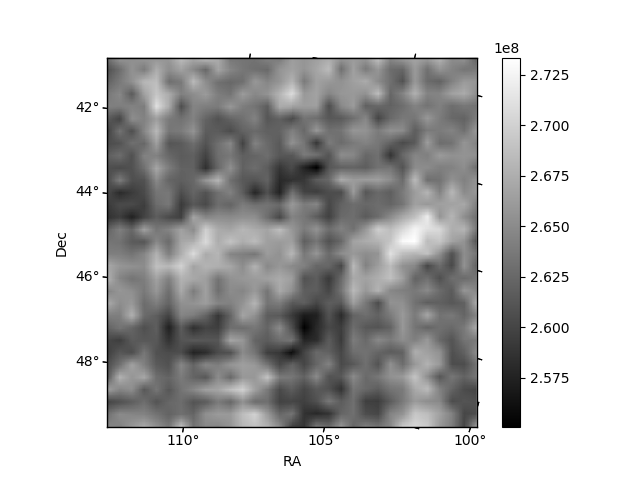
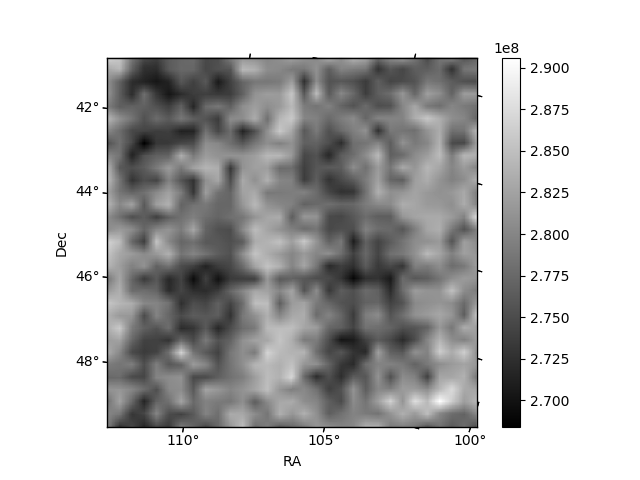
Histogram calculated using DETX and DETY for each event in the final _common_clean file
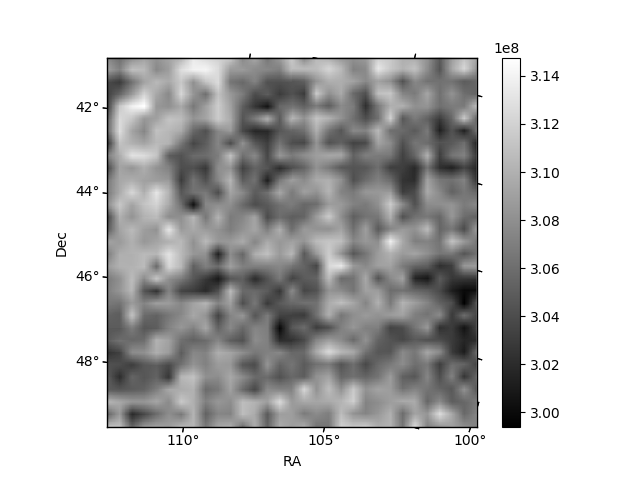
| Quadrant A |  |
 |
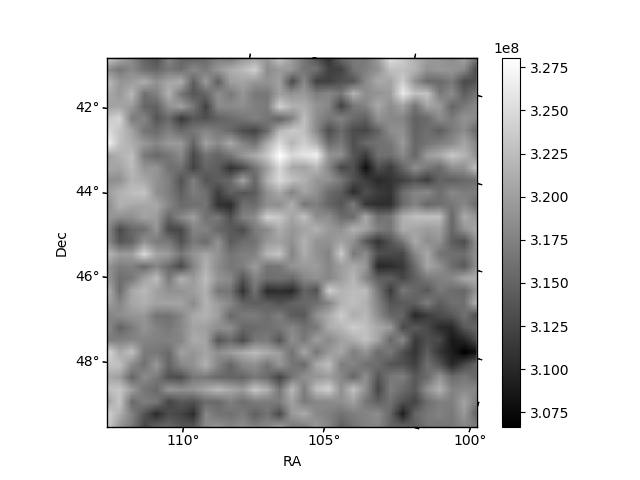
Quadrant B |
|---|---|---|---|
| Quadrant D | 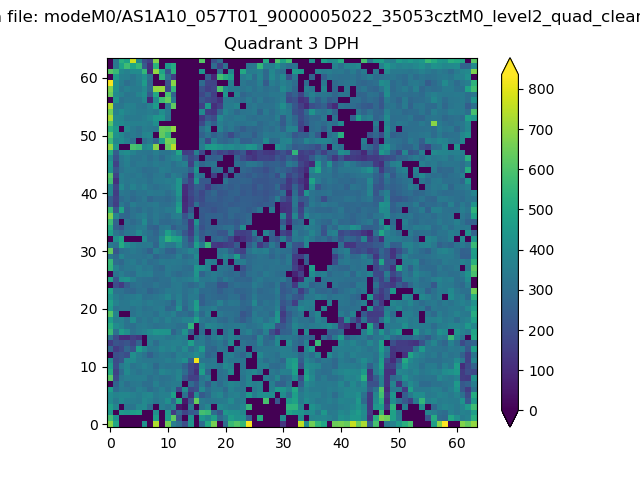 |
 |
Quadrant C |
| Plot type | Count rate plots | Images |
|---|---|---|
| Comparison with Poisson distribution Blue bars denote a histogram of data divided into 1 sec bins. Red curve is a Poisson curve with rate = median count rate of data. |
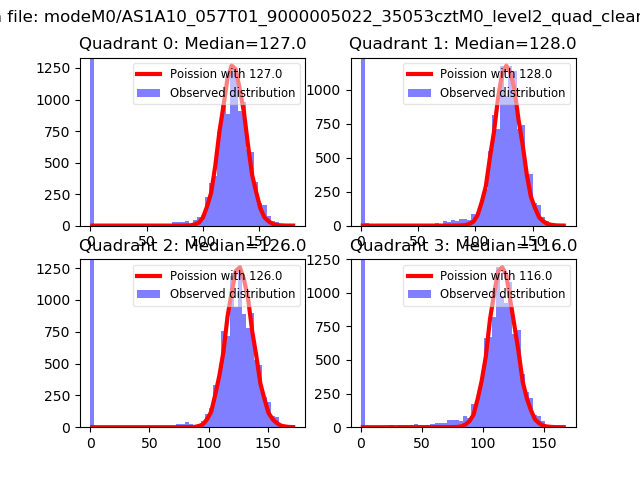 |
 |
| Quadrant-wise count rates Data is divided into 100 sec bins |
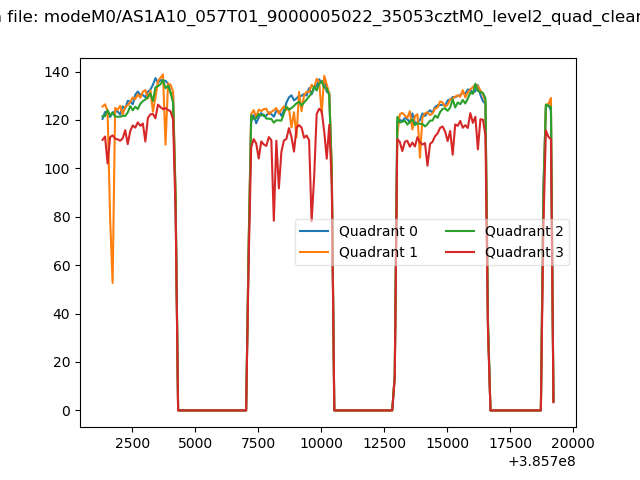 |
|
| Module-wise count rates for Quadrant A Data is divided into 100 sec bins |
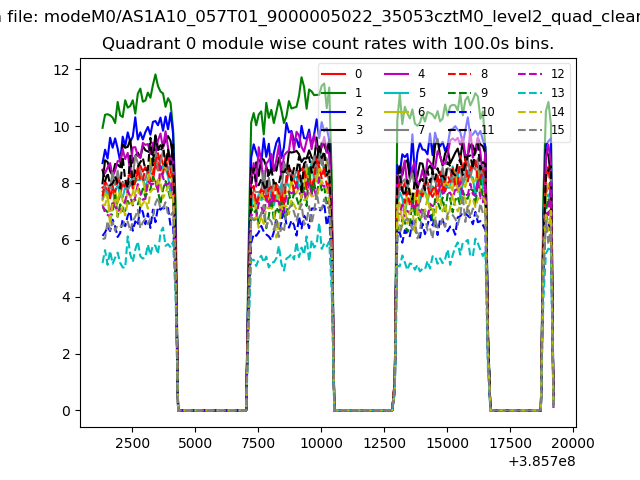 |
 |
| Module-wise count rates for Quadrant B Data is divided into 100 sec bins |
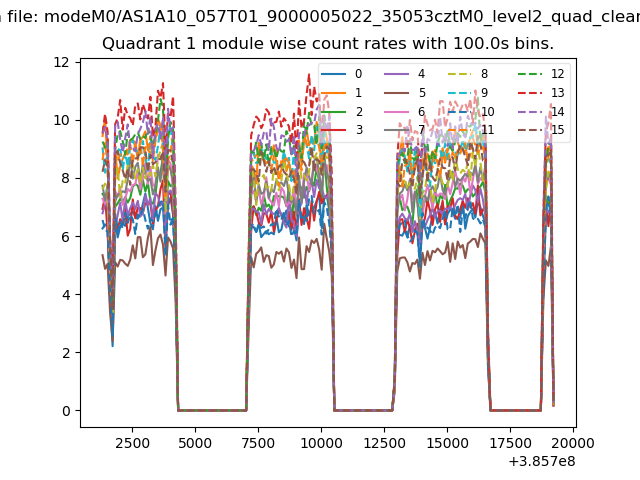 |
 |
| Module-wise count rates for Quadrant C Data is divided into 100 sec bins |
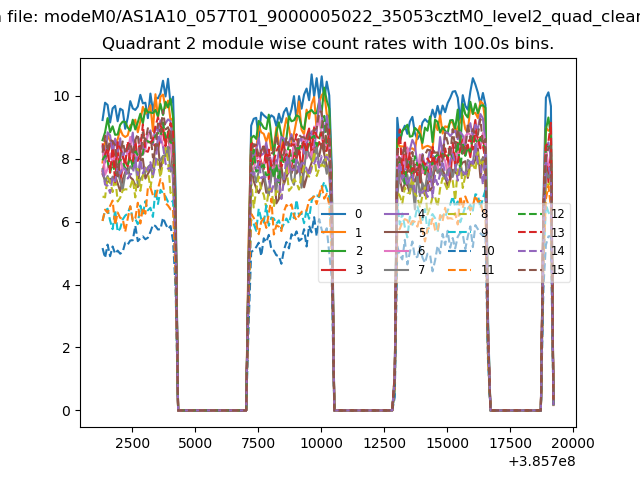 |
 |
| Module-wise count rates for Quadrant D Data is divided into 100 sec bins |
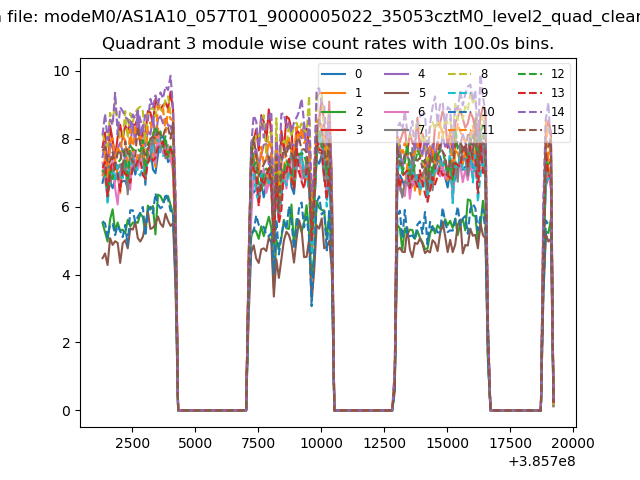 |
 |
| Parameter | Plot |
|---|---|
| CZT HV Monitor | 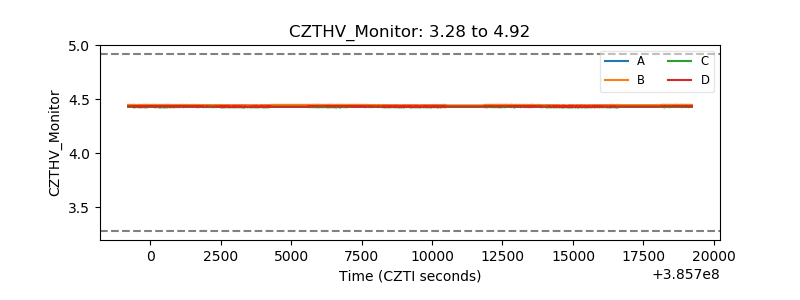 |
| D_VDD | 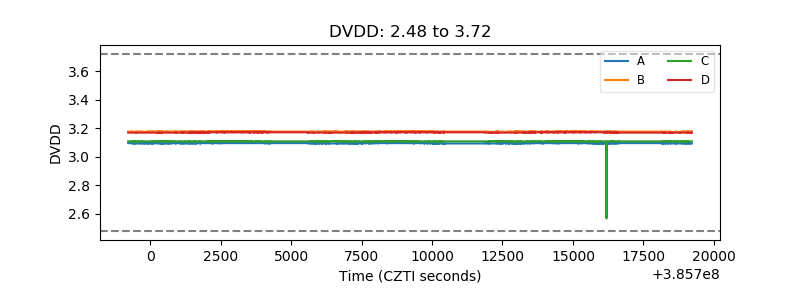 |
| Temperature 1 | 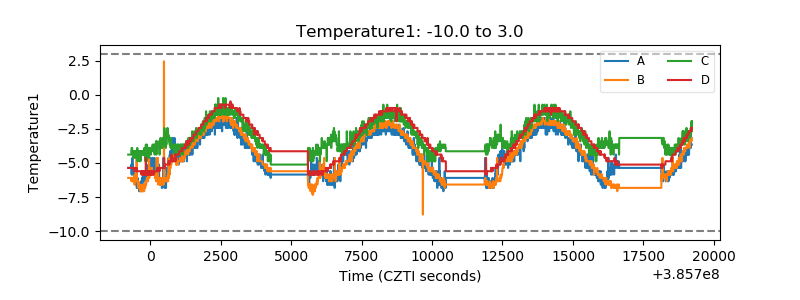 |
| Veto HV Monitor | 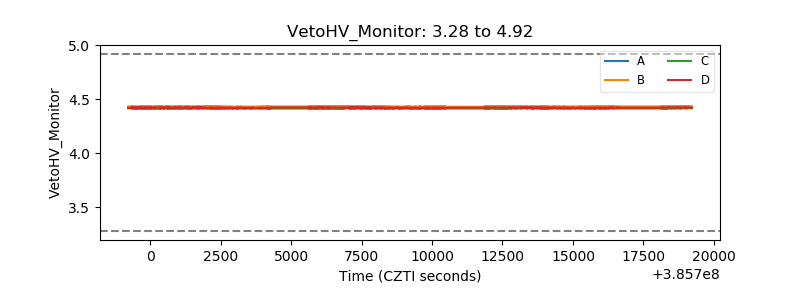 |
| Veto LLD | 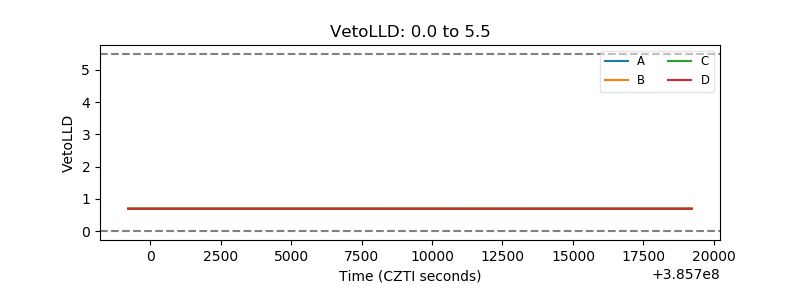 |
| Alpha Counter | 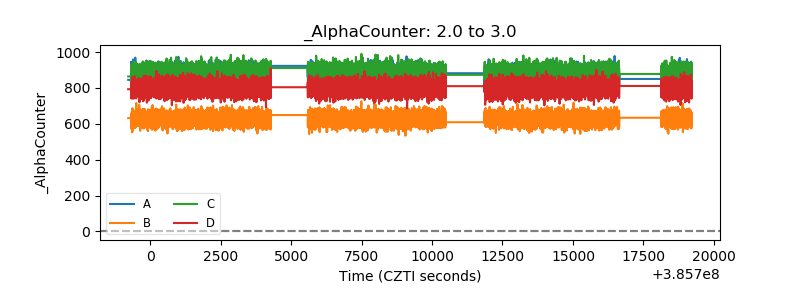 |
| _CPM_Rate | 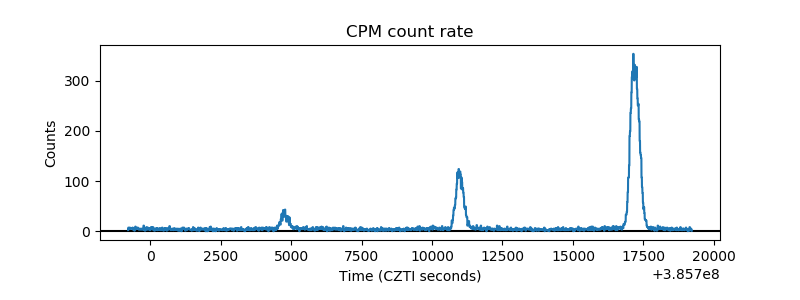 |
| CZT Counter | 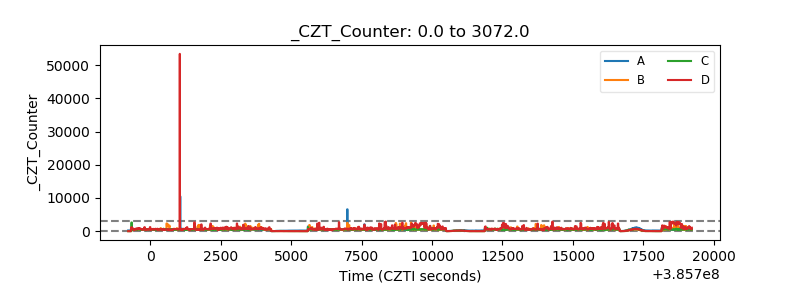 |
| +2.5 Volts monitor |  |
| +5 Volts monitor |  |
| _ROLL_ROT | 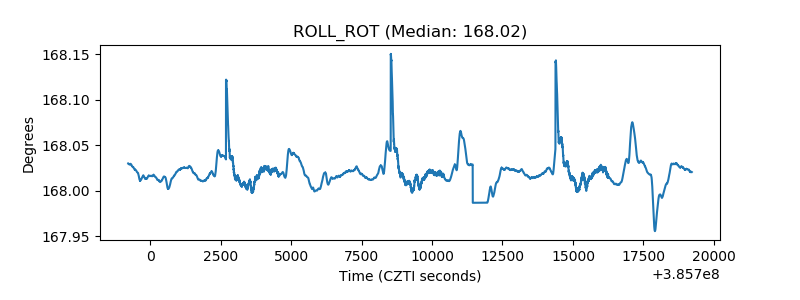 |
| _Roll_DEC | 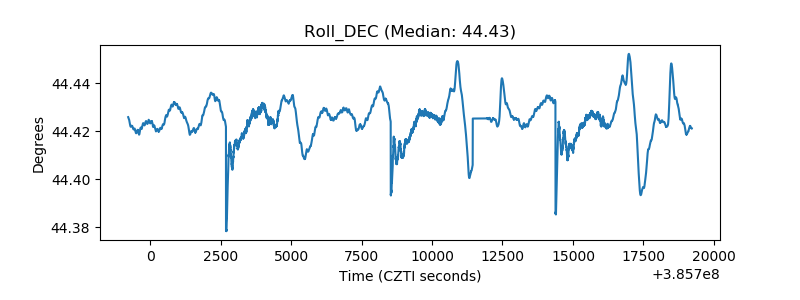 |
| _Roll_RA | 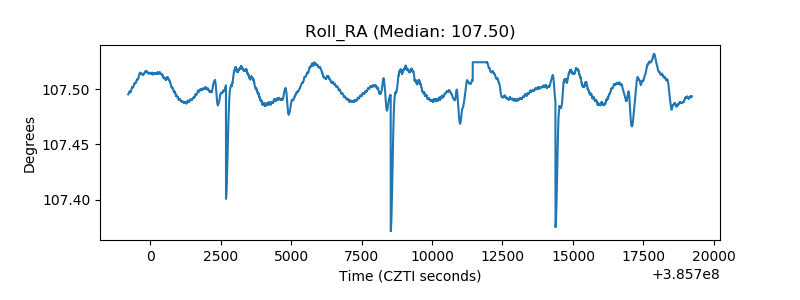 |
| Veto Counter | 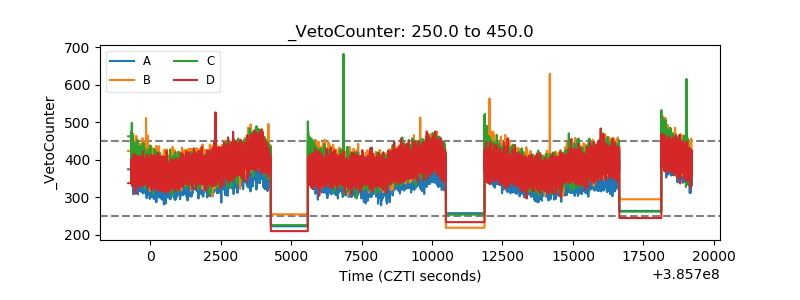 |