| Param | Original file | Final file |
|---|---|---|
| Filename | modeM0/AS1A10_057T01_9000005022_35056cztM0_level2.evt | modeM0/AS1A10_057T01_9000005022_35056cztM0_level2_quad_clean.evt |
| Size (bytes) | 510,065,280 | 97,496,640 |
| Size | 486.4 MB | 93.0 MB |
| Events in quadrant A | 2,845,492 | 667,975 |
| Events in quadrant B | 4,001,916 | 649,233 |
| Events in quadrant C | 2,931,227 | 647,179 |
| Events in quadrant D | 5,285,123 | 592,188 |
| Mode M0 | |||
|---|---|---|---|
| Quadrant | BADHDUFLAG | Total packets | Discarded packets |
| A | 0 | 12099 | 3 |
| B | 0 | 15563 | 2 |
| C | 0 | 11926 | 2 |
| D | 0 | 19739 | 2 |
| Mode M9 | |||
|---|---|---|---|
| Quadrant | BADHDUFLAG | Total packets | Discarded packets |
| A | 0 | 26 | 0 |
| B | 0 | 26 | 0 |
| C | 0 | 26 | 0 |
| D | 0 | 27 | 0 |
| Mode SS | |||
|---|---|---|---|
| Quadrant | BADHDUFLAG | Total packets | Discarded packets |
| A | 0 | 116 | 0 |
| B | 0 | 116 | 0 |
| C | 0 | 116 | 0 |
| D | 0 | 116 | 0 |
| Quadrant | Total seconds | Saturated seconds | Saturation percentage |
|---|---|---|---|
| A | 5658 | 9 | 0.159067% |
| B | 5658 | 413 | 7.299399% |
| C | 5658 | 15 | 0.265111% |
| D | 5658 | 293 | 5.178508% |
Noise dominated data is calculated using 1-second bins in cleaned event files. If a bin has >2000 counts, and if more than 50% of those come from <1% of pixels, then it is considered to be noise-dominated and hence unusable.
| Quadrant | # 1 sec bins | Bins with >0 counts | Bins with >2000 counts | High rate bins dominated by noise | Noise dominated (total time) | Noise dominated (detector-on time) | Marked lightcurve |
|---|---|---|---|---|---|---|---|
| A | 7391 | 5659 | 0 | 0 | 0.00% | 0.00% | 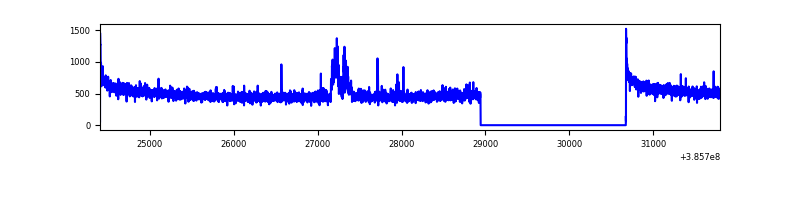 |
| B | 7391 | 5659 | 288 | 288 | 3.90% | 5.09% | 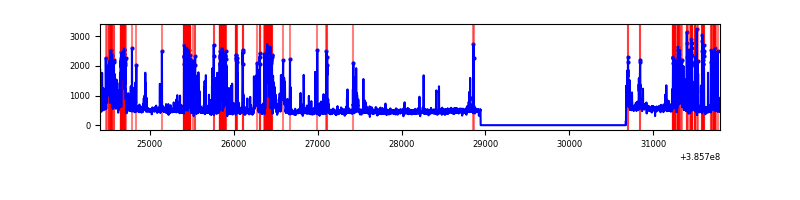 |
| C | 7391 | 5659 | 12 | 12 | 0.16% | 0.21% | 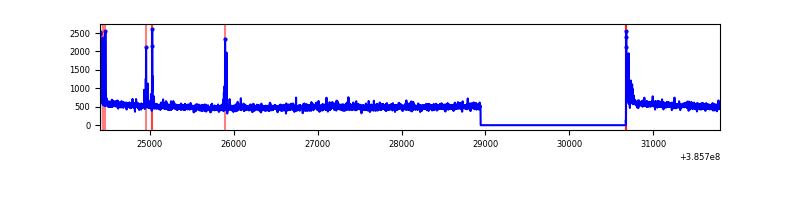 |
| D | 7391 | 5659 | 275 | 275 | 3.72% | 4.86% | 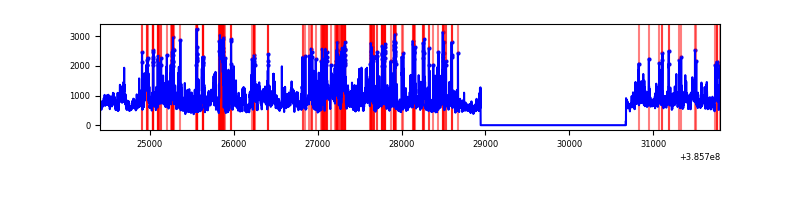 |
Top three noisy pixels from each quadrant. If the there are fewer than three noisy pixels in the level2.evt file, extra rows are filled as -1
| Pixel properties | Quadrant properties | ||||||
|---|---|---|---|---|---|---|---|
| Quadrant | DetID | PixID | Counts | Sigma | Mean | Median | Sigma |
| A | 10 | 83 | 82034 | 587.25 | 690 | 677 | 138.5 |
| A | 15 | 174 | 71531 | 511.44 | 690 | 677 | 138.5 |
| A | 9 | 143 | 15580 | 107.57 | 690 | 677 | 138.5 |
| B | 5 | 172 | 1195500 | 9448.18 | 662 | 644 | 126.5 |
| B | 0 | 190 | 134766 | 1060.55 | 662 | 644 | 126.5 |
| B | 4 | 232 | 40654 | 316.37 | 662 | 644 | 126.5 |
| C | 15 | 214 | 237449 | 1547.65 | 661 | 667 | 153.0 |
| C | 0 | 10 | 51868 | 334.66 | 661 | 667 | 153.0 |
| C | 14 | 67 | 28919 | 184.66 | 661 | 667 | 153.0 |
| D | 8 | 195 | 1266049 | 7957.0 | 654 | 636 | 159.0 |
| D | 13 | 249 | 393645 | 2471.27 | 654 | 636 | 159.0 |
| D | 1 | 47 | 357715 | 2245.33 | 654 | 636 | 159.0 |
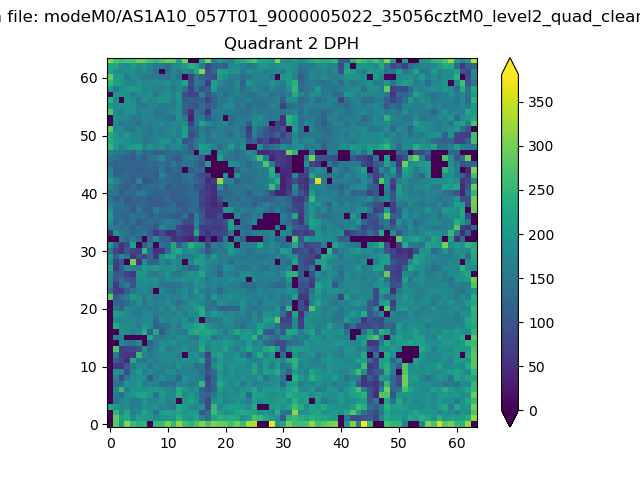
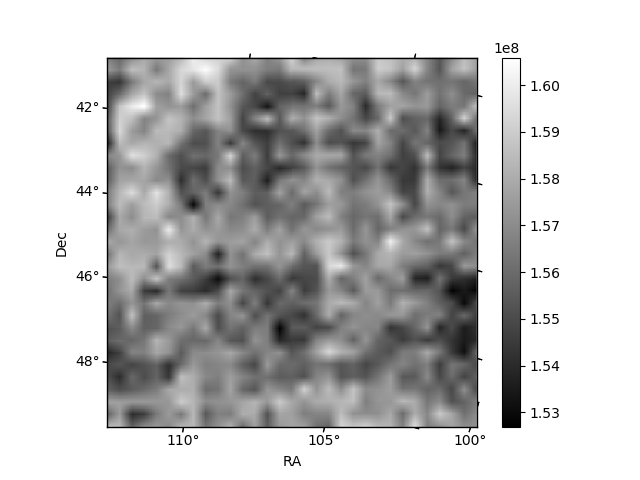
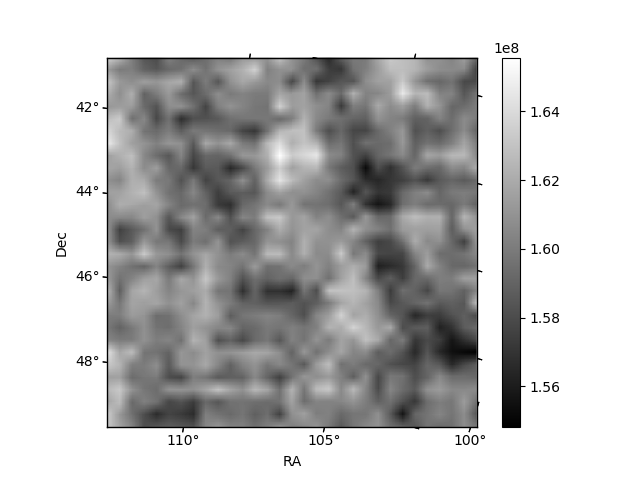
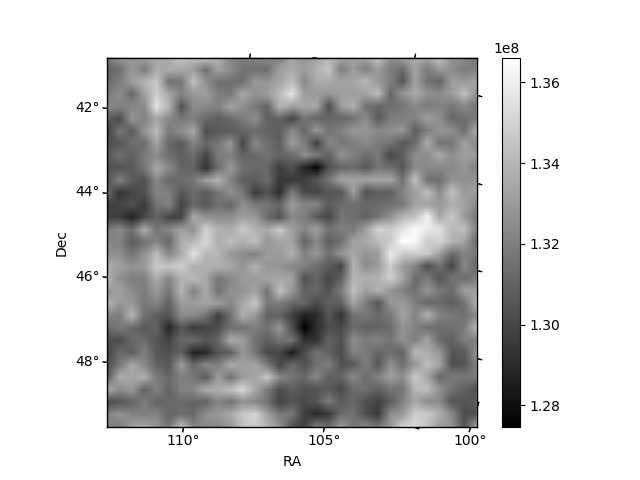
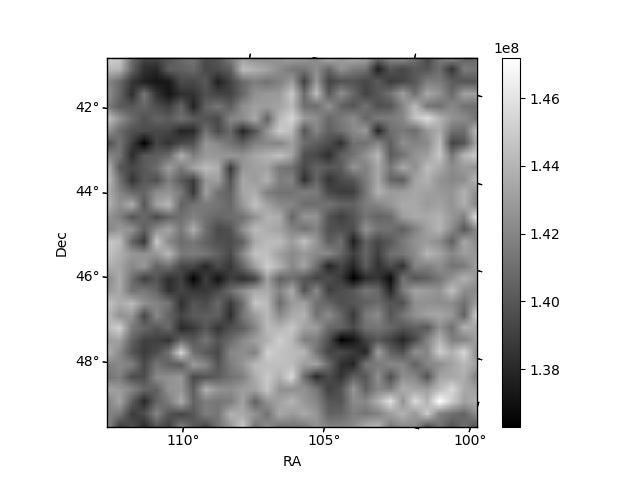
Histogram calculated using DETX and DETY for each event in the final _common_clean file
| Quadrant A |  |
 |
Quadrant B |
|---|---|---|---|
| Quadrant D |  |
 |
Quadrant C |
| Plot type | Count rate plots | Images |
|---|---|---|
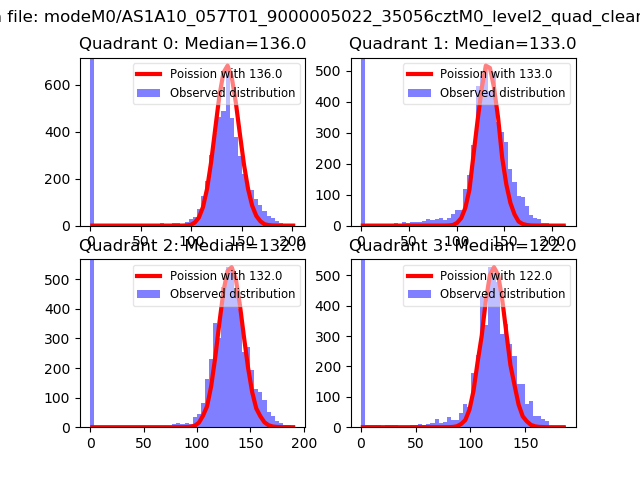
| Comparison with Poisson distribution Blue bars denote a histogram of data divided into 1 sec bins. Red curve is a Poisson curve with rate = median count rate of data. |
 |
 |
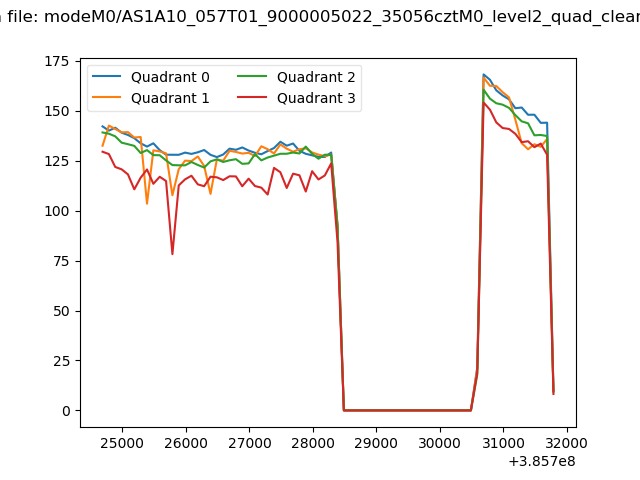
| Quadrant-wise count rates Data is divided into 100 sec bins |
 |
|
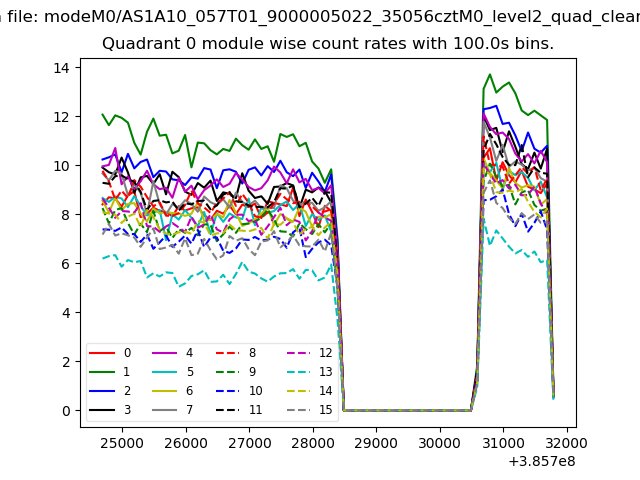
| Module-wise count rates for Quadrant A Data is divided into 100 sec bins |
 |
 |
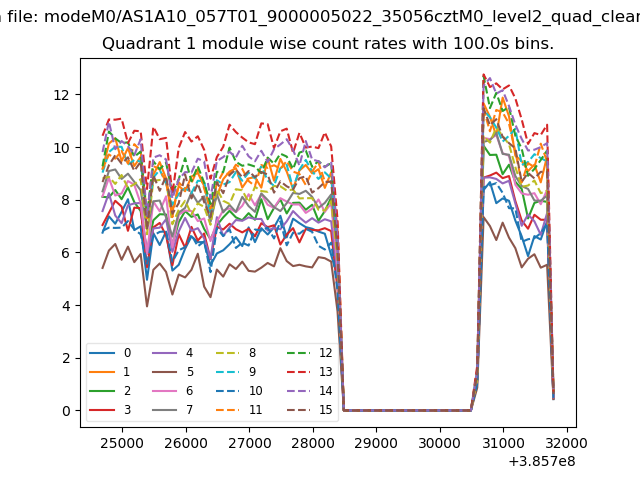
| Module-wise count rates for Quadrant B Data is divided into 100 sec bins |
 |
 |
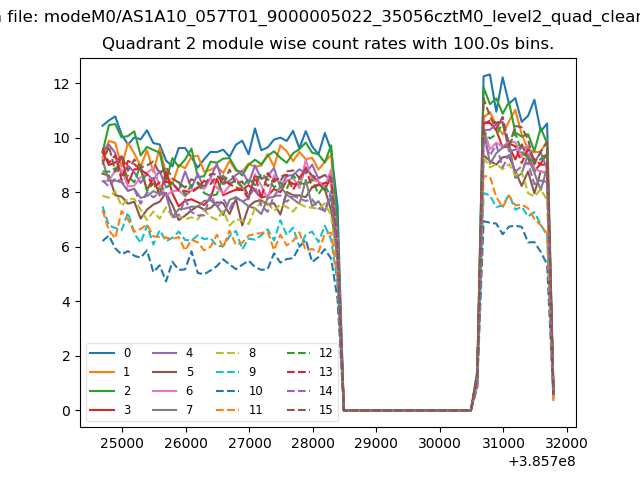
| Module-wise count rates for Quadrant C Data is divided into 100 sec bins |
 |
 |
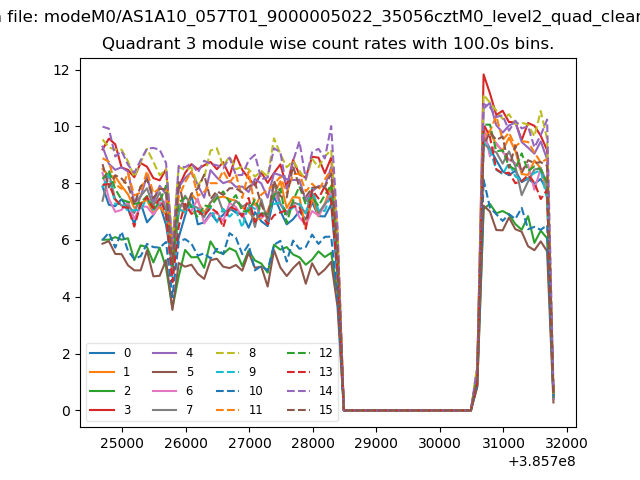
| Module-wise count rates for Quadrant D Data is divided into 100 sec bins |
 |
 |
| Parameter | Plot |
|---|---|
| CZT HV Monitor | 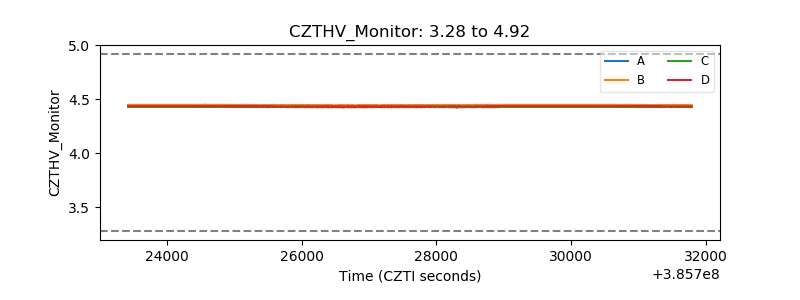 |
| D_VDD | 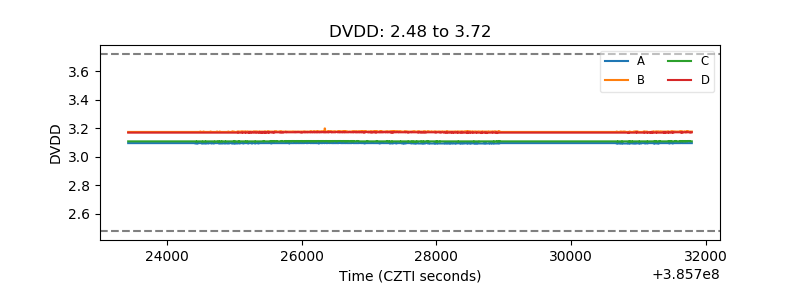 |
| Temperature 1 | 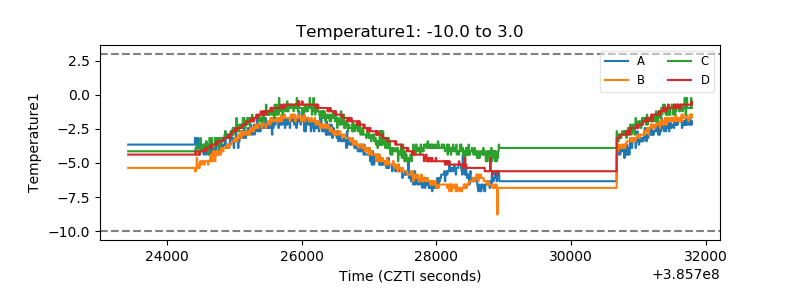 |
| Veto HV Monitor | 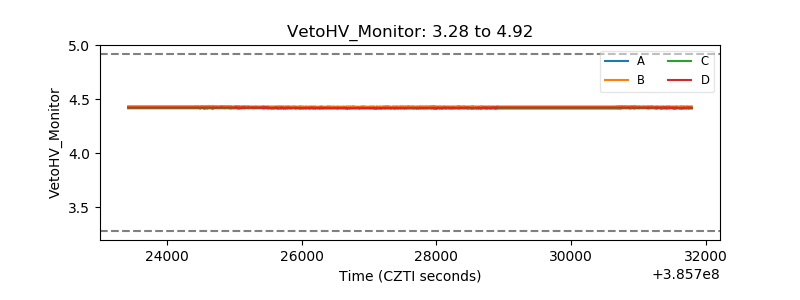 |
| Veto LLD | 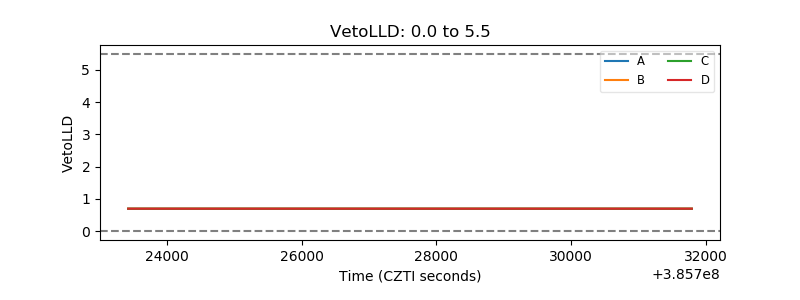 |
| Alpha Counter | 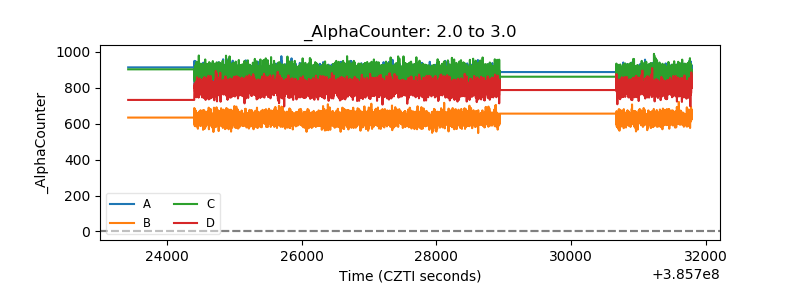 |
| _CPM_Rate | 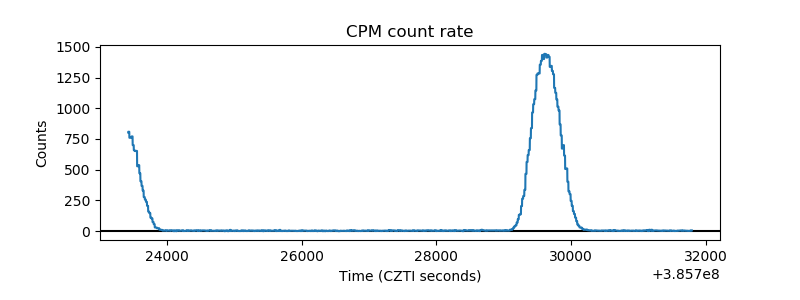 |
| CZT Counter | 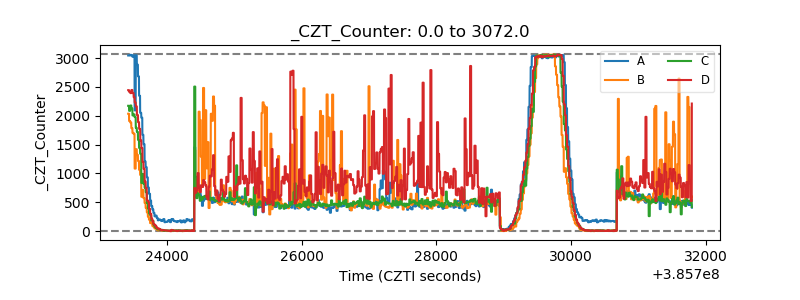 |
| +2.5 Volts monitor |  |
| +5 Volts monitor | 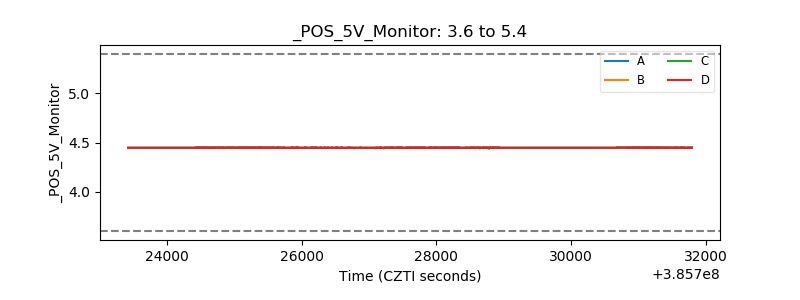 |
| _ROLL_ROT | 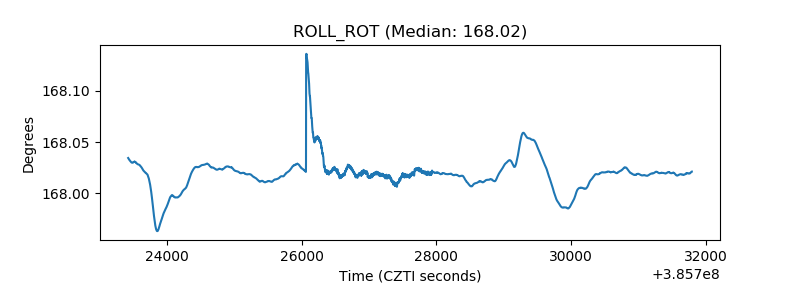 |
| _Roll_DEC | 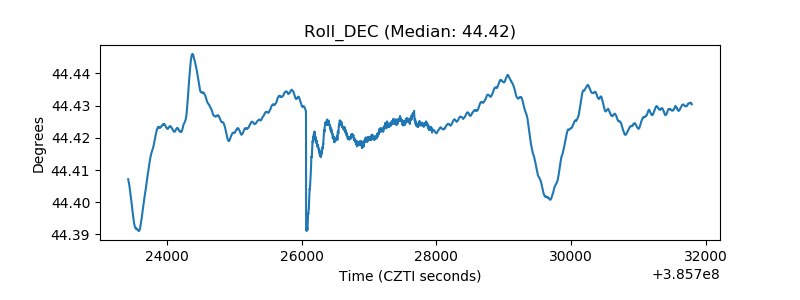 |
| _Roll_RA | 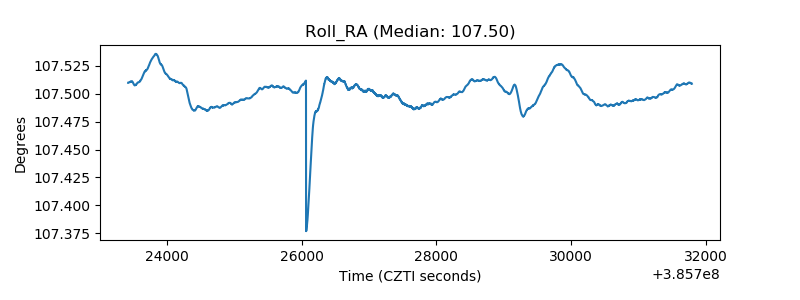 |
| Veto Counter | 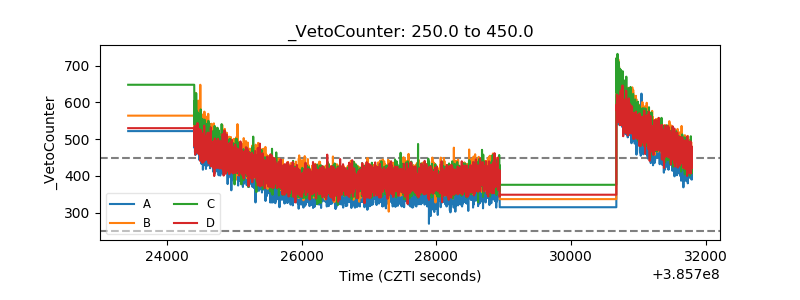 |