| Param | Original file | Final file |
|---|---|---|
| Filename | modeM0/AS1A10_057T01_9000005022_35059cztM0_level2.evt | modeM0/AS1A10_057T01_9000005022_35059cztM0_level2_quad_clean.evt |
| Size (bytes) | 462,974,400 | 84,225,600 |
| Size | 441.5 MB | 80.3 MB |
| Events in quadrant A | 2,637,232 | 573,352 |
| Events in quadrant B | 3,215,158 | 564,326 |
| Events in quadrant C | 2,834,164 | 555,720 |
| Events in quadrant D | 4,989,964 | 500,693 |
| Mode M0 | |||
|---|---|---|---|
| Quadrant | BADHDUFLAG | Total packets | Discarded packets |
| A | 0 | 10941 | 3 |
| B | 0 | 12666 | 2 |
| C | 0 | 11242 | 2 |
| D | 0 | 18455 | 2 |
| Mode M9 | |||
|---|---|---|---|
| Quadrant | BADHDUFLAG | Total packets | Discarded packets |
| A | 0 | 22 | 0 |
| B | 0 | 22 | 0 |
| C | 0 | 22 | 0 |
| D | 0 | 23 | 0 |
| Mode SS | |||
|---|---|---|---|
| Quadrant | BADHDUFLAG | Total packets | Discarded packets |
| A | 0 | 104 | 0 |
| B | 0 | 104 | 0 |
| C | 0 | 104 | 0 |
| D | 0 | 104 | 0 |
| Quadrant | Total seconds | Saturated seconds | Saturation percentage |
|---|---|---|---|
| A | 5081 | 16 | 0.314899% |
| B | 5081 | 198 | 3.896871% |
| C | 5081 | 40 | 0.787247% |
| D | 5081 | 384 | 7.557567% |
Noise dominated data is calculated using 1-second bins in cleaned event files. If a bin has >2000 counts, and if more than 50% of those come from <1% of pixels, then it is considered to be noise-dominated and hence unusable.
| Quadrant | # 1 sec bins | Bins with >0 counts | Bins with >2000 counts | High rate bins dominated by noise | Noise dominated (total time) | Noise dominated (detector-on time) | Marked lightcurve |
|---|---|---|---|---|---|---|---|
| A | 7174 | 5082 | 9 | 9 | 0.13% | 0.18% | 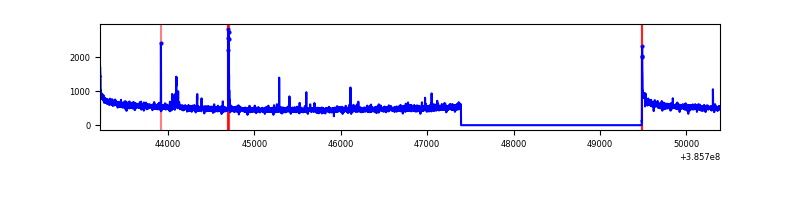 |
| B | 7174 | 5082 | 88 | 88 | 1.23% | 1.73% | 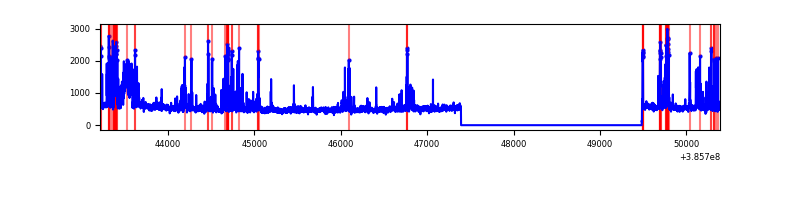 |
| C | 7174 | 5082 | 40 | 40 | 0.56% | 0.79% | 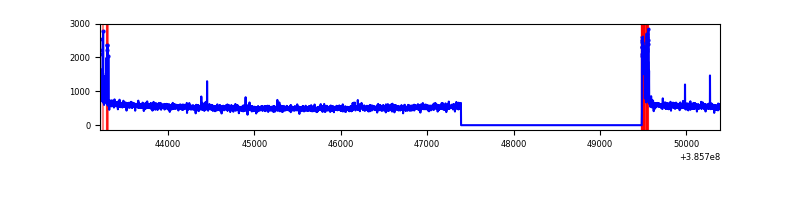 |
| D | 7174 | 5082 | 388 | 388 | 5.41% | 7.63% | 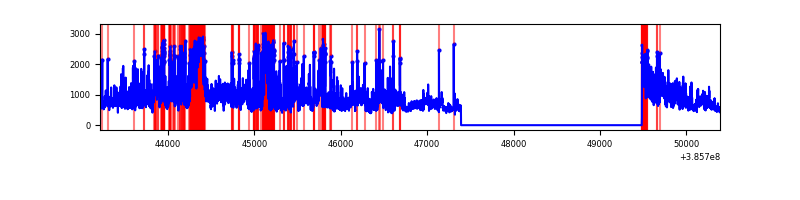 |
Top three noisy pixels from each quadrant. If the there are fewer than three noisy pixels in the level2.evt file, extra rows are filled as -1
| Pixel properties | Quadrant properties | ||||||
|---|---|---|---|---|---|---|---|
| Quadrant | DetID | PixID | Counts | Sigma | Mean | Median | Sigma |
| A | 10 | 83 | 81264 | 627.96 | 646 | 635 | 128.4 |
| A | 9 | 143 | 19656 | 148.14 | 646 | 635 | 128.4 |
| A | 15 | 174 | 18841 | 141.79 | 646 | 635 | 128.4 |
| B | 5 | 172 | 409604 | 3477.87 | 631 | 615 | 117.6 |
| B | 0 | 190 | 186302 | 1579.0 | 631 | 615 | 117.6 |
| B | 4 | 232 | 69043 | 581.88 | 631 | 615 | 117.6 |
| C | 15 | 214 | 212791 | 1472.99 | 629 | 634 | 144.0 |
| C | 0 | 10 | 135164 | 934.03 | 629 | 634 | 144.0 |
| C | 14 | 67 | 20280 | 136.4 | 629 | 634 | 144.0 |
| D | 8 | 195 | 1238402 | 8389.76 | 612 | 596 | 147.5 |
| D | 10 | 118 | 510511 | 3456.17 | 612 | 596 | 147.5 |
| D | 12 | 233 | 292862 | 1980.96 | 612 | 596 | 147.5 |
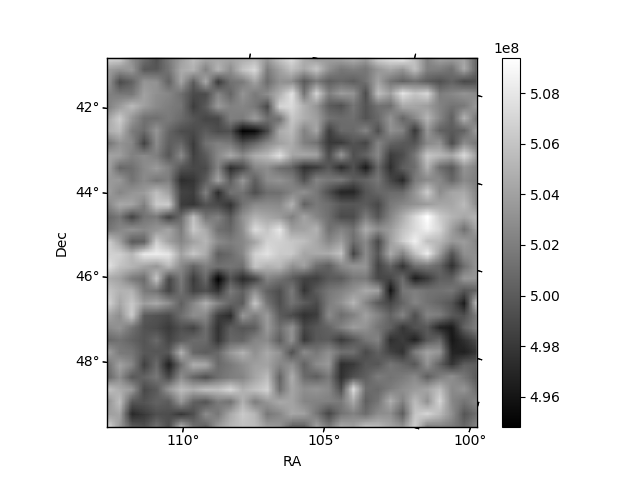
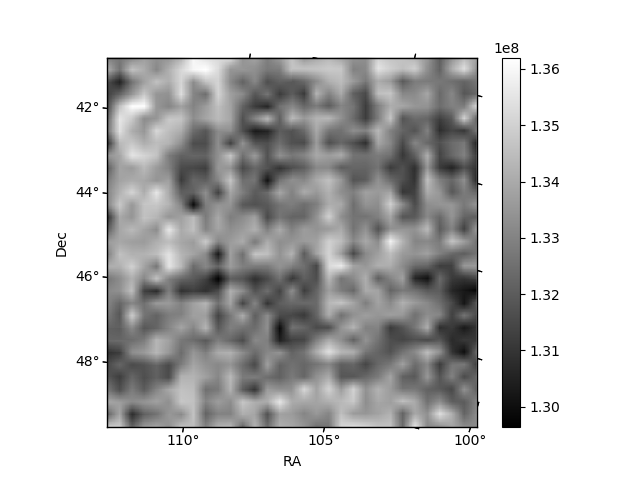
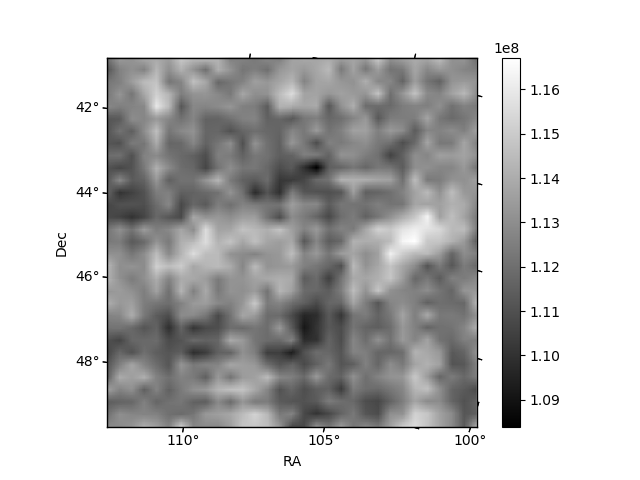
Histogram calculated using DETX and DETY for each event in the final _common_clean file
| Quadrant A | 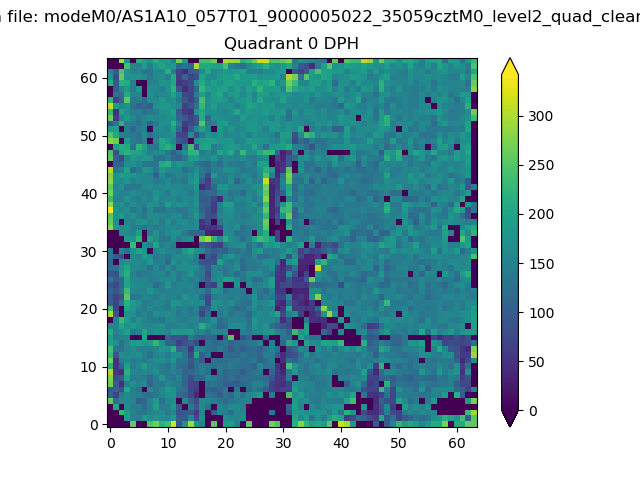 |
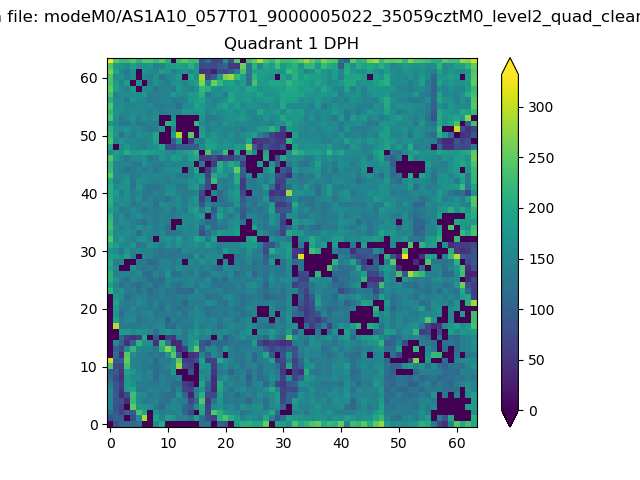 |
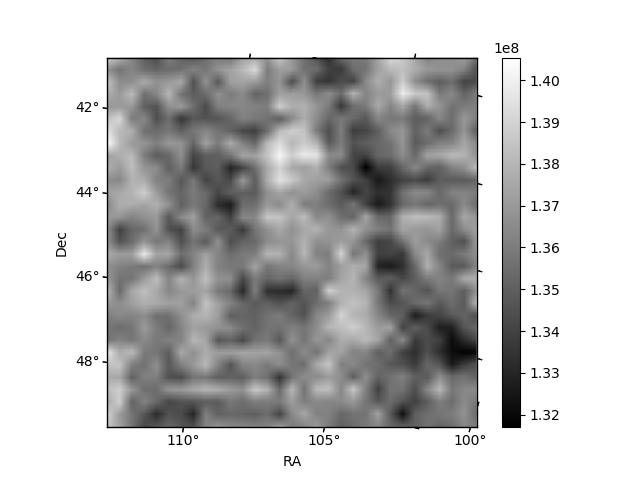
Quadrant B |
|---|---|---|---|
| Quadrant D | 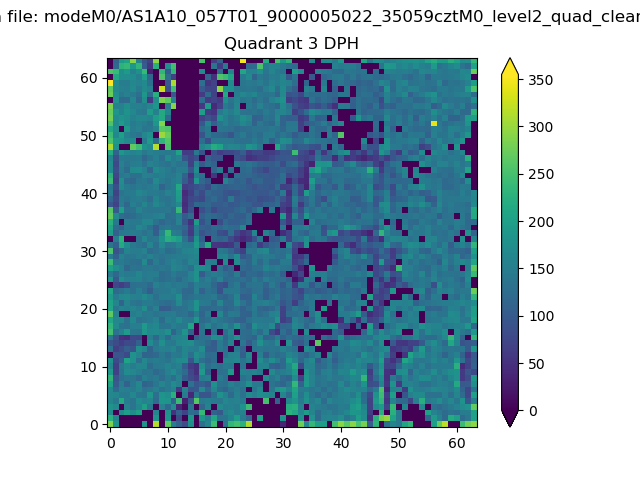 |
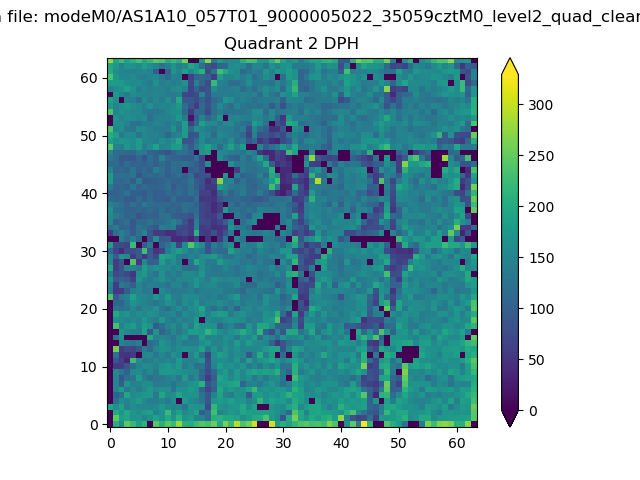 |
Quadrant C |
| Plot type | Count rate plots | Images |
|---|---|---|
| Comparison with Poisson distribution Blue bars denote a histogram of data divided into 1 sec bins. Red curve is a Poisson curve with rate = median count rate of data. |
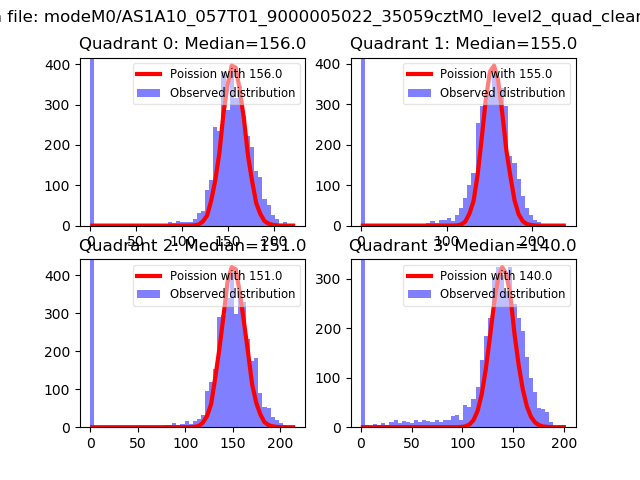 |
 |
| Quadrant-wise count rates Data is divided into 100 sec bins |
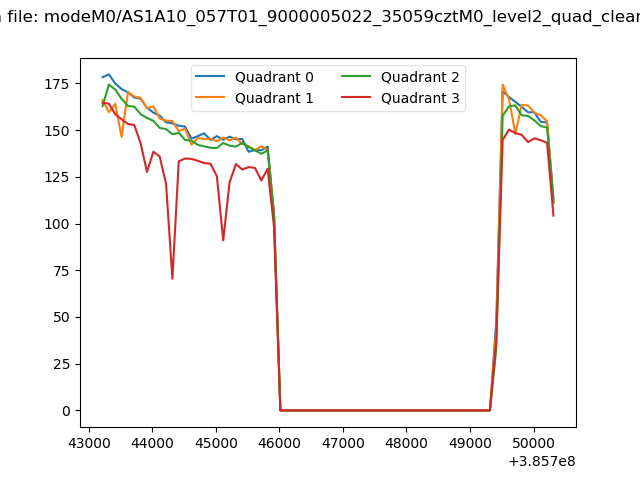 |
|
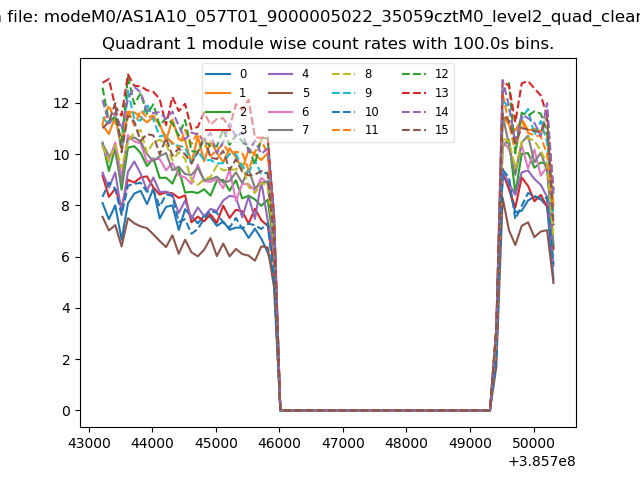
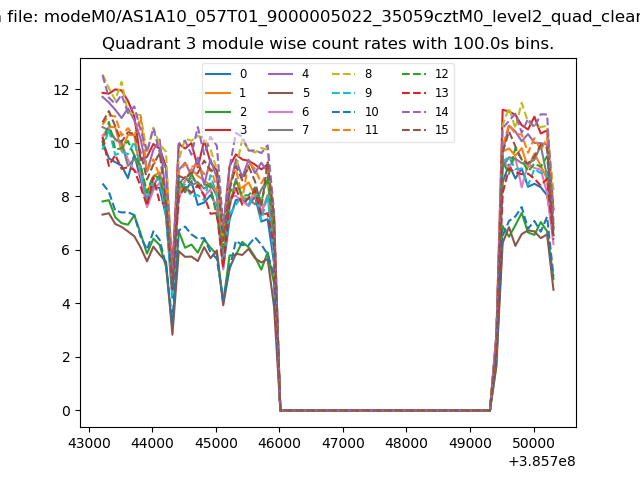
| Module-wise count rates for Quadrant A Data is divided into 100 sec bins |
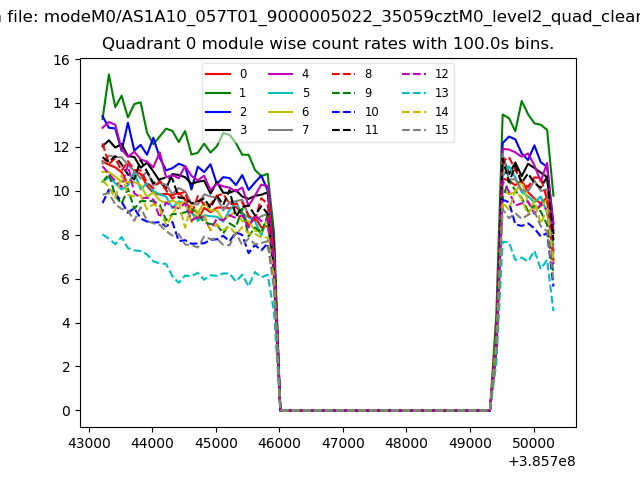 |
 |
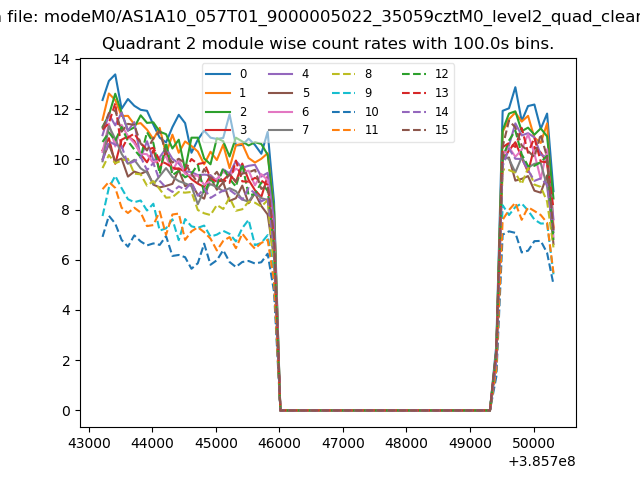
| Module-wise count rates for Quadrant B Data is divided into 100 sec bins |
 |
 |
| Module-wise count rates for Quadrant C Data is divided into 100 sec bins |
 |
 |
| Module-wise count rates for Quadrant D Data is divided into 100 sec bins |
 |
 |
| Parameter | Plot |
|---|---|
| CZT HV Monitor | 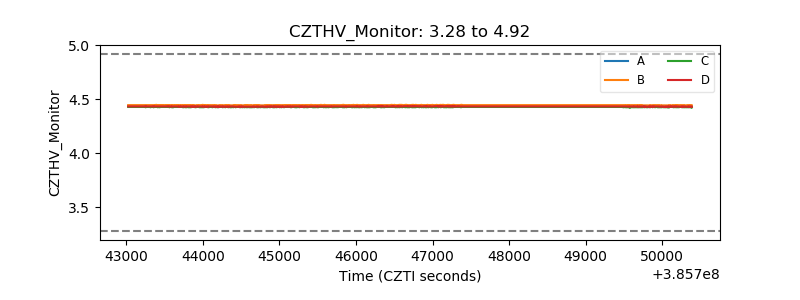 |
| D_VDD | 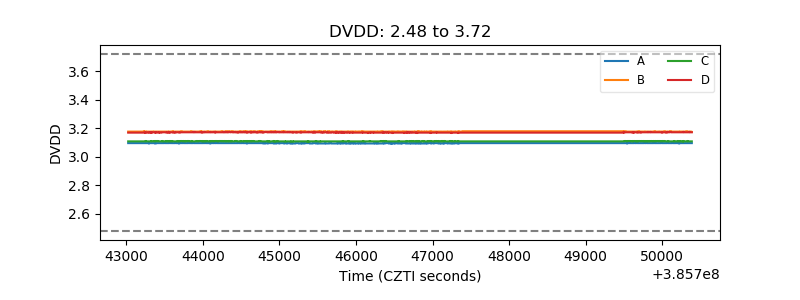 |
| Temperature 1 | 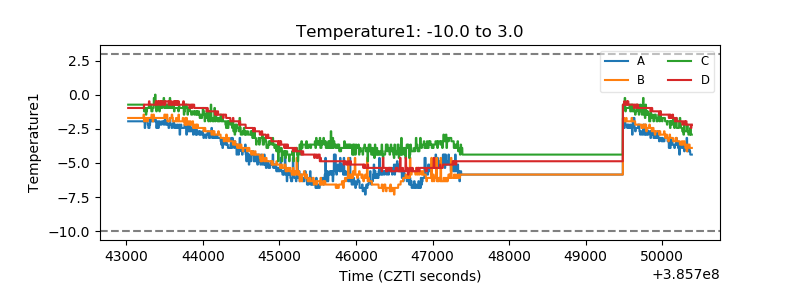 |
| Veto HV Monitor | 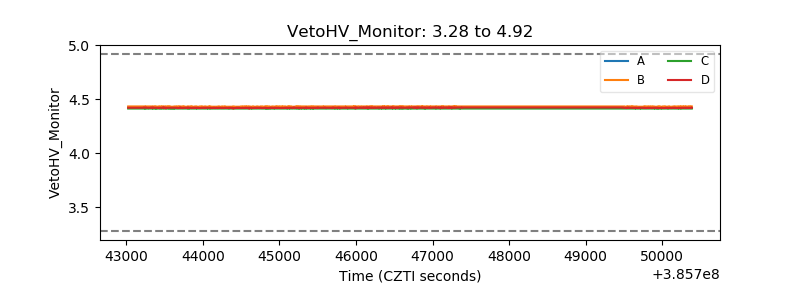 |
| Veto LLD | 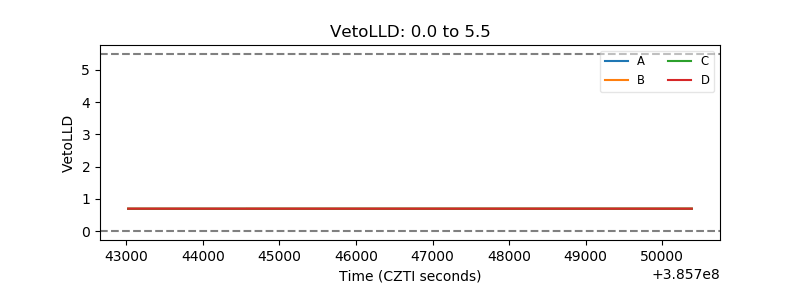 |
| Alpha Counter | 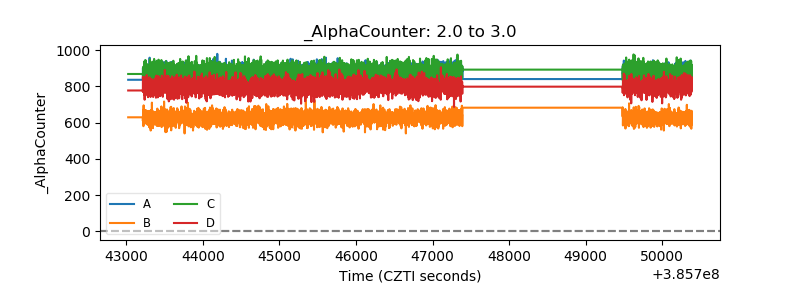 |
| _CPM_Rate | 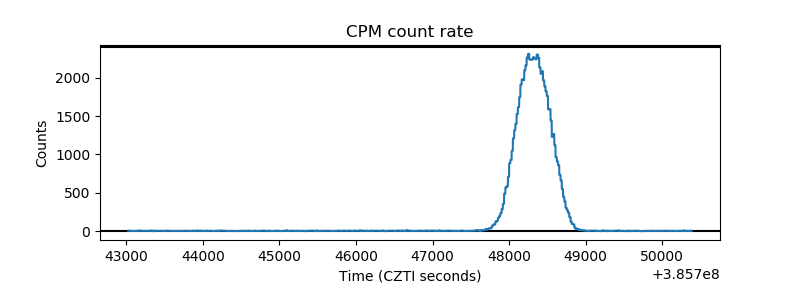 |
| CZT Counter | 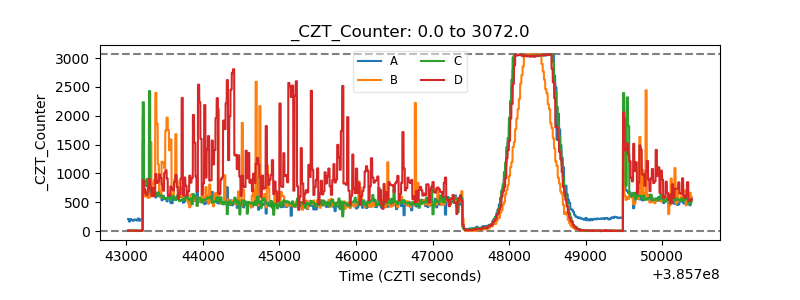 |
| +2.5 Volts monitor |  |
| +5 Volts monitor |  |
| _ROLL_ROT | 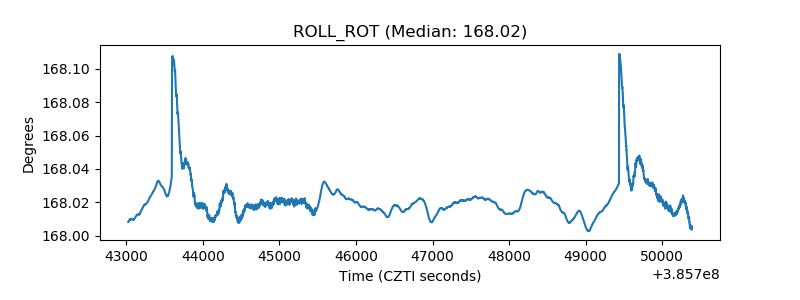 |
| _Roll_DEC | 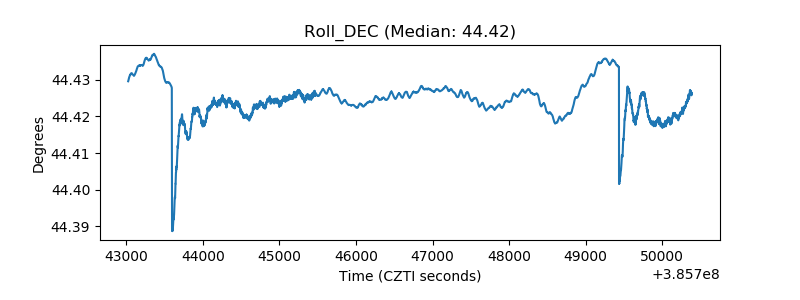 |
| _Roll_RA | 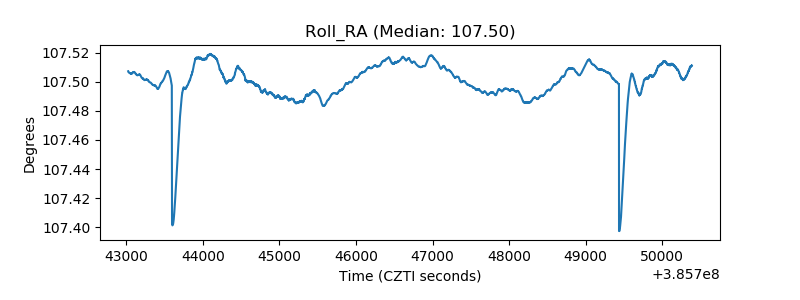 |
| Veto Counter | 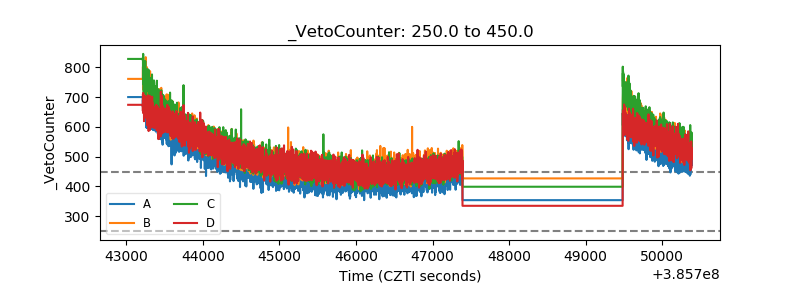 |