| Param | Original file | Final file |
|---|---|---|
| Filename | modeM0/AS1A10_123T17_9000005018cztM0_level2.fits | modeM0/AS1A10_123T17_9000005018cztM0_level2_quad_clean.evt |
| Size (bytes) | 384,698,880 | 360,112,320 |
| Size | 366.9 MB | 343.4 MB |
| Events in quadrant A | 2,381,806 | 2,171,105 |
| Events in quadrant B | 2,260,624 | 2,163,155 |
| Events in quadrant C | 2,330,942 | 2,062,512 |
| Events in quadrant D | 1,964,974 | 1,796,027 |
| Mode M0 | |||
|---|---|---|---|
| Quadrant | BADHDUFLAG | Total packets | Discarded packets |
| A | 0 | 81498 | 0 |
| B | 0 | 86973 | 0 |
| C | 0 | 83571 | 0 |
| D | 0 | 125625 | 0 |
| Mode SS | |||
|---|---|---|---|
| Quadrant | BADHDUFLAG | Total packets | Discarded packets |
| A | 0 | 806 | 0 |
| B | 0 | 806 | 0 |
| C | 0 | 806 | 0 |
| D | 0 | 806 | 0 |
| Mode M9 | |||
|---|---|---|---|
| Quadrant | BADHDUFLAG | Total packets | Discarded packets |
| A | 0 | 146 | 0 |
| B | 0 | 146 | 0 |
| C | 0 | 146 | 0 |
| D | 0 | 146 | 0 |
| Quadrant | Total seconds | Saturated seconds | Saturation percentage |
|---|---|---|---|
| A | 39510 | 53 | 0.134143% |
| B | 39510 | 433 | 1.095925% |
| C | 39510 | 120 | 0.303721% |
| D | 39510 | 1743 | 4.411541% |
Noise dominated data is calculated using 1-second bins in cleaned event files. If a bin has >2000 counts, and if more than 50% of those come from <1% of pixels, then it is considered to be noise-dominated and hence unusable.
| Quadrant | # 1 sec bins | Bins with >0 counts | Bins with >2000 counts | High rate bins dominated by noise | Noise dominated (total time) | Noise dominated (detector-on time) | Marked lightcurve |
|---|---|---|---|---|---|---|---|
| A | 54029 | 39502 | 0 | 0 | 0.00% | 0.00% |  |
| B | 54029 | 39499 | 0 | 0 | 0.00% | 0.00% |  |
| C | 54029 | 39504 | 0 | 0 | 0.00% | 0.00% |  |
| D | 54029 | 39488 | 0 | 0 | 0.00% | 0.00% |  |
Top three noisy pixels from each quadrant. If the there are fewer than three noisy pixels in the level2.evt file, extra rows are filled as -1
| Pixel properties | Quadrant properties | ||||||
|---|---|---|---|---|---|---|---|
| Quadrant | DetID | PixID | Counts | Sigma | Mean | Median | Sigma |
| A | 7 | 110 | 1949 | 9.04 | 621 | 586 | 150.7 |
| A | 9 | 19 | 1921 | 8.86 | 621 | 586 | 150.7 |
| A | 0 | 29 | 1813 | 8.14 | 621 | 586 | 150.7 |
| B | 2 | 9 | 1964 | 11.75 | 598 | 571 | 118.6 |
| B | 3 | 80 | 1737 | 9.84 | 598 | 571 | 118.6 |
| B | 2 | 8 | 1647 | 9.08 | 598 | 571 | 118.6 |
| C | 1 | 81 | 1993 | 9.02 | 616 | 581 | 156.5 |
| C | 1 | 80 | 1899 | 8.42 | 616 | 581 | 156.5 |
| C | 1 | 65 | 1642 | 6.78 | 616 | 581 | 156.5 |
| D | 10 | 189 | 1425 | 6.1 | 562 | 515 | 149.3 |
| D | 10 | 113 | 1422 | 6.08 | 562 | 515 | 149.3 |
| D | 7 | 3 | 1419 | 6.06 | 562 | 515 | 149.3 |
Histogram calculated using DETX and DETY for each event in the final _common_clean file
| Quadrant A | 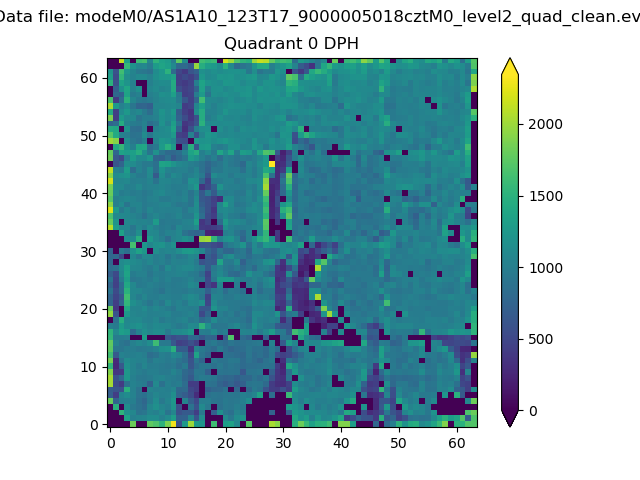 |
 |
Quadrant B |
|---|---|---|---|
| Quadrant D | 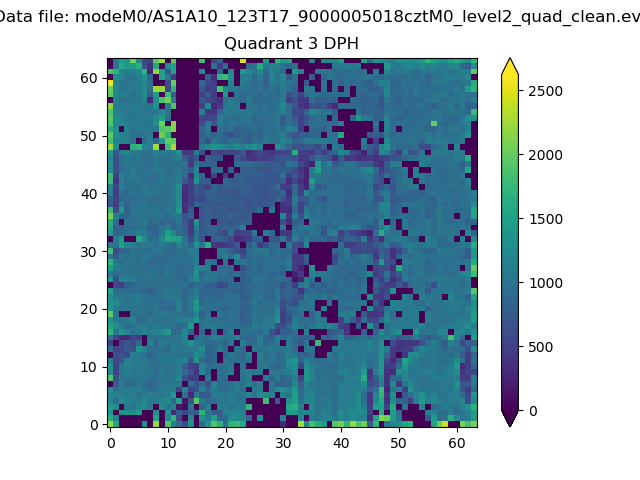 |
 |
Quadrant C |
| Plot type | Count rate plots | Images |
|---|---|---|
| Comparison with Poisson distribution Blue bars denote a histogram of data divided into 1 sec bins. Red curve is a Poisson curve with rate = median count rate of data. |
 |
 |
| Quadrant-wise count rates Data is divided into 100 sec bins |
 |
|
| Module-wise count rates for Quadrant A Data is divided into 100 sec bins |
 |
 |
| Module-wise count rates for Quadrant B Data is divided into 100 sec bins |
 |
 |
| Module-wise count rates for Quadrant C Data is divided into 100 sec bins |
 |
 |
| Module-wise count rates for Quadrant D Data is divided into 100 sec bins |
 |
 |
| Parameter | Plot |
|---|---|
| CZT HV Monitor |  |
| D_VDD |  |
| Temperature 1 |  |
| Veto HV Monitor |  |
| Veto LLD |  |
| Alpha Counter |  |
| _CPM_Rate |  |
| CZT Counter |  |
| +2.5 Volts monitor |  |
| +5 Volts monitor |  |
| _ROLL_ROT |  |
| _Roll_DEC | 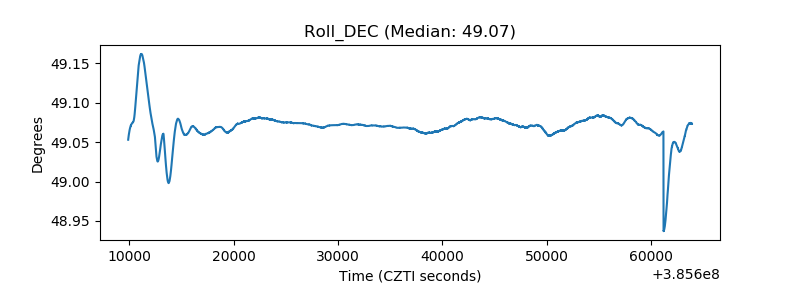 |
| _Roll_RA |  |
| Veto Counter |  |