| Param | Original file | Final file |
|---|---|---|
| Filename | modeM0/AS1A10_123T17_9000005018_35038cztM0_level2.evt | modeM0/AS1A10_123T17_9000005018_35038cztM0_level2_quad_clean.evt |
| Size (bytes) | 801,288,000 | 118,428,480 |
| Size | 764.2 MB | 112.9 MB |
| Events in quadrant A | 4,996,465 | 721,916 |
| Events in quadrant B | 5,429,726 | 732,772 |
| Events in quadrant C | 5,384,703 | 717,583 |
| Events in quadrant D | 7,734,013 | 674,773 |
| Mode M0 | |||
|---|---|---|---|
| Quadrant | BADHDUFLAG | Total packets | Discarded packets |
| A | 0 | 21665 | 4 |
| B | 0 | 22852 | 3 |
| C | 0 | 22181 | 3 |
| D | 0 | 30297 | 3 |
| Mode SS | |||
|---|---|---|---|
| Quadrant | BADHDUFLAG | Total packets | Discarded packets |
| A | 0 | 218 | 0 |
| B | 0 | 218 | 0 |
| C | 0 | 218 | 0 |
| D | 0 | 218 | 0 |
| Mode M9 | |||
|---|---|---|---|
| Quadrant | BADHDUFLAG | Total packets | Discarded packets |
| A | 0 | 33 | 0 |
| B | 0 | 33 | 0 |
| C | 0 | 33 | 0 |
| D | 0 | 34 | 0 |
| Quadrant | Total seconds | Saturated seconds | Saturation percentage |
|---|---|---|---|
| A | 10677 | 20 | 0.187319% |
| B | 10677 | 56 | 0.524492% |
| C | 10677 | 39 | 0.365271% |
| D | 10677 | 223 | 2.088602% |
Noise dominated data is calculated using 1-second bins in cleaned event files. If a bin has >2000 counts, and if more than 50% of those come from <1% of pixels, then it is considered to be noise-dominated and hence unusable.
| Quadrant | # 1 sec bins | Bins with >0 counts | Bins with >2000 counts | High rate bins dominated by noise | Noise dominated (total time) | Noise dominated (detector-on time) | Marked lightcurve |
|---|---|---|---|---|---|---|---|
| A | 13453 | 10677 | 7 | 7 | 0.05% | 0.07% | 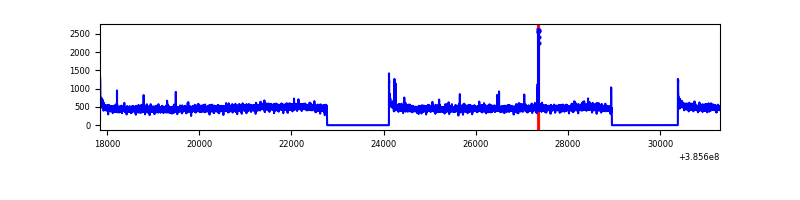 |
| B | 13453 | 10676 | 26 | 26 | 0.19% | 0.24% | 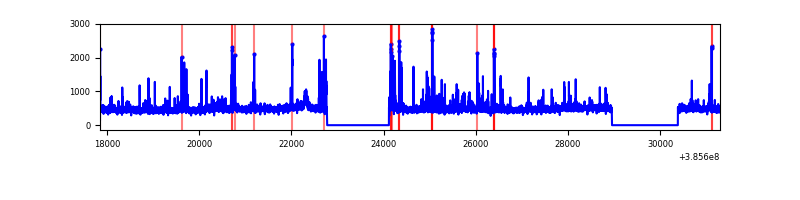 |
| C | 13453 | 10677 | 30 | 30 | 0.22% | 0.28% | 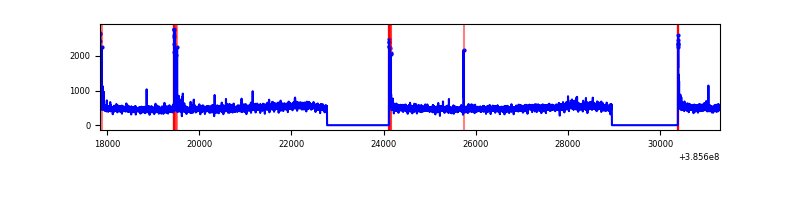 |
| D | 13453 | 10677 | 212 | 212 | 1.58% | 1.99% | 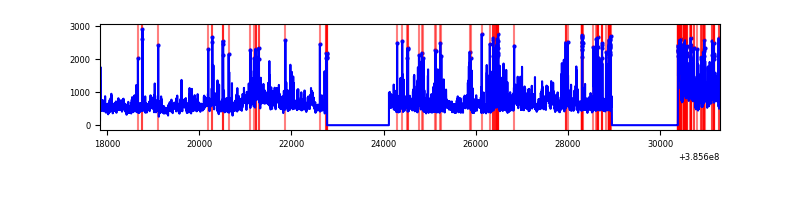 |
Top three noisy pixels from each quadrant. If the there are fewer than three noisy pixels in the level2.evt file, extra rows are filled as -1
| Pixel properties | Quadrant properties | ||||||
|---|---|---|---|---|---|---|---|
| Quadrant | DetID | PixID | Counts | Sigma | Mean | Median | Sigma |
| A | 10 | 83 | 123159 | 484.18 | 1247 | 1222 | 251.8 |
| A | 7 | 16 | 29463 | 112.14 | 1247 | 1222 | 251.8 |
| A | 13 | 6 | 16339 | 60.03 | 1247 | 1222 | 251.8 |
| B | 5 | 172 | 197264 | 820.79 | 1237 | 1203 | 238.9 |
| B | 4 | 232 | 104470 | 432.32 | 1237 | 1203 | 238.9 |
| B | 0 | 199 | 97715 | 404.04 | 1237 | 1203 | 238.9 |
| C | 15 | 214 | 442680 | 1572.16 | 1212 | 1221 | 280.8 |
| C | 0 | 10 | 88339 | 310.25 | 1212 | 1221 | 280.8 |
| C | 12 | 250 | 46498 | 161.24 | 1212 | 1221 | 280.8 |
| D | 8 | 195 | 1508551 | 5117.31 | 1204 | 1171 | 294.6 |
| D | 2 | 250 | 487426 | 1650.76 | 1204 | 1171 | 294.6 |
| D | 14 | 52 | 420906 | 1424.93 | 1204 | 1171 | 294.6 |
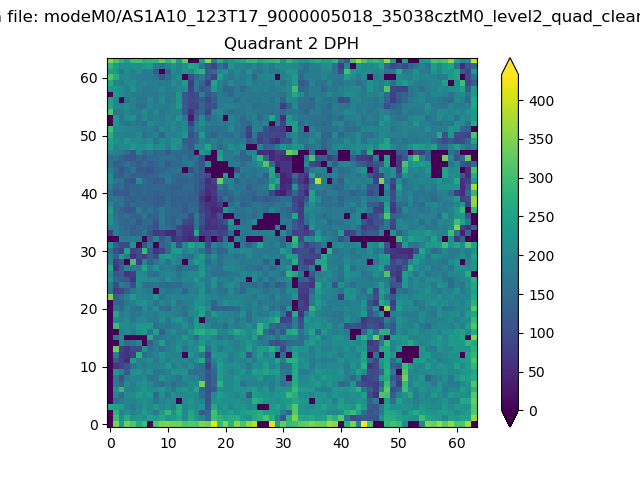
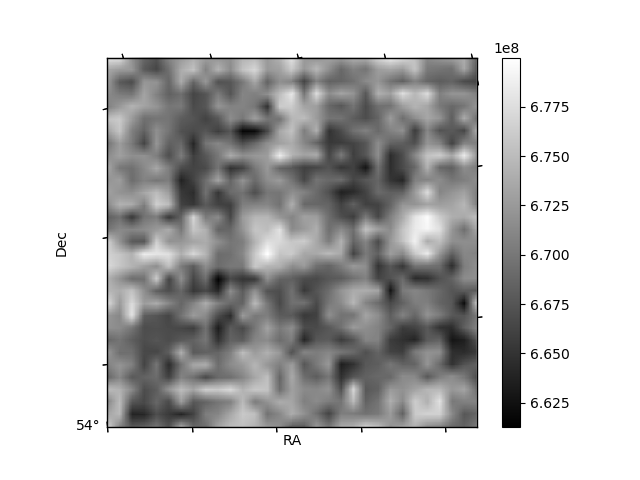
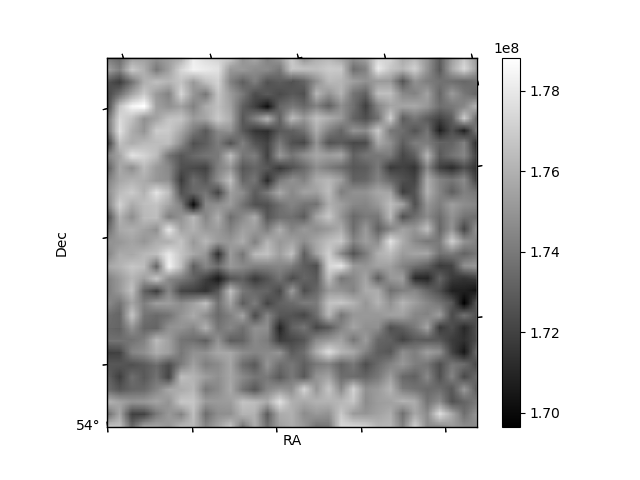
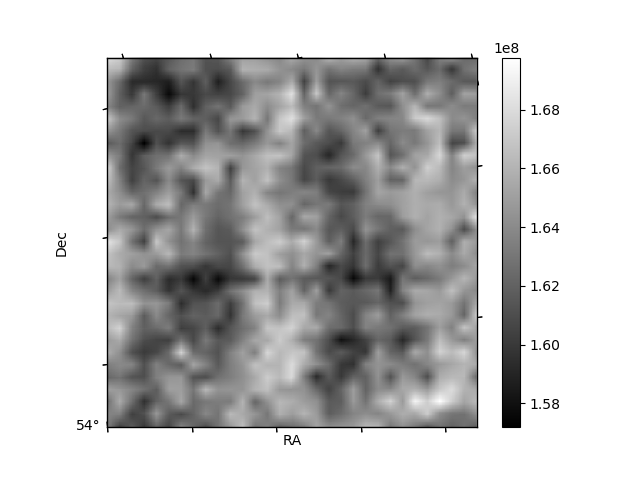
Histogram calculated using DETX and DETY for each event in the final _common_clean file
| Quadrant A | 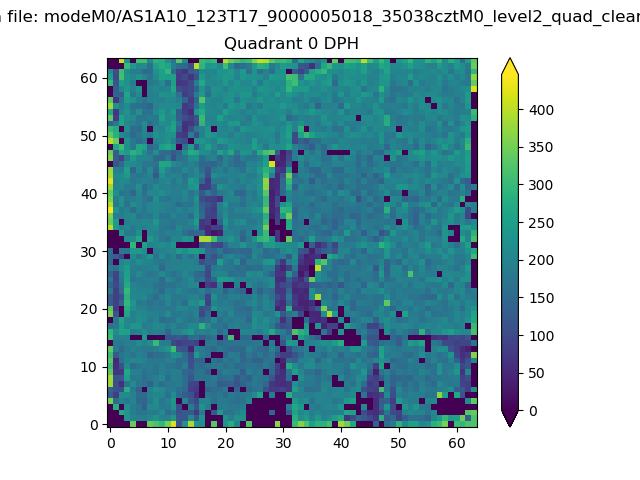 |
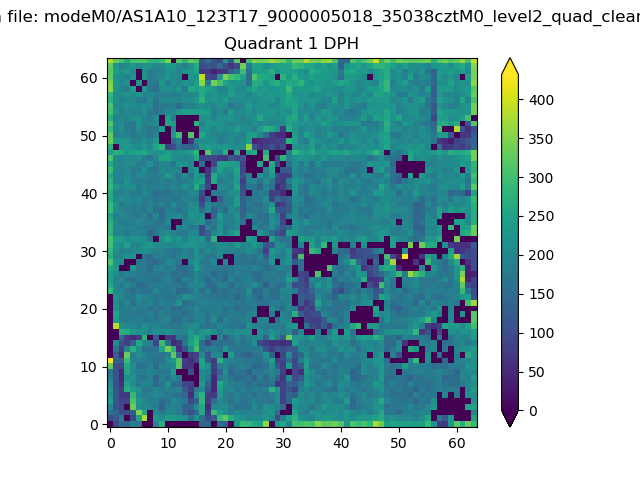 |
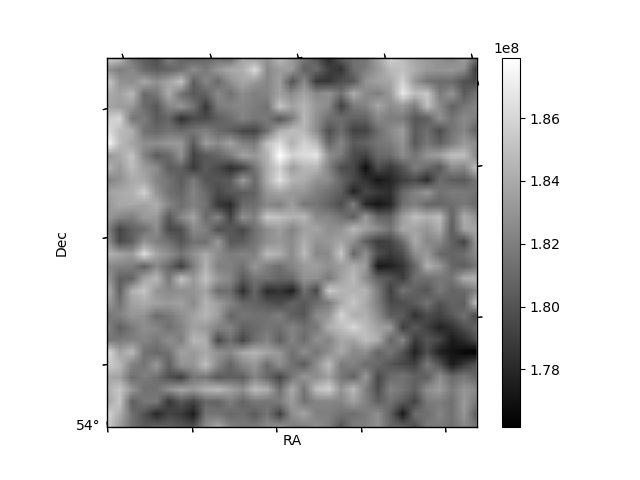
Quadrant B |
|---|---|---|---|
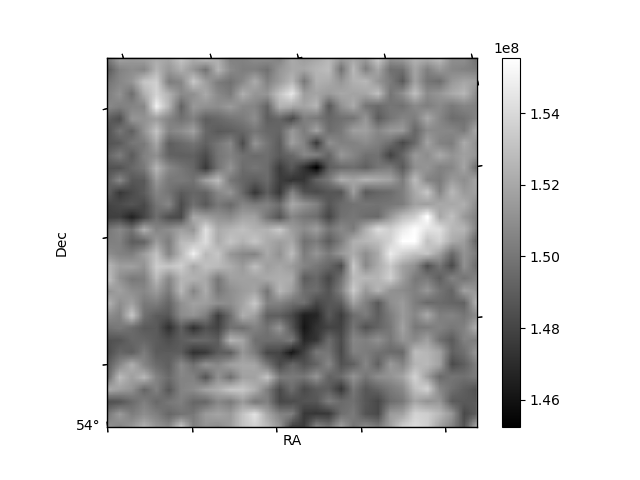
| Quadrant D | 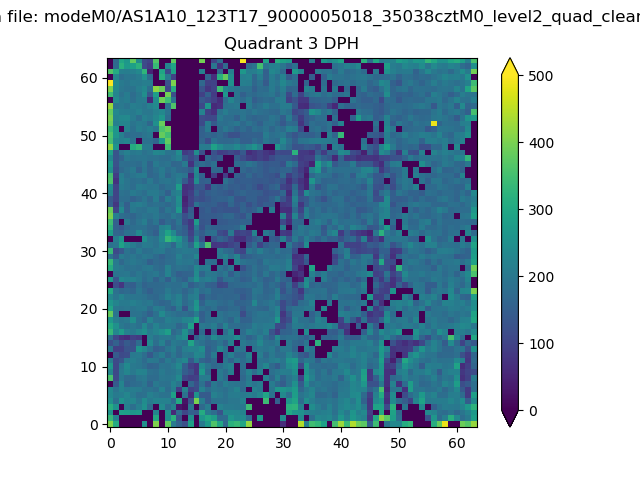 |
 |
Quadrant C |
| Plot type | Count rate plots | Images |
|---|---|---|
| Comparison with Poisson distribution Blue bars denote a histogram of data divided into 1 sec bins. Red curve is a Poisson curve with rate = median count rate of data. |
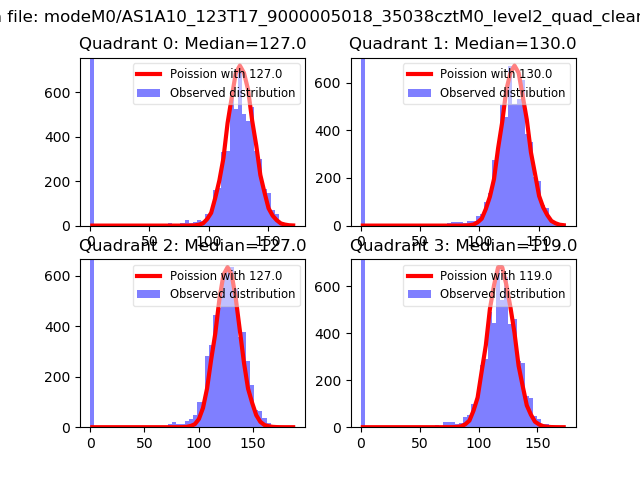 |
 |
| Quadrant-wise count rates Data is divided into 100 sec bins |
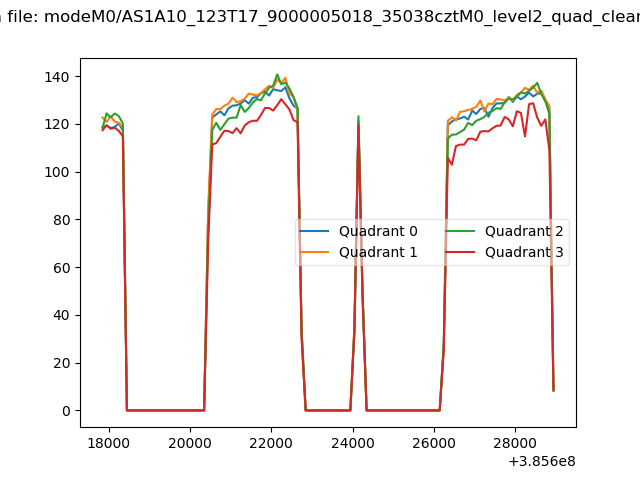 |
|
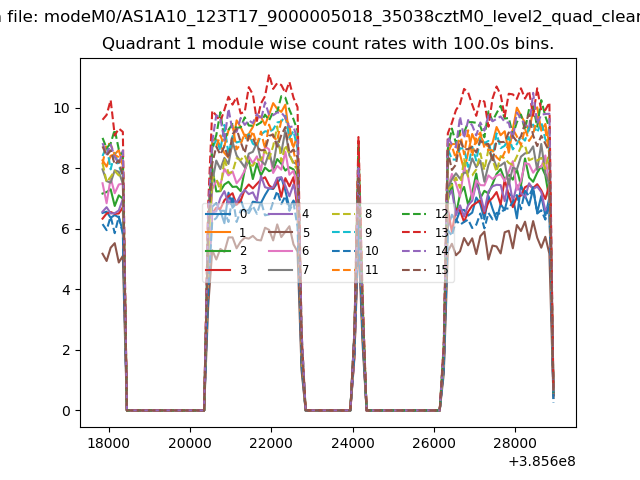
| Module-wise count rates for Quadrant A Data is divided into 100 sec bins |
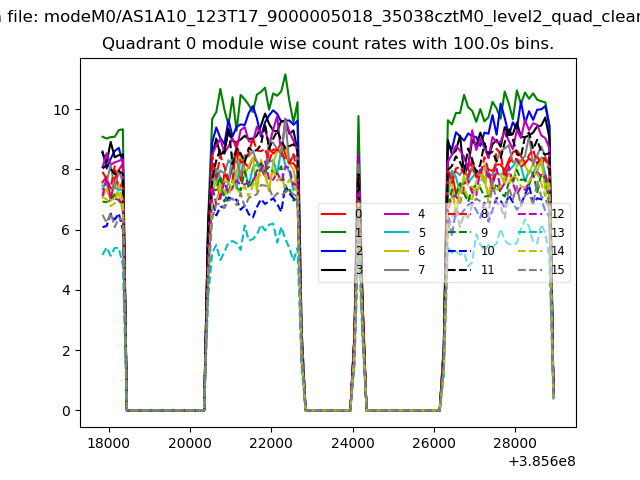 |
 |
| Module-wise count rates for Quadrant B Data is divided into 100 sec bins |
 |
 |
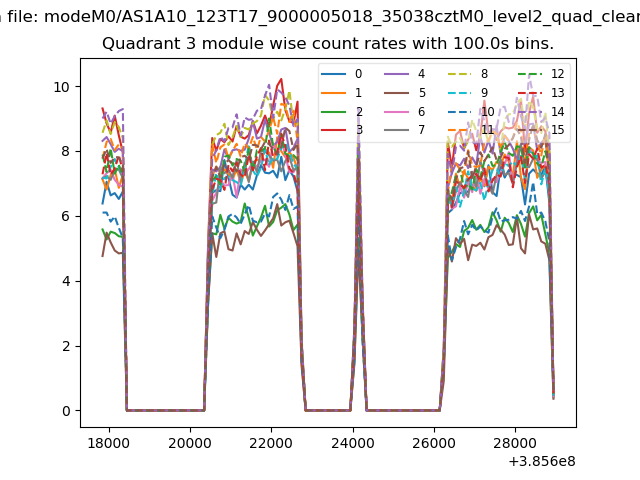
| Module-wise count rates for Quadrant C Data is divided into 100 sec bins |
 |
 |
| Module-wise count rates for Quadrant D Data is divided into 100 sec bins |
 |
 |
| Parameter | Plot |
|---|---|
| CZT HV Monitor |  |
| D_VDD | 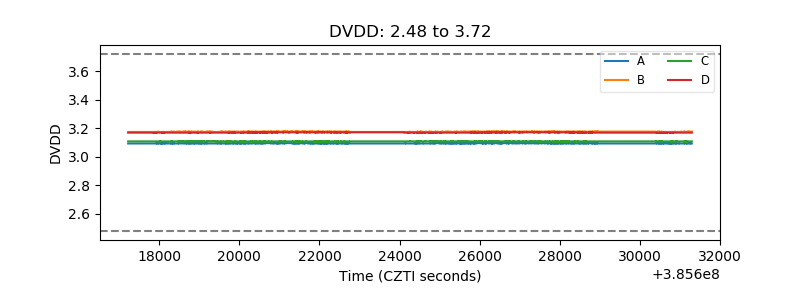 |
| Temperature 1 | 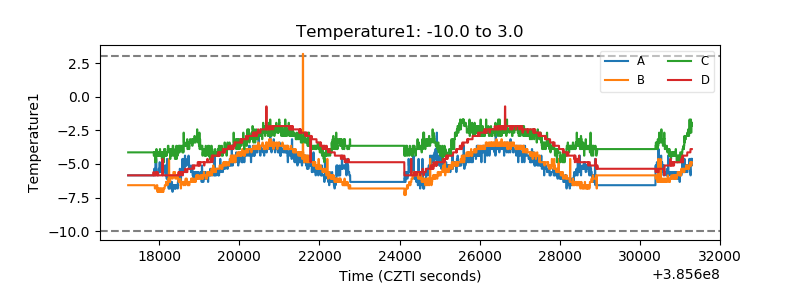 |
| Veto HV Monitor | 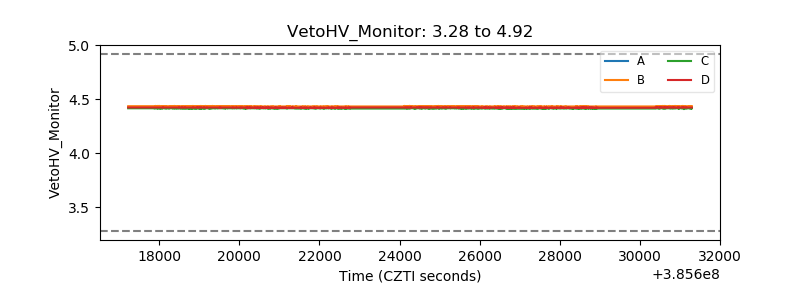 |
| Veto LLD | 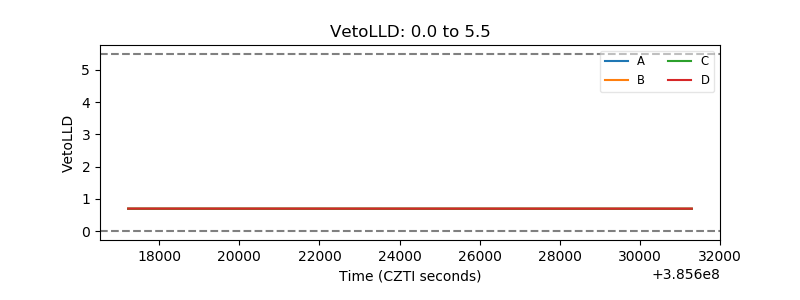 |
| Alpha Counter | 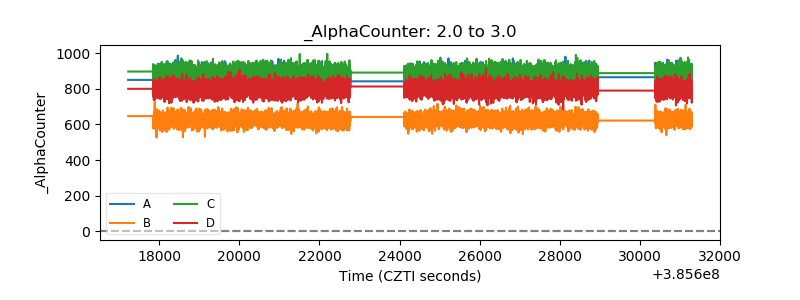 |
| _CPM_Rate | 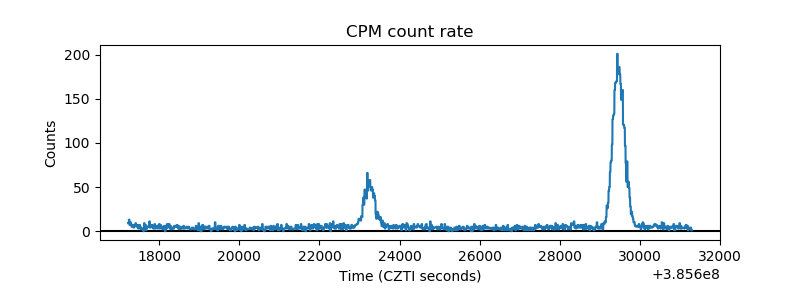 |
| CZT Counter | 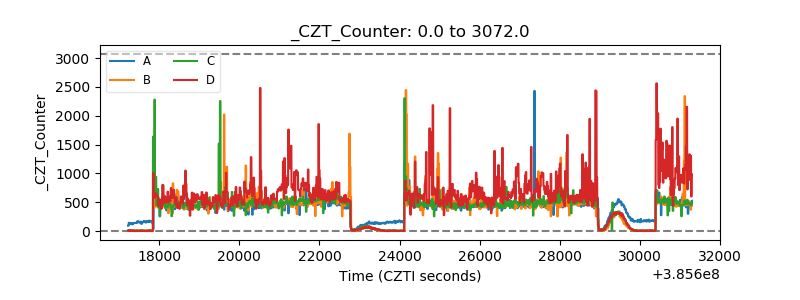 |
| +2.5 Volts monitor |  |
| +5 Volts monitor | 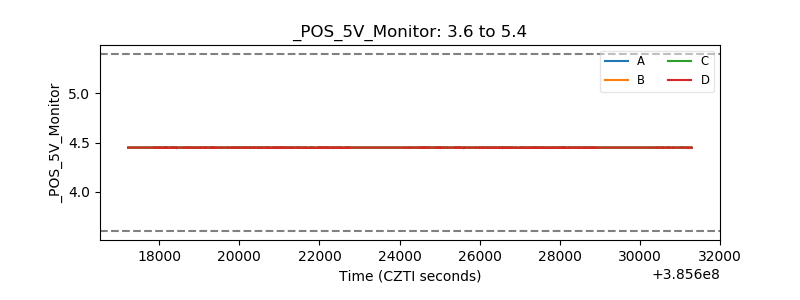 |
| _ROLL_ROT | 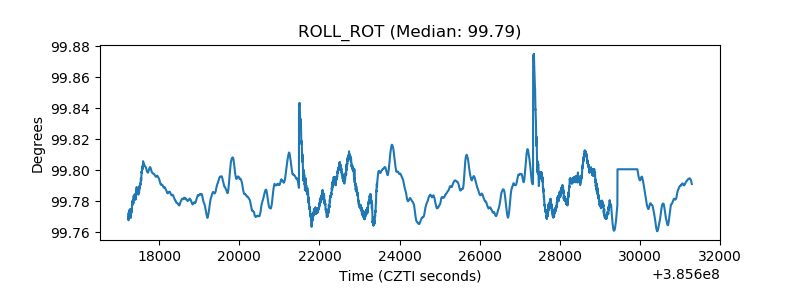 |
| _Roll_DEC | 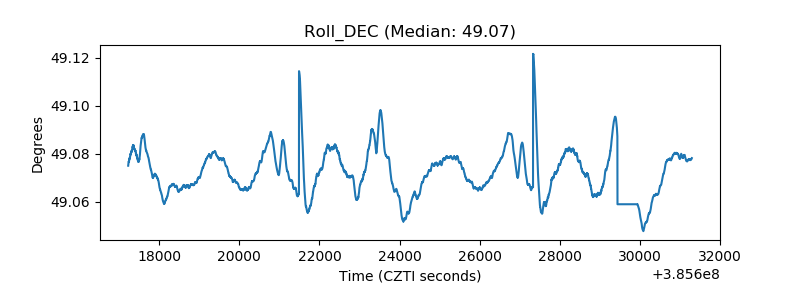 |
| _Roll_RA | 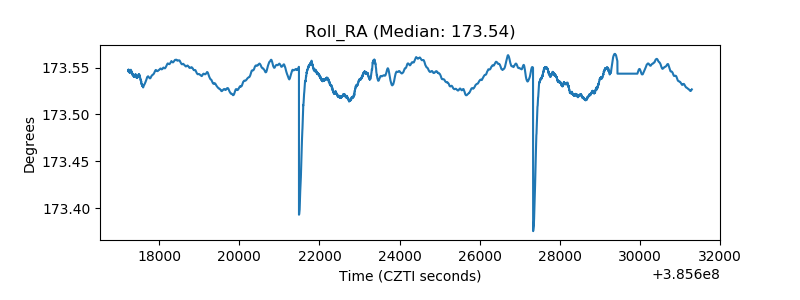 |
| Veto Counter |  |