| Param | Original file | Final file |
|---|---|---|
| Filename | modeM0/AS1A11_046T08_9000005024_35062cztM0_level2.evt | modeM0/AS1A11_046T08_9000005024_35062cztM0_level2_quad_clean.evt |
| Size (bytes) | 265,844,160 | 63,696,960 |
| Size | 253.5 MB | 60.7 MB |
| Events in quadrant A | 1,546,146 | 421,023 |
| Events in quadrant B | 1,647,745 | 432,121 |
| Events in quadrant C | 1,715,844 | 440,714 |
| Events in quadrant D | 2,913,471 | 398,370 |
| Mode M9 | |||
|---|---|---|---|
| Quadrant | BADHDUFLAG | Total packets | Discarded packets |
| A | 0 | 19 | 0 |
| B | 0 | 19 | 0 |
| C | 0 | 19 | 0 |
| D | 0 | 19 | 0 |
| Mode M0 | |||
|---|---|---|---|
| Quadrant | BADHDUFLAG | Total packets | Discarded packets |
| A | 0 | 6883 | 2 |
| B | 0 | 7172 | 1 |
| C | 0 | 7060 | 1 |
| D | 0 | 11007 | 1 |
| Mode SS | |||
|---|---|---|---|
| Quadrant | BADHDUFLAG | Total packets | Discarded packets |
| A | 0 | 70 | 0 |
| B | 0 | 70 | 0 |
| C | 0 | 70 | 0 |
| D | 0 | 70 | 0 |
| Quadrant | Total seconds | Saturated seconds | Saturation percentage |
|---|---|---|---|
| A | 3329 | 10 | 0.300391% |
| B | 3329 | 31 | 0.931211% |
| C | 3329 | 43 | 1.291679% |
| D | 3329 | 213 | 6.398318% |
Noise dominated data is calculated using 1-second bins in cleaned event files. If a bin has >2000 counts, and if more than 50% of those come from <1% of pixels, then it is considered to be noise-dominated and hence unusable.
| Quadrant | # 1 sec bins | Bins with >0 counts | Bins with >2000 counts | High rate bins dominated by noise | Noise dominated (total time) | Noise dominated (detector-on time) | Marked lightcurve |
|---|---|---|---|---|---|---|---|
| A | 5212 | 3329 | 10 | 10 | 0.19% | 0.30% | 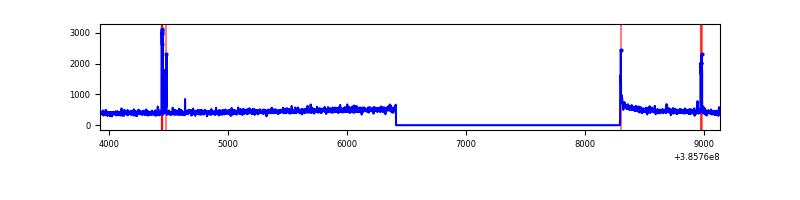 |
| B | 5212 | 3329 | 16 | 16 | 0.31% | 0.48% | 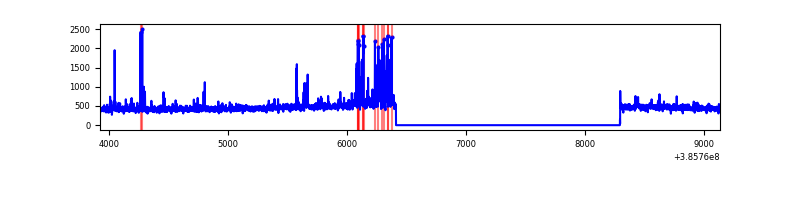 |
| C | 5213 | 3330 | 35 | 35 | 0.67% | 1.05% | 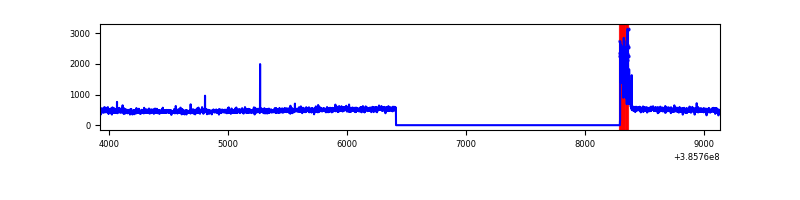 |
| D | 5212 | 3329 | 190 | 190 | 3.65% | 5.71% | 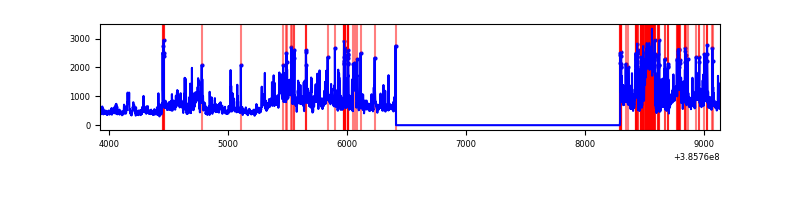 |
Top three noisy pixels from each quadrant. If the there are fewer than three noisy pixels in the level2.evt file, extra rows are filled as -1
| Pixel properties | Quadrant properties | ||||||
|---|---|---|---|---|---|---|---|
| Quadrant | DetID | PixID | Counts | Sigma | Mean | Median | Sigma |
| A | 9 | 143 | 46263 | 606.53 | 374 | 366 | 75.7 |
| A | 10 | 83 | 41053 | 537.68 | 374 | 366 | 75.7 |
| A | 13 | 6 | 5892 | 73.03 | 374 | 366 | 75.7 |
| B | 5 | 172 | 97898 | 1347.32 | 374 | 364 | 72.4 |
| B | 0 | 190 | 57505 | 789.34 | 374 | 364 | 72.4 |
| B | 4 | 232 | 10311 | 137.41 | 374 | 364 | 72.4 |
| C | 15 | 214 | 137452 | 1599.87 | 368 | 372 | 85.7 |
| C | 0 | 10 | 117752 | 1369.95 | 368 | 372 | 85.7 |
| C | 14 | 67 | 15102 | 171.91 | 368 | 372 | 85.7 |
| D | 8 | 195 | 516835 | 5903.83 | 355 | 346 | 87.5 |
| D | 10 | 118 | 220608 | 2517.75 | 355 | 346 | 87.5 |
| D | 12 | 227 | 132609 | 1511.86 | 355 | 346 | 87.5 |
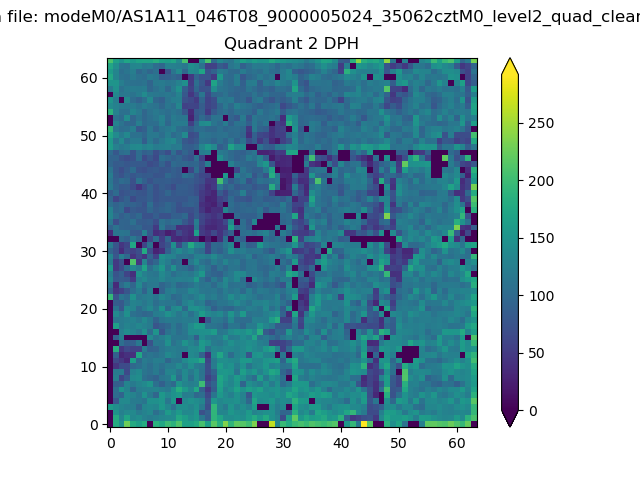
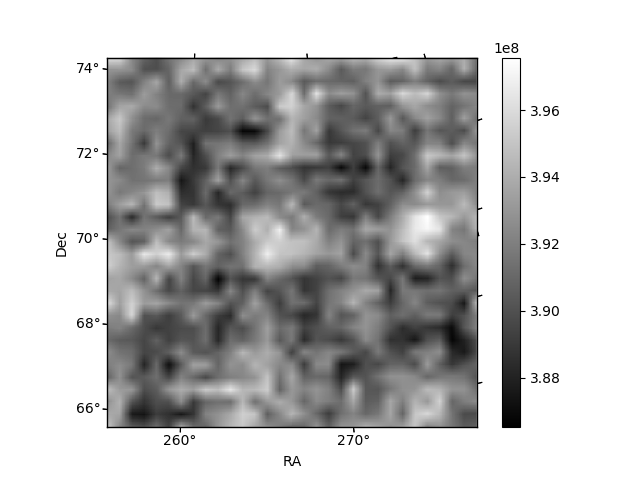
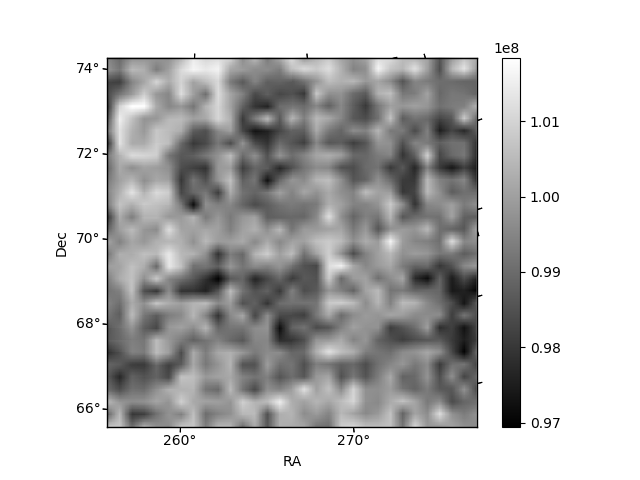
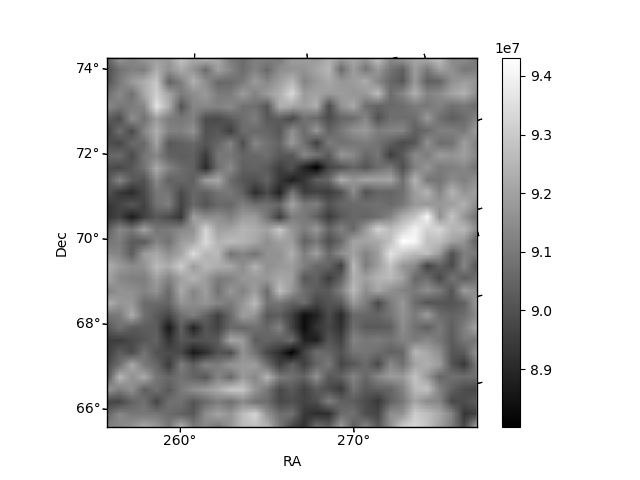
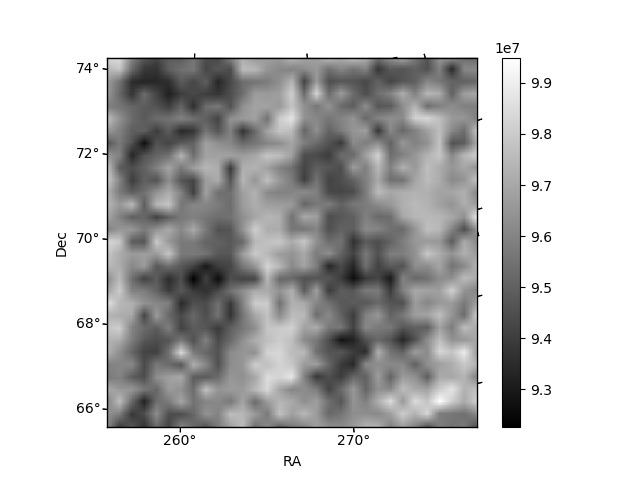
Histogram calculated using DETX and DETY for each event in the final _common_clean file
| Quadrant A | 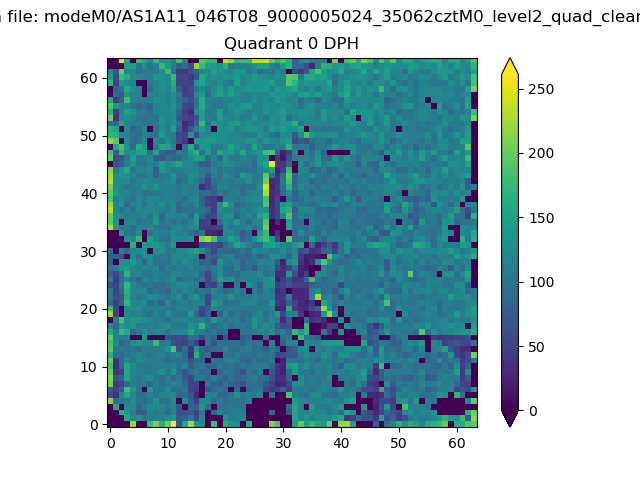 |
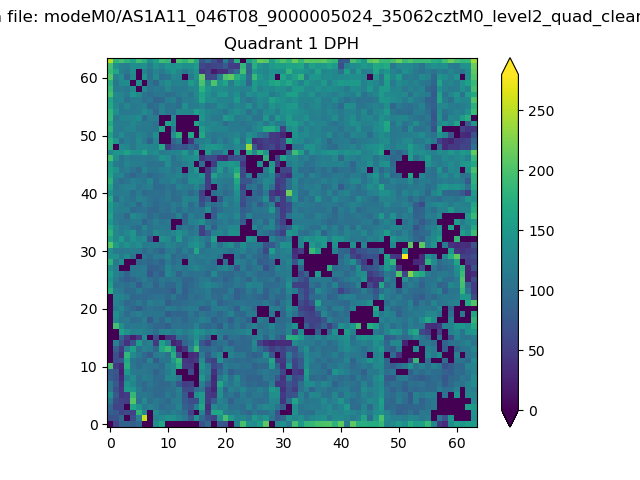 |
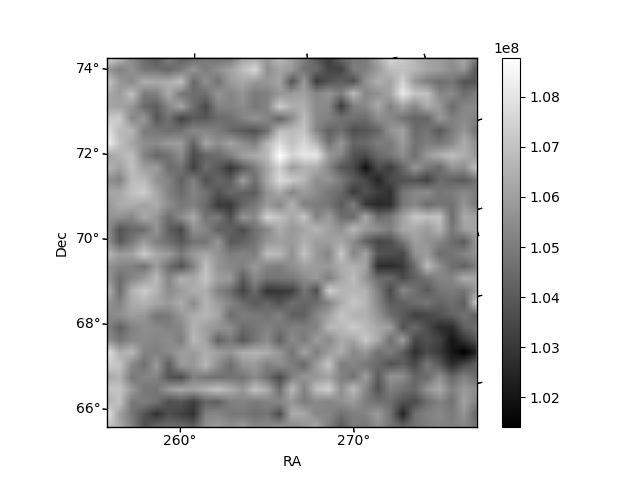
Quadrant B |
|---|---|---|---|
| Quadrant D | 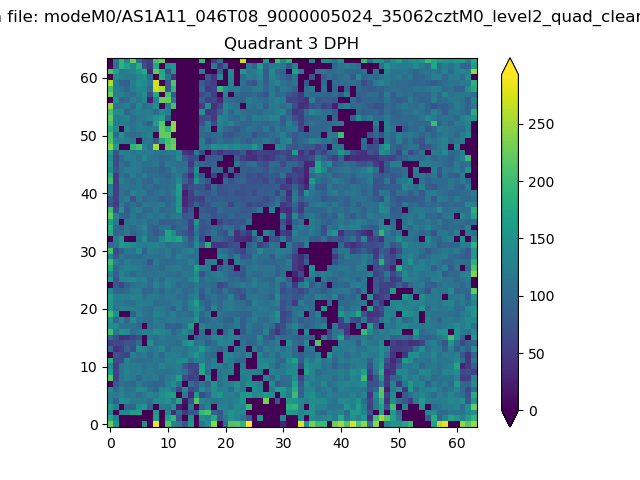 |
 |
Quadrant C |
| Plot type | Count rate plots | Images |
|---|---|---|
| Comparison with Poisson distribution Blue bars denote a histogram of data divided into 1 sec bins. Red curve is a Poisson curve with rate = median count rate of data. |
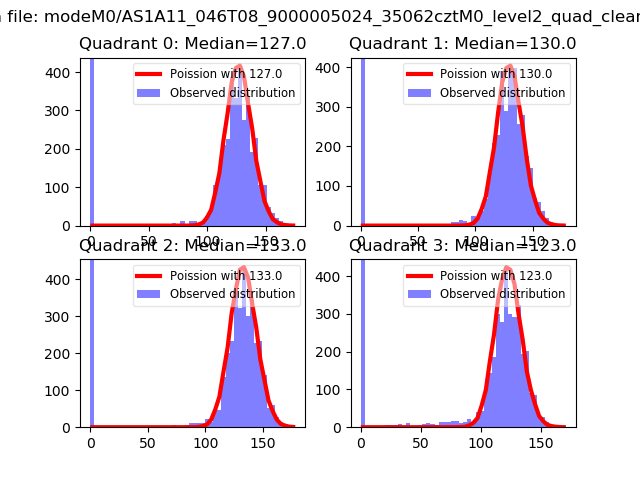 |
 |
| Quadrant-wise count rates Data is divided into 100 sec bins |
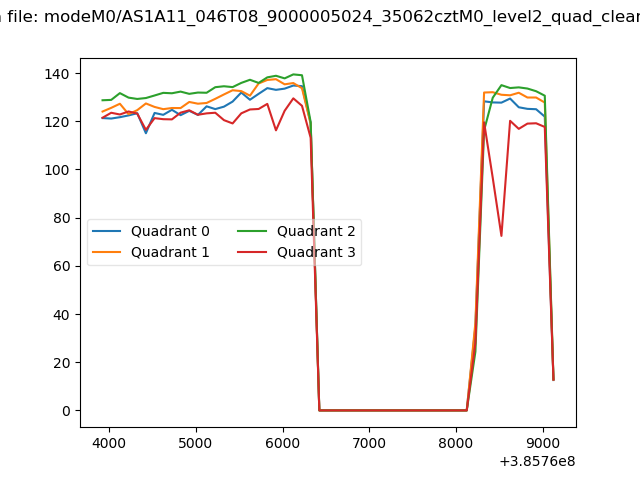 |
|
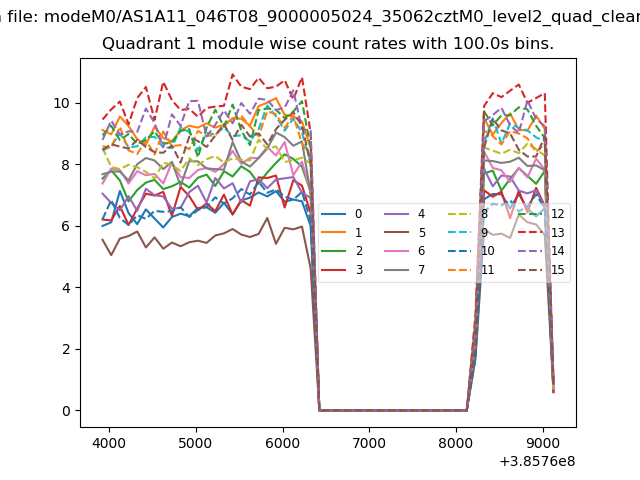
| Module-wise count rates for Quadrant A Data is divided into 100 sec bins |
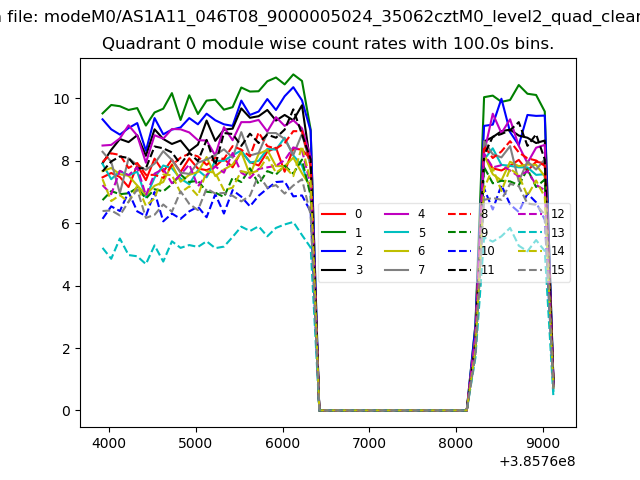 |
 |
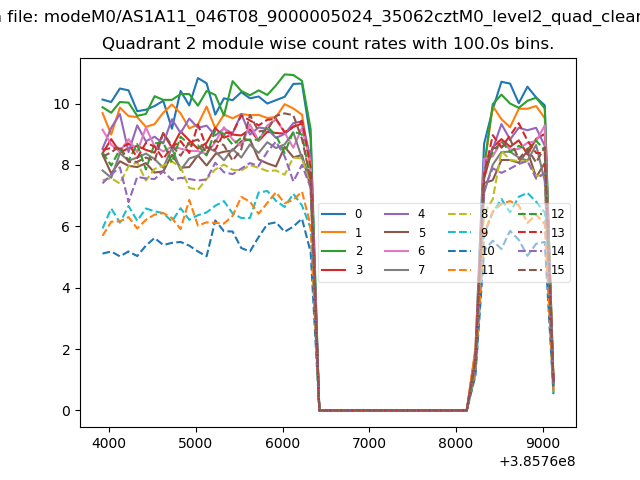
| Module-wise count rates for Quadrant B Data is divided into 100 sec bins |
 |
 |
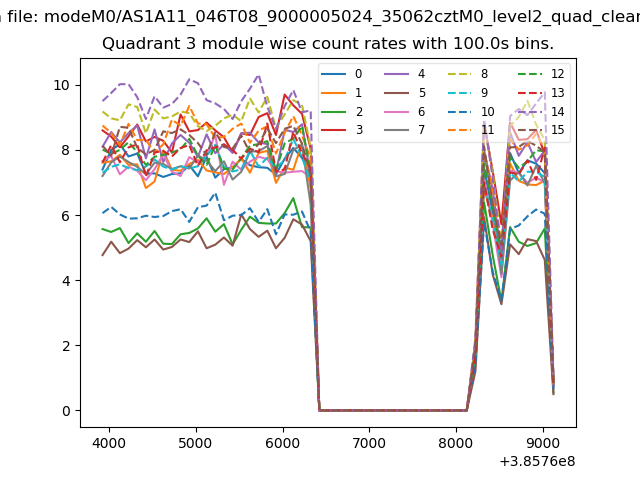
| Module-wise count rates for Quadrant C Data is divided into 100 sec bins |
 |
 |
| Module-wise count rates for Quadrant D Data is divided into 100 sec bins |
 |
 |
| Parameter | Plot |
|---|---|
| CZT HV Monitor | 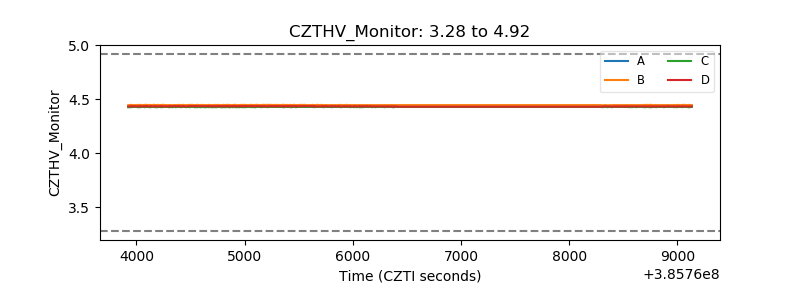 |
| D_VDD | 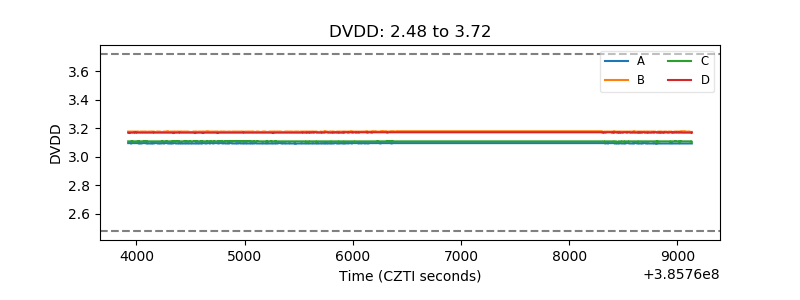 |
| Temperature 1 | 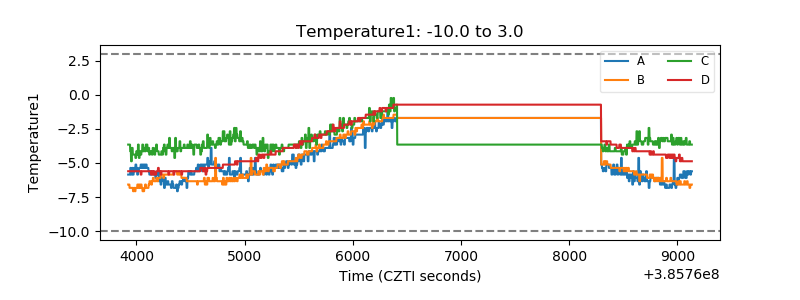 |
| Veto HV Monitor | 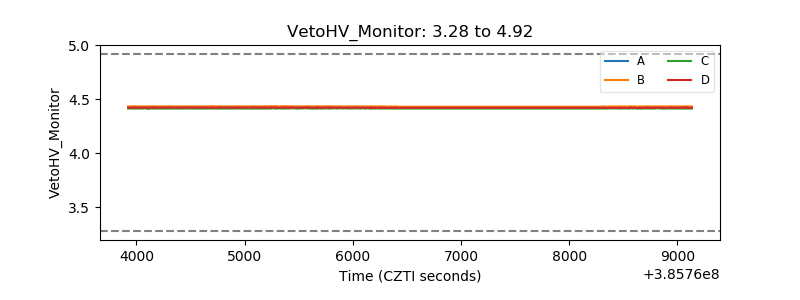 |
| Veto LLD | 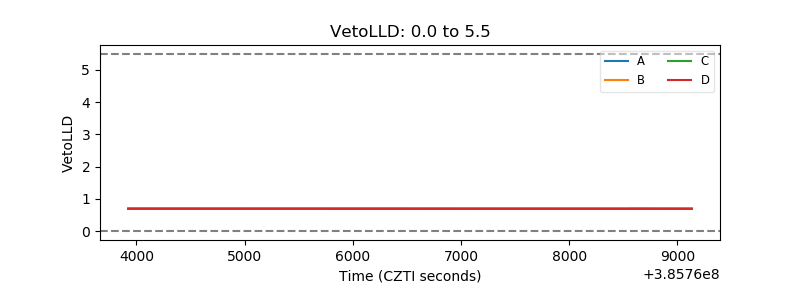 |
| Alpha Counter | 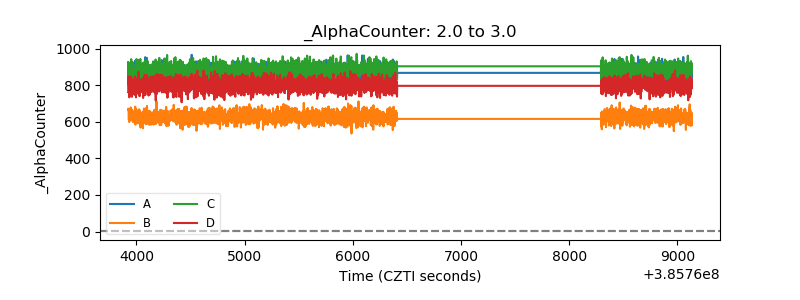 |
| _CPM_Rate | 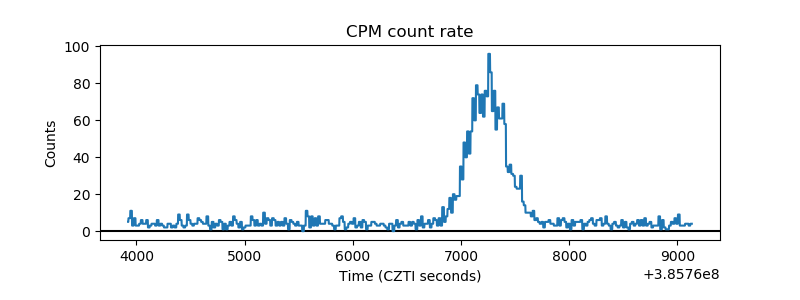 |
| CZT Counter | 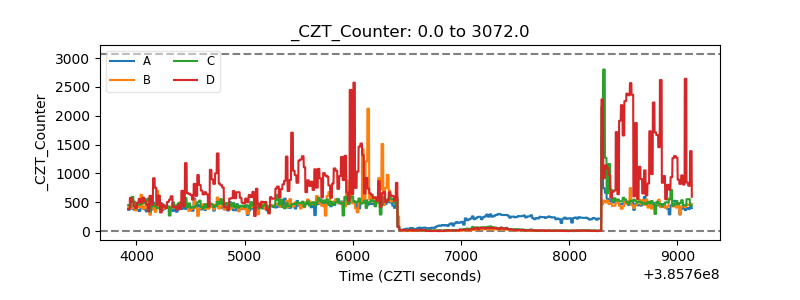 |
| +2.5 Volts monitor |  |
| +5 Volts monitor | 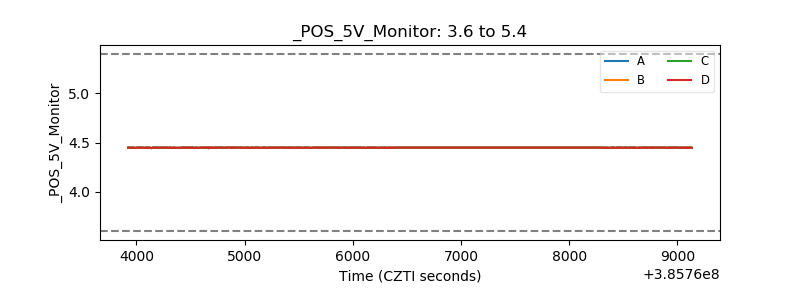 |
| _ROLL_ROT | 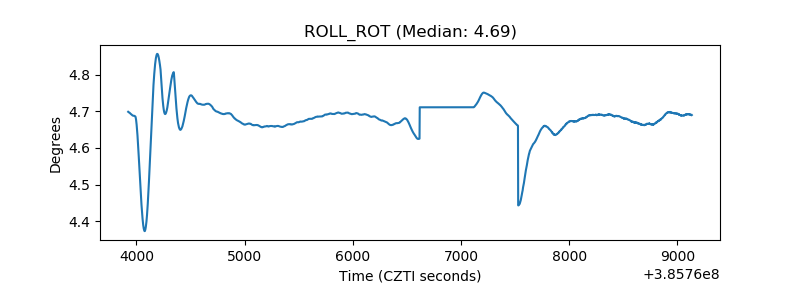 |
| _Roll_DEC | 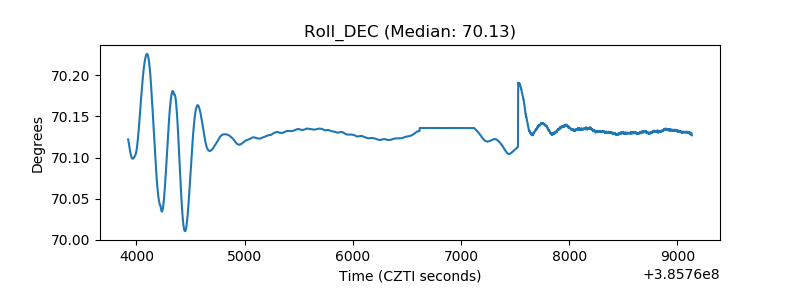 |
| _Roll_RA | 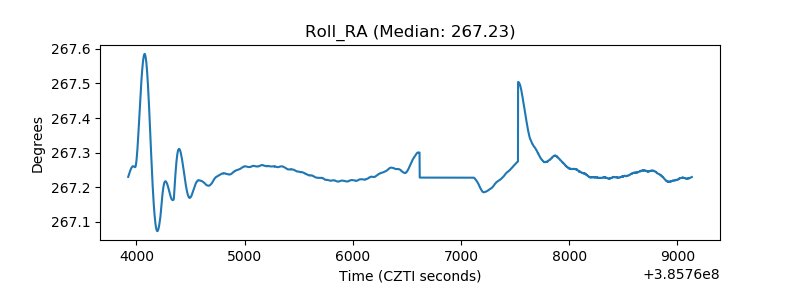 |
| Veto Counter | 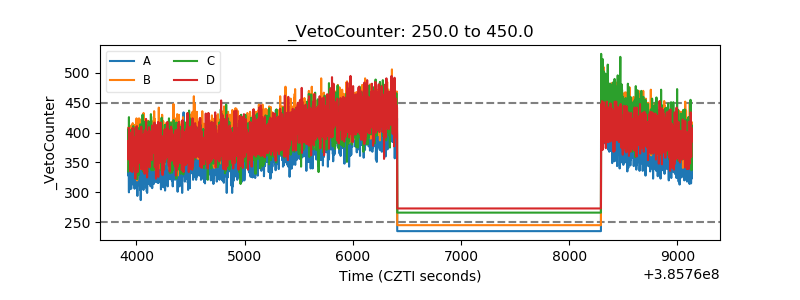 |