| Param | Original file | Final file |
|---|---|---|
| Filename | modeM0/AS1T05_015T01_9000005026cztM0_level2.fits | modeM0/AS1T05_015T01_9000005026cztM0_level2_quad_clean.evt |
| Size (bytes) | 2,031,359,040 | 1,901,361,600 |
| Size | 1.9 GB | 1.8 GB |
| Events in quadrant A | 12,589,052 | 11,268,233 |
| Events in quadrant B | 12,040,352 | 11,473,739 |
| Events in quadrant C | 12,464,022 | 11,110,513 |
| Events in quadrant D | 10,179,182 | 9,493,681 |
| Mode SS | |||
|---|---|---|---|
| Quadrant | BADHDUFLAG | Total packets | Discarded packets |
| A | 0 | 4244 | 0 |
| B | 0 | 4244 | 0 |
| C | 0 | 4244 | 0 |
| D | 0 | 4244 | 0 |
| Mode M9 | |||
|---|---|---|---|
| Quadrant | BADHDUFLAG | Total packets | Discarded packets |
| A | 0 | 824 | 0 |
| B | 0 | 824 | 0 |
| C | 0 | 824 | 0 |
| D | 0 | 827 | 0 |
| Mode M0 | |||
|---|---|---|---|
| Quadrant | BADHDUFLAG | Total packets | Discarded packets |
| A | 0 | 501732 | 0 |
| B | 0 | 513837 | 0 |
| C | 0 | 472589 | 0 |
| D | 0 | 864096 | 0 |
| Quadrant | Total seconds | Saturated seconds | Saturation percentage |
|---|---|---|---|
| A | 207819 | 7538 | 3.627195% |
| B | 207817 | 6598 | 3.174909% |
| C | 207819 | 3147 | 1.514299% |
| D | 207818 | 21109 | 10.157445% |
Noise dominated data is calculated using 1-second bins in cleaned event files. If a bin has >2000 counts, and if more than 50% of those come from <1% of pixels, then it is considered to be noise-dominated and hence unusable.
| Quadrant | # 1 sec bins | Bins with >0 counts | Bins with >2000 counts | High rate bins dominated by noise | Noise dominated (total time) | Noise dominated (detector-on time) | Marked lightcurve |
|---|---|---|---|---|---|---|---|
| A | 303444 | 207728 | 0 | 0 | 0.00% | 0.00% | 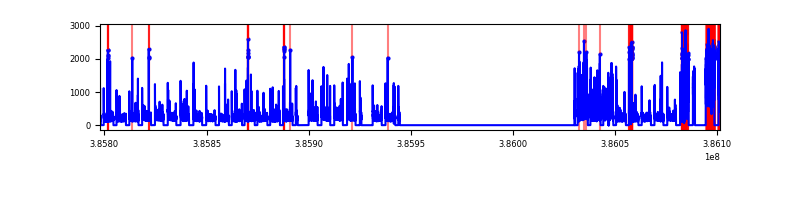 |
| B | 303444 | 207767 | 0 | 0 | 0.00% | 0.00% | 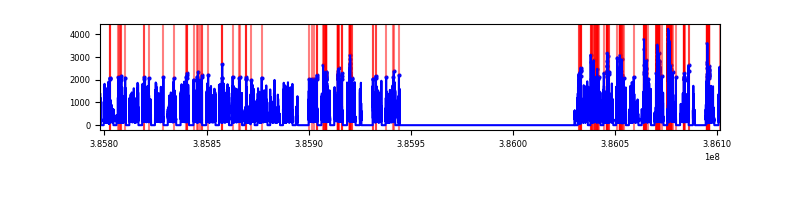 |
| C | 303444 | 207802 | 0 | 0 | 0.00% | 0.00% | 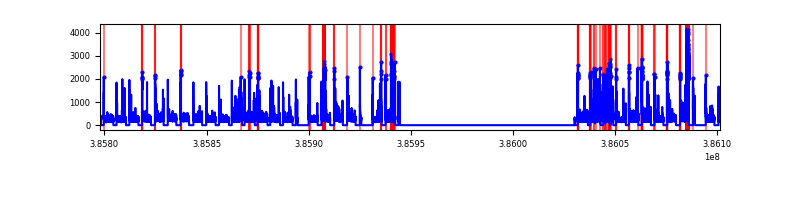 |
| D | 303443 | 207454 | 0 | 0 | 0.00% | 0.00% | 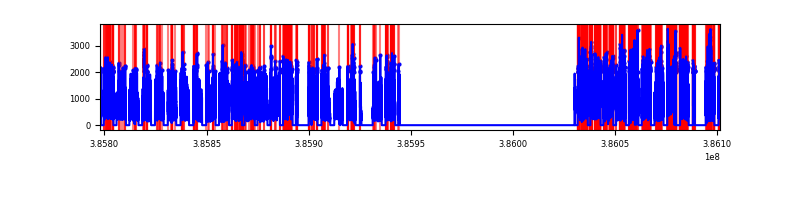 |
Top three noisy pixels from each quadrant. If the there are fewer than three noisy pixels in the level2.evt file, extra rows are filled as -1
| Pixel properties | Quadrant properties | ||||||
|---|---|---|---|---|---|---|---|
| Quadrant | DetID | PixID | Counts | Sigma | Mean | Median | Sigma |
| A | 7 | 110 | 10337 | 9.09 | 3286 | 3096 | 796.9 |
| A | 9 | 19 | 10163 | 8.87 | 3286 | 3096 | 796.9 |
| A | 0 | 29 | 9960 | 8.61 | 3286 | 3096 | 796.9 |
| B | 2 | 9 | 10304 | 11.56 | 3195 | 3062 | 626.6 |
| B | 3 | 80 | 9146 | 9.71 | 3195 | 3062 | 626.6 |
| B | 5 | 128 | 8379 | 8.49 | 3195 | 3062 | 626.6 |
| C | 1 | 81 | 10331 | 8.73 | 3299 | 3110 | 827.3 |
| C | 1 | 80 | 10179 | 8.54 | 3299 | 3110 | 827.3 |
| C | 3 | 202 | 9807 | 8.1 | 3299 | 3110 | 827.3 |
| D | 7 | 3 | 7533 | 6.38 | 2924 | 2681 | 760.3 |
| D | 10 | 189 | 7478 | 6.31 | 2924 | 2681 | 760.3 |
| D | 6 | 62 | 7364 | 6.16 | 2924 | 2681 | 760.3 |
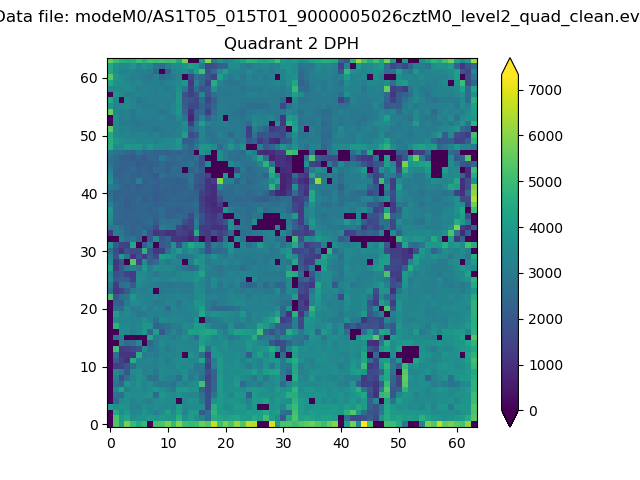
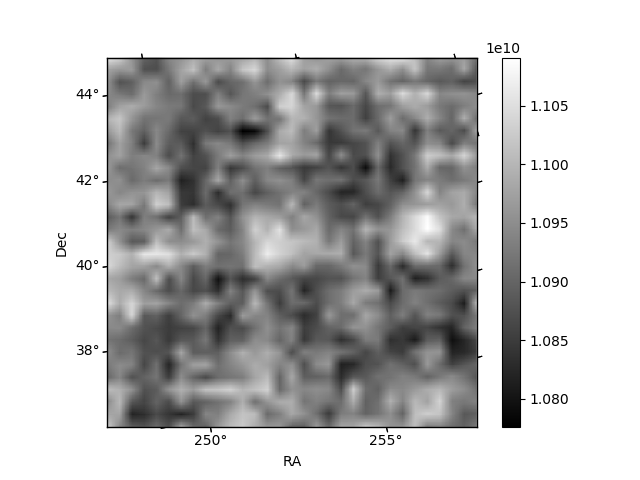
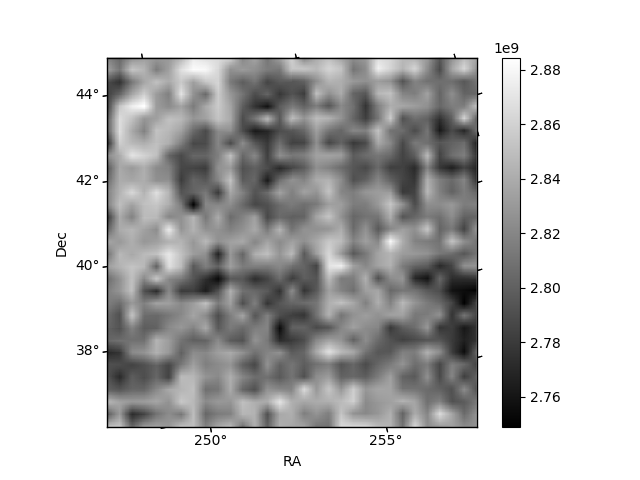
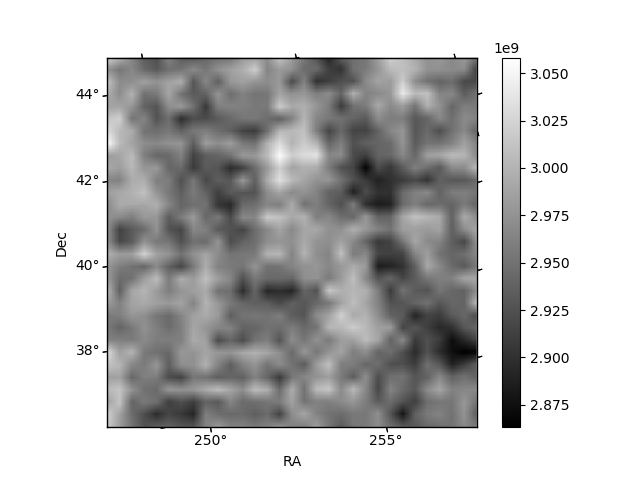
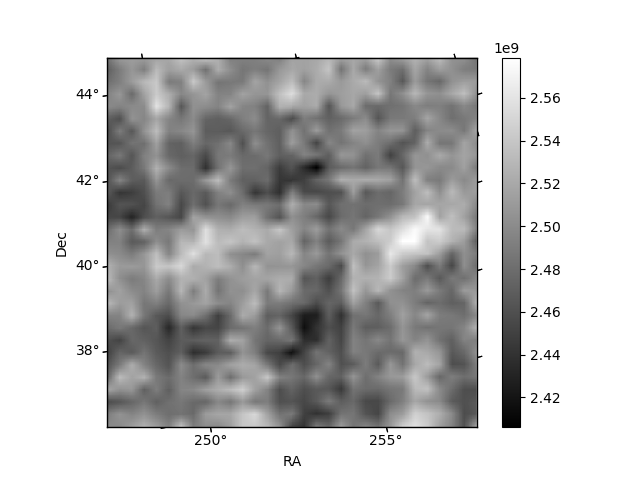
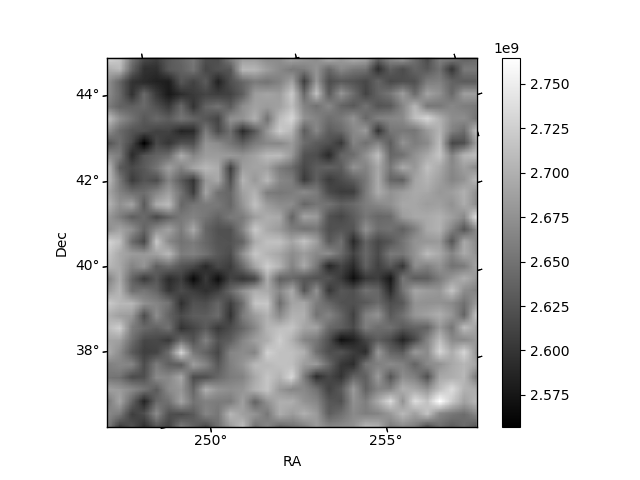
Histogram calculated using DETX and DETY for each event in the final _common_clean file
| Quadrant A | 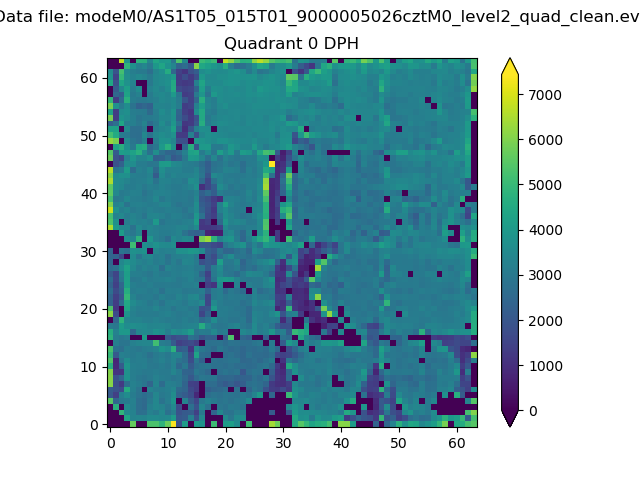 |
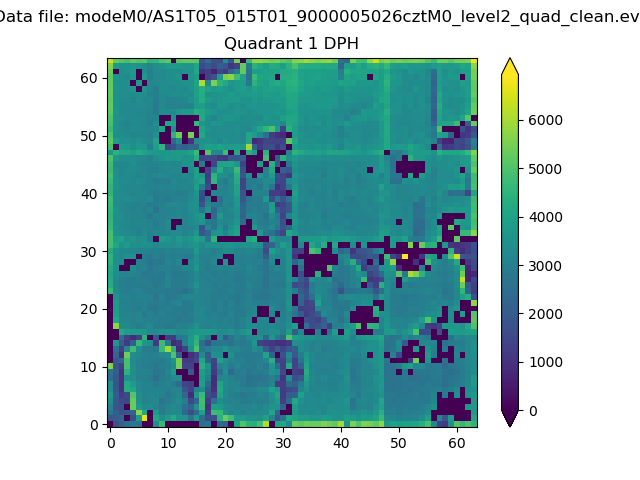 |
Quadrant B |
|---|---|---|---|
| Quadrant D | 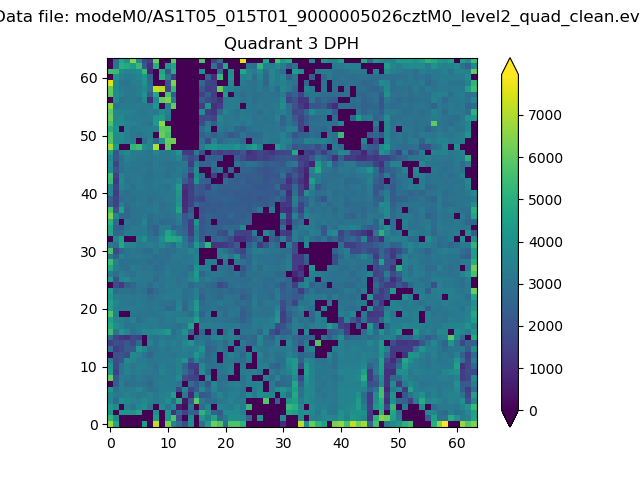 |
 |
Quadrant C |
| Plot type | Count rate plots | Images |
|---|---|---|
| Comparison with Poisson distribution Blue bars denote a histogram of data divided into 1 sec bins. Red curve is a Poisson curve with rate = median count rate of data. |
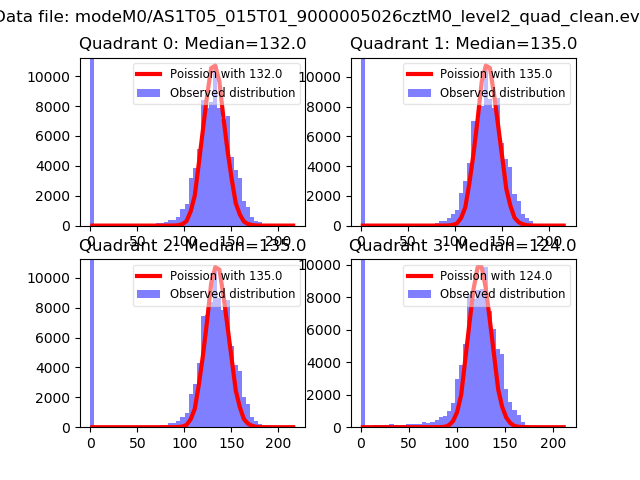 |
 |
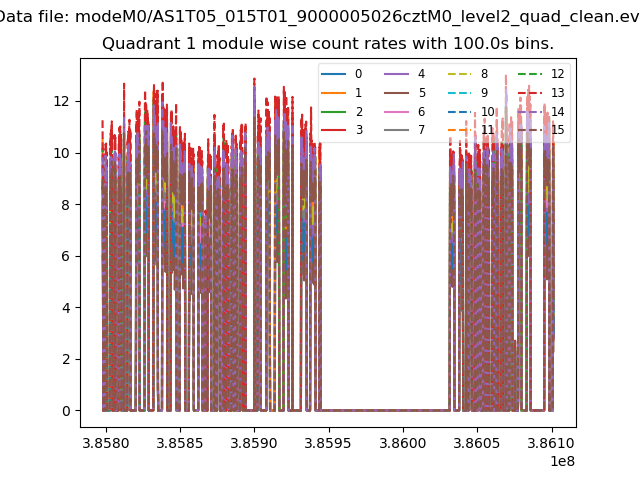
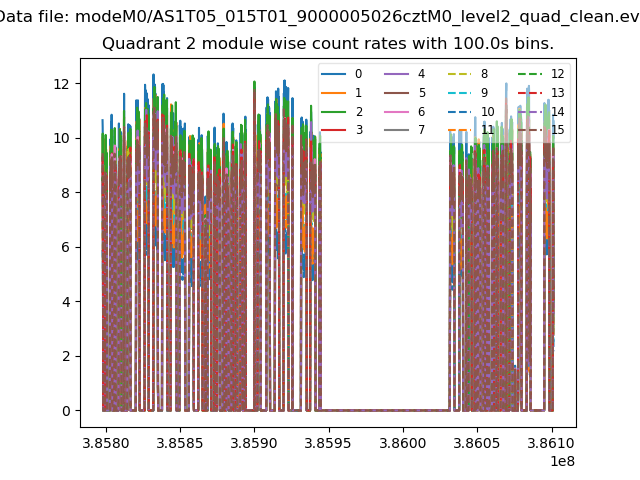
| Quadrant-wise count rates Data is divided into 100 sec bins |
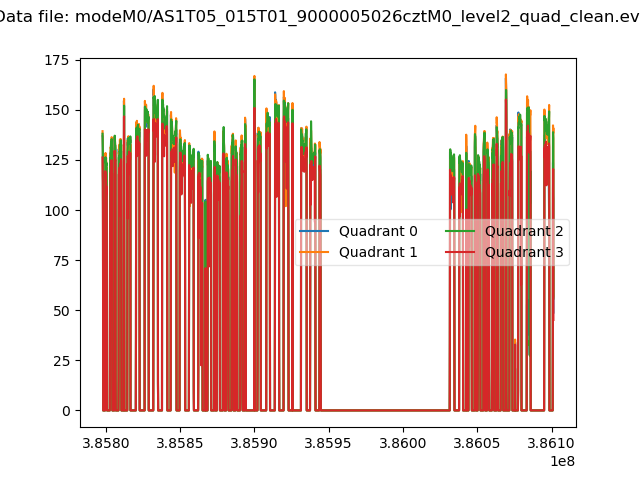 |
|
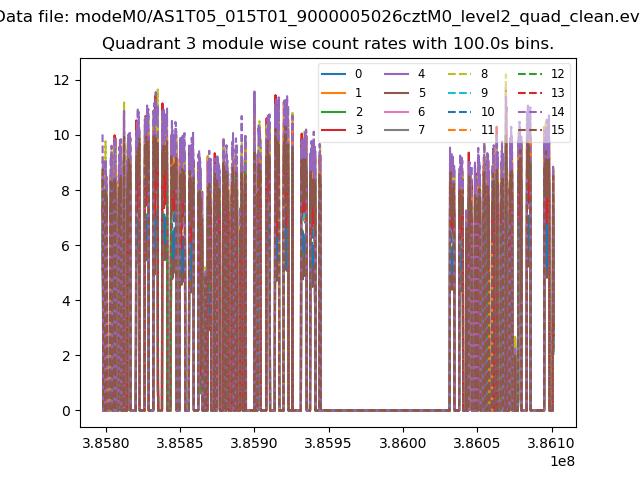
| Module-wise count rates for Quadrant A Data is divided into 100 sec bins |
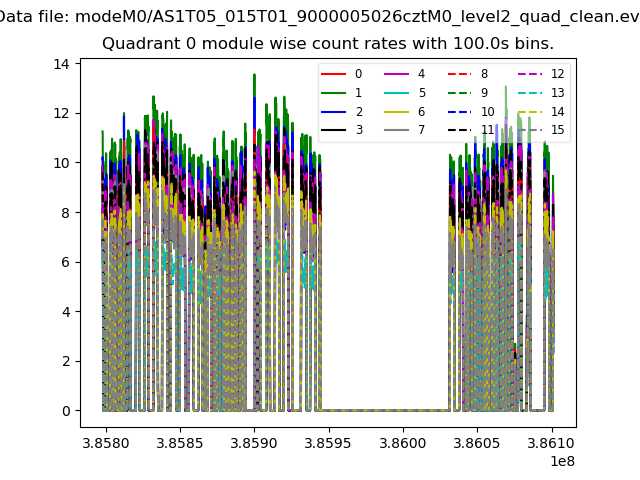 |
 |
| Module-wise count rates for Quadrant B Data is divided into 100 sec bins |
 |
 |
| Module-wise count rates for Quadrant C Data is divided into 100 sec bins |
 |
 |
| Module-wise count rates for Quadrant D Data is divided into 100 sec bins |
 |
 |
| Parameter | Plot |
|---|---|
| CZT HV Monitor | 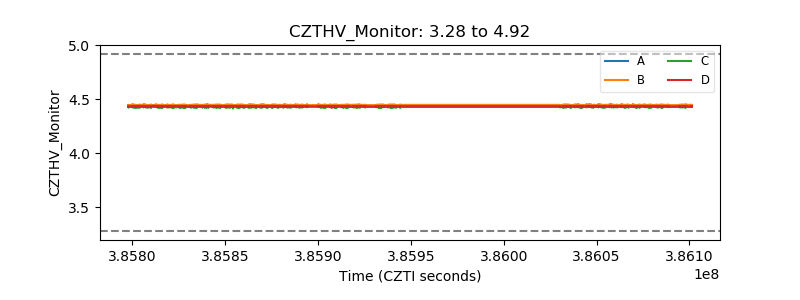 |
| D_VDD | 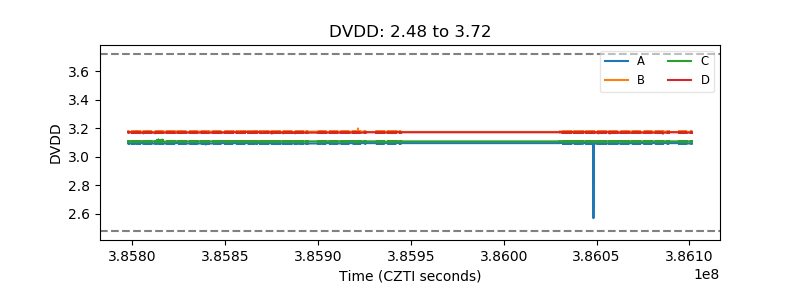 |
| Temperature 1 | 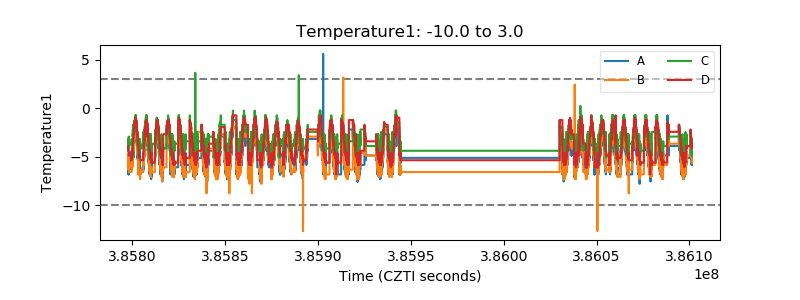 |
| Veto HV Monitor | 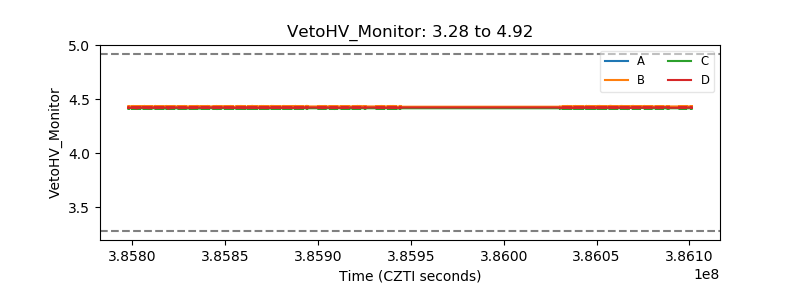 |
| Veto LLD | 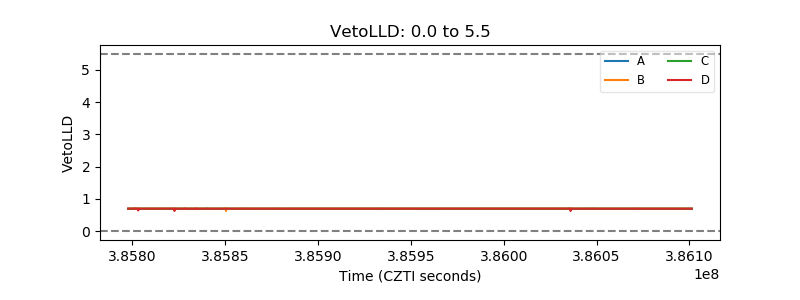 |
| Alpha Counter | 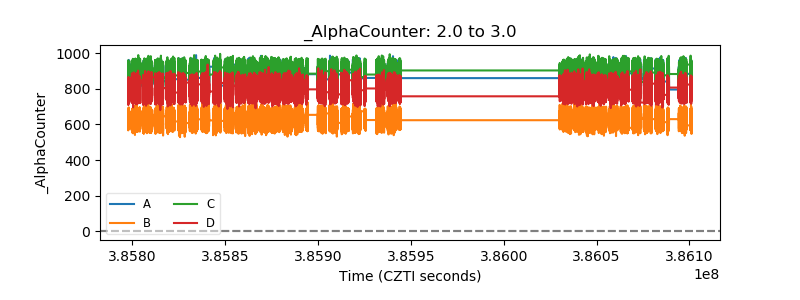 |
| _CPM_Rate | 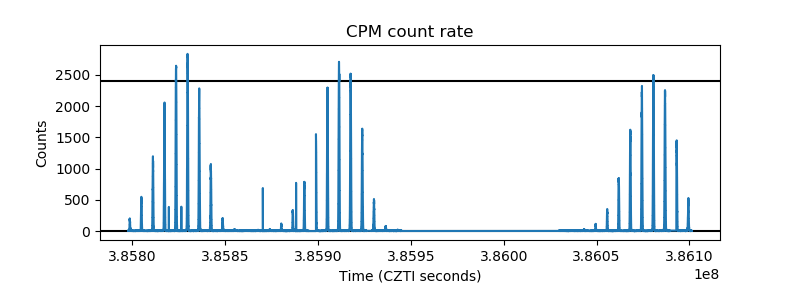 |
| CZT Counter | 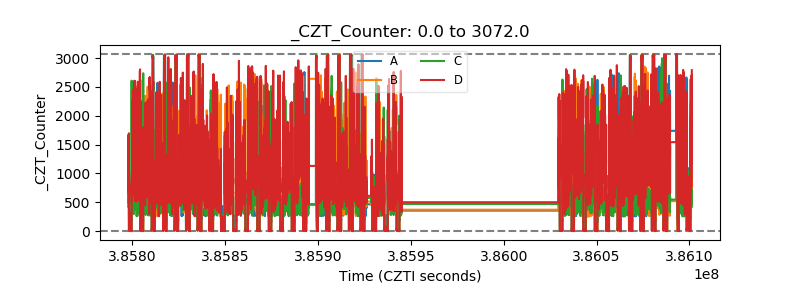 |
| +2.5 Volts monitor | 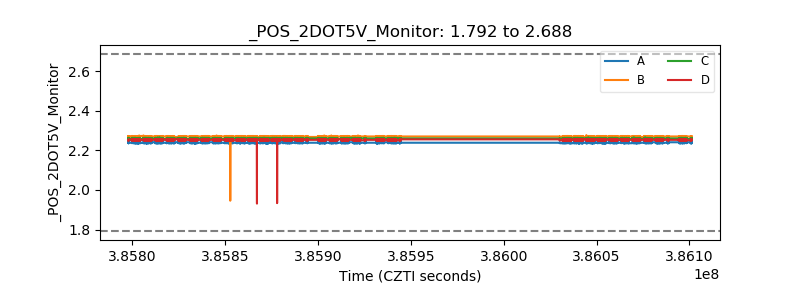 |
| +5 Volts monitor | 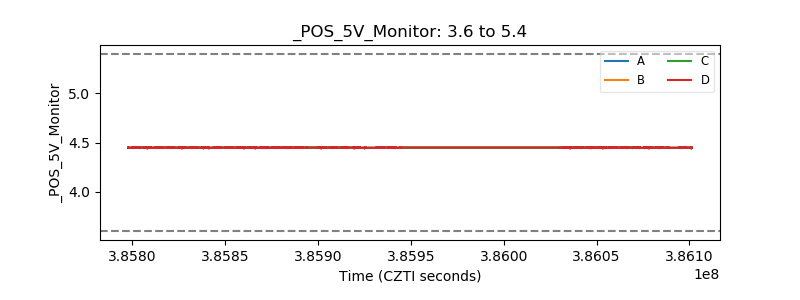 |
| _ROLL_ROT | 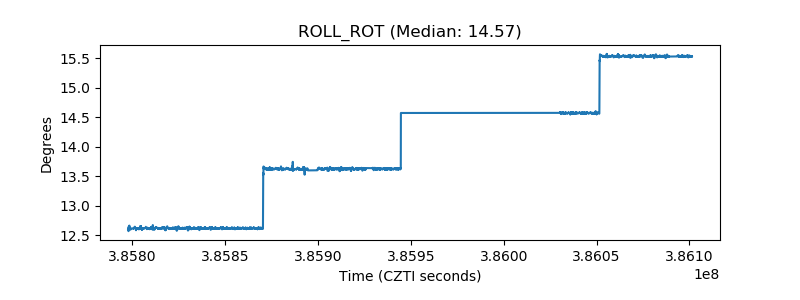 |
| _Roll_DEC | 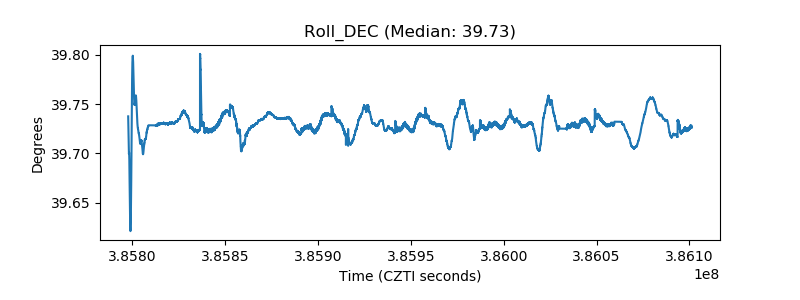 |
| _Roll_RA | 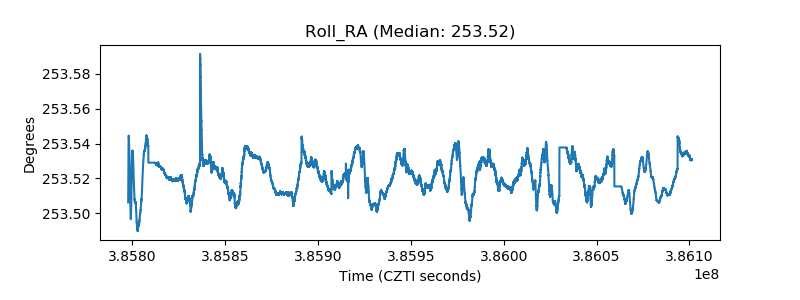 |
| Veto Counter | 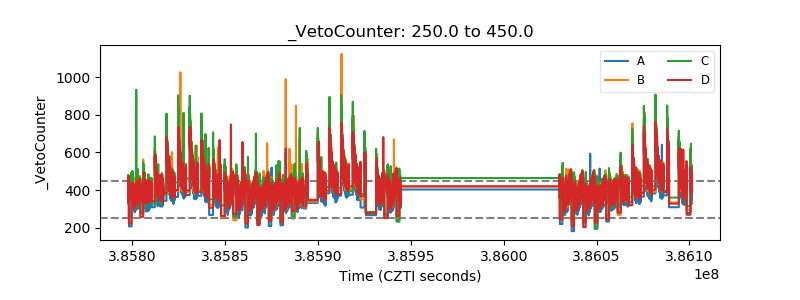 |