| Param | Original file | Final file |
|---|---|---|
| Filename | modeM0/AS1T05_015T01_9000005026_35078cztM0_level2.evt | modeM0/AS1T05_015T01_9000005026_35078cztM0_level2_quad_clean.evt |
| Size (bytes) | 500,454,720 | 77,474,880 |
| Size | 477.3 MB | 73.9 MB |
| Events in quadrant A | 2,621,996 | 492,283 |
| Events in quadrant B | 4,557,381 | 491,659 |
| Events in quadrant C | 2,806,967 | 502,728 |
| Events in quadrant D | 4,787,579 | 464,886 |
| Mode SS | |||
|---|---|---|---|
| Quadrant | BADHDUFLAG | Total packets | Discarded packets |
| A | 0 | 114 | 0 |
| B | 0 | 114 | 0 |
| C | 0 | 114 | 0 |
| D | 0 | 114 | 0 |
| Mode M9 | |||
|---|---|---|---|
| Quadrant | BADHDUFLAG | Total packets | Discarded packets |
| A | 0 | 23 | 0 |
| B | 0 | 23 | 0 |
| C | 0 | 23 | 0 |
| D | 0 | 24 | 0 |
| Mode M0 | |||
|---|---|---|---|
| Quadrant | BADHDUFLAG | Total packets | Discarded packets |
| A | 0 | 11583 | 3 |
| B | 0 | 17371 | 2 |
| C | 0 | 11719 | 2 |
| D | 0 | 18221 | 2 |
| Quadrant | Total seconds | Saturated seconds | Saturation percentage |
|---|---|---|---|
| A | 5641 | 15 | 0.265910% |
| B | 5641 | 664 | 11.770963% |
| C | 5641 | 18 | 0.319092% |
| D | 5641 | 211 | 3.740472% |
Noise dominated data is calculated using 1-second bins in cleaned event files. If a bin has >2000 counts, and if more than 50% of those come from <1% of pixels, then it is considered to be noise-dominated and hence unusable.
| Quadrant | # 1 sec bins | Bins with >0 counts | Bins with >2000 counts | High rate bins dominated by noise | Noise dominated (total time) | Noise dominated (detector-on time) | Marked lightcurve |
|---|---|---|---|---|---|---|---|
| A | 7043 | 5642 | 2 | 2 | 0.03% | 0.04% | 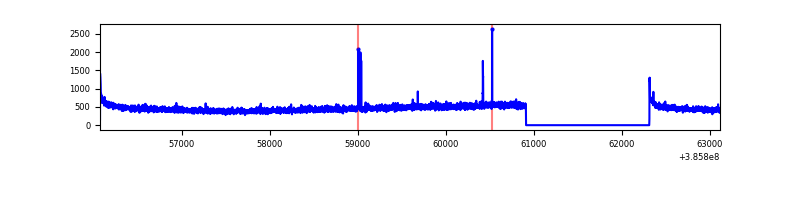 |
| B | 7043 | 5642 | 470 | 470 | 6.67% | 8.33% | 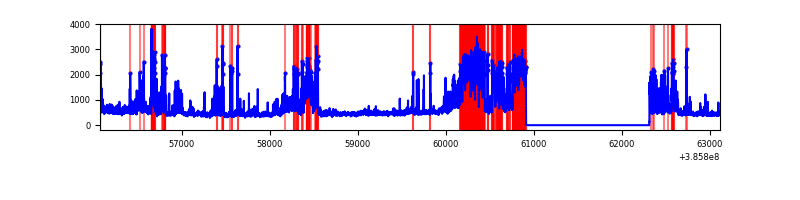 |
| C | 7043 | 5642 | 8 | 8 | 0.11% | 0.14% | 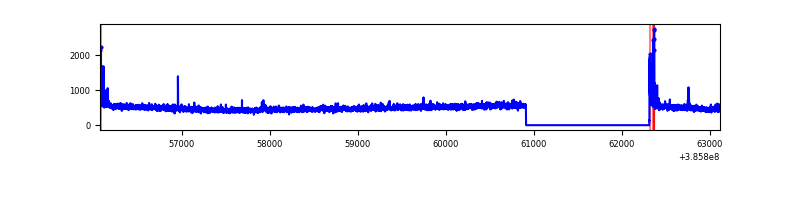 |
| D | 7043 | 5642 | 174 | 174 | 2.47% | 3.08% | 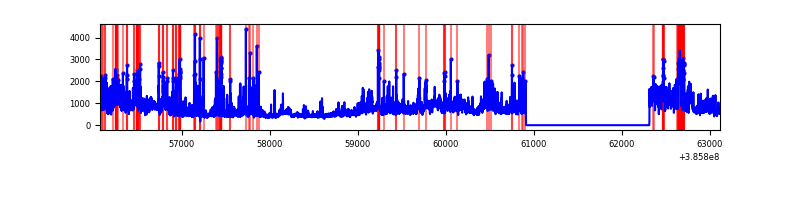 |
Top three noisy pixels from each quadrant. If the there are fewer than three noisy pixels in the level2.evt file, extra rows are filled as -1
| Pixel properties | Quadrant properties | ||||||
|---|---|---|---|---|---|---|---|
| Quadrant | DetID | PixID | Counts | Sigma | Mean | Median | Sigma |
| A | 10 | 83 | 79143 | 602.46 | 646 | 634 | 130.3 |
| A | 9 | 143 | 19285 | 143.12 | 646 | 634 | 130.3 |
| A | 13 | 6 | 18244 | 135.14 | 646 | 634 | 130.3 |
| B | 5 | 172 | 1920962 | 16280.81 | 612 | 596 | 118.0 |
| B | 0 | 189 | 136250 | 1150.07 | 612 | 596 | 118.0 |
| B | 4 | 232 | 48623 | 407.17 | 612 | 596 | 118.0 |
| C | 15 | 214 | 236366 | 1601.72 | 635 | 638 | 147.2 |
| C | 0 | 10 | 68916 | 463.93 | 635 | 638 | 147.2 |
| C | 14 | 67 | 12446 | 80.23 | 635 | 638 | 147.2 |
| D | 8 | 195 | 1526338 | 10032.19 | 621 | 605 | 152.1 |
| D | 13 | 249 | 361296 | 2371.66 | 621 | 605 | 152.1 |
| D | 2 | 250 | 212098 | 1390.64 | 621 | 605 | 152.1 |
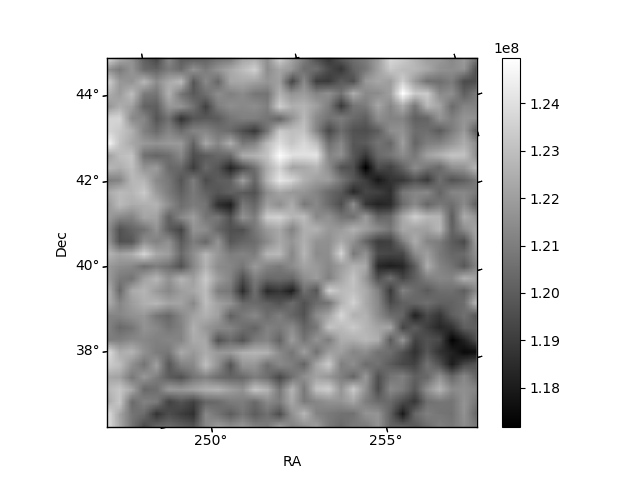
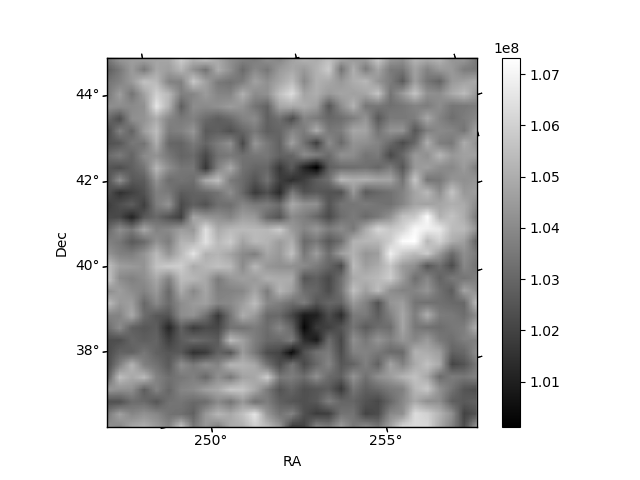
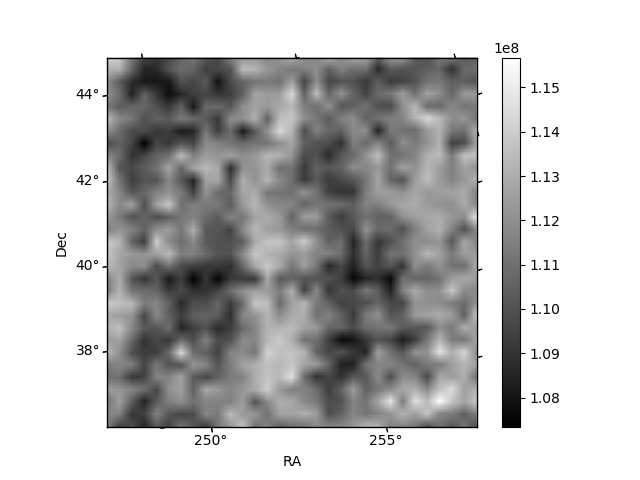
Histogram calculated using DETX and DETY for each event in the final _common_clean file
| Quadrant A | 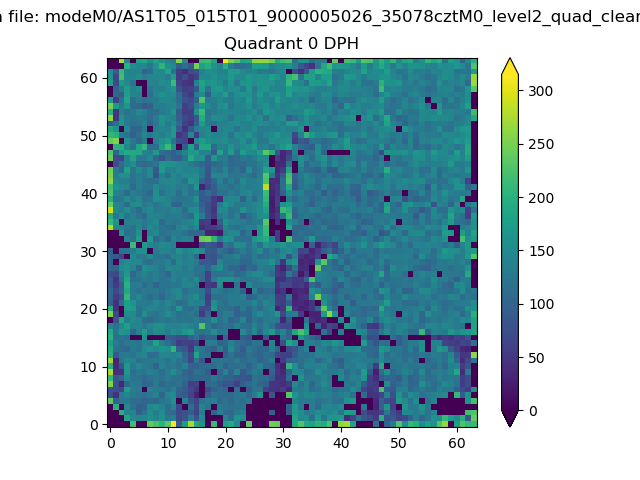 |
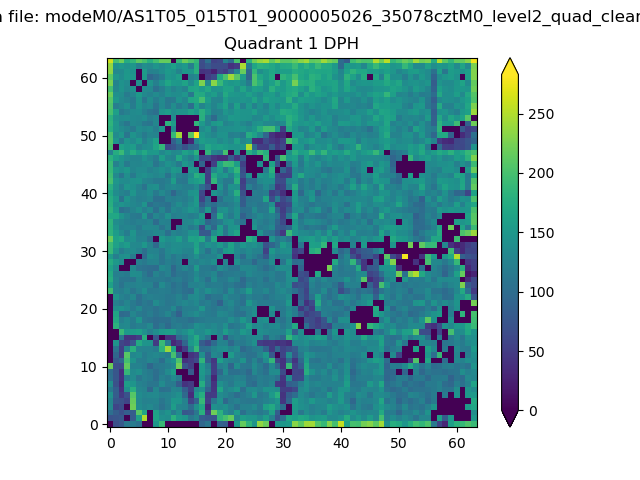 |
Quadrant B |
|---|---|---|---|
| Quadrant D | 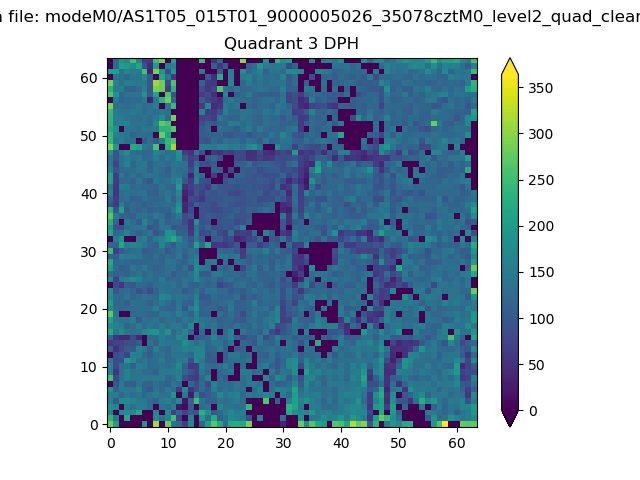 |
 |
Quadrant C |
| Plot type | Count rate plots | Images |
|---|---|---|
| Comparison with Poisson distribution Blue bars denote a histogram of data divided into 1 sec bins. Red curve is a Poisson curve with rate = median count rate of data. |
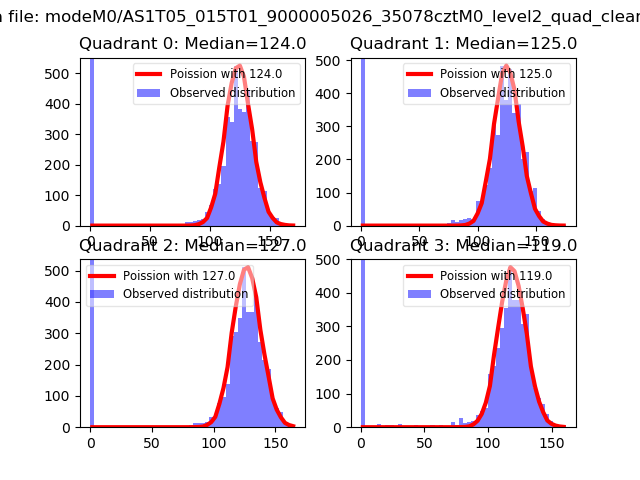 |
 |
| Quadrant-wise count rates Data is divided into 100 sec bins |
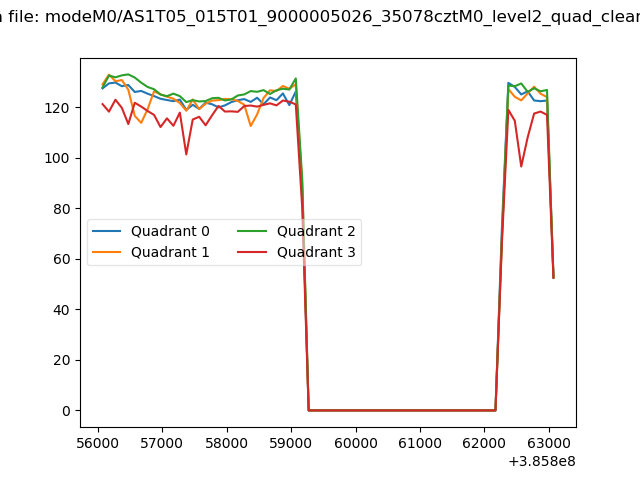 |
|
| Module-wise count rates for Quadrant A Data is divided into 100 sec bins |
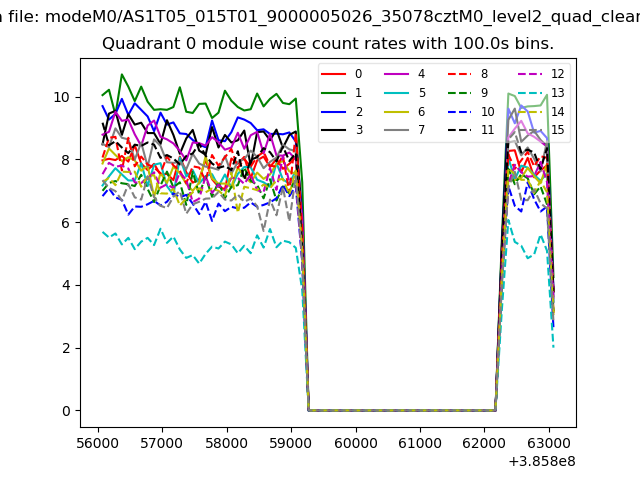 |
 |
| Module-wise count rates for Quadrant B Data is divided into 100 sec bins |
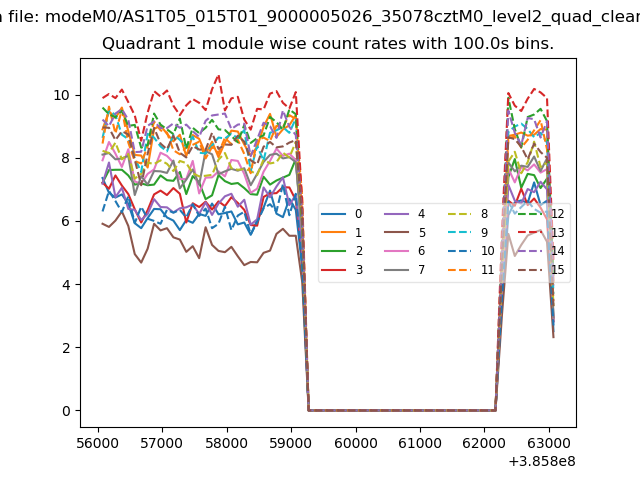 |
 |
| Module-wise count rates for Quadrant C Data is divided into 100 sec bins |
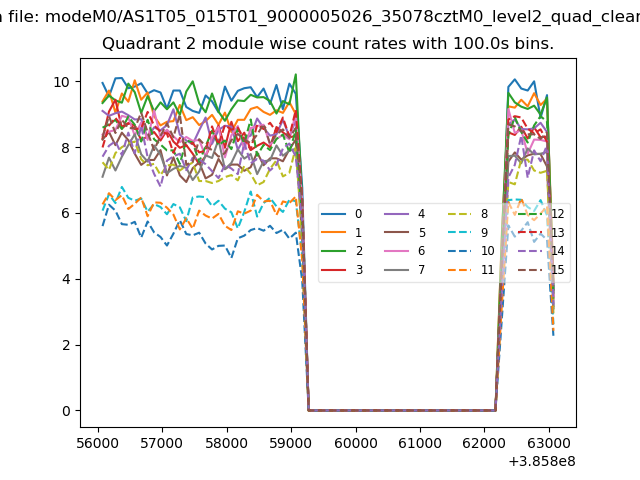 |
 |
| Module-wise count rates for Quadrant D Data is divided into 100 sec bins |
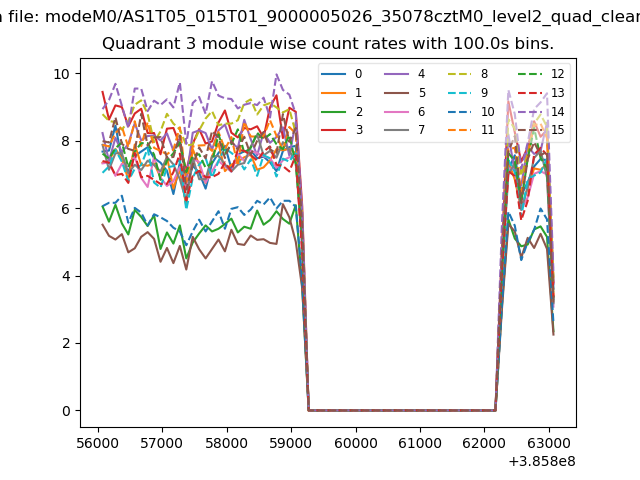 |
 |
| Parameter | Plot |
|---|---|
| CZT HV Monitor | 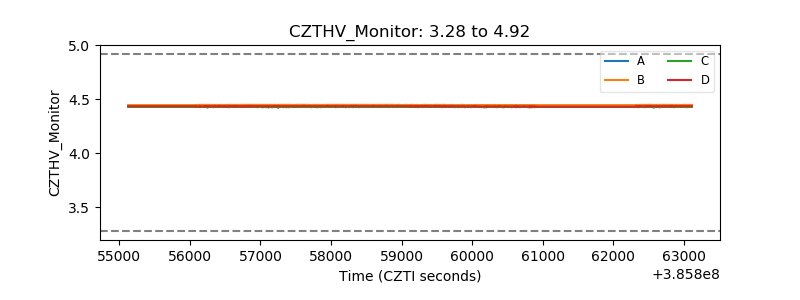 |
| D_VDD | 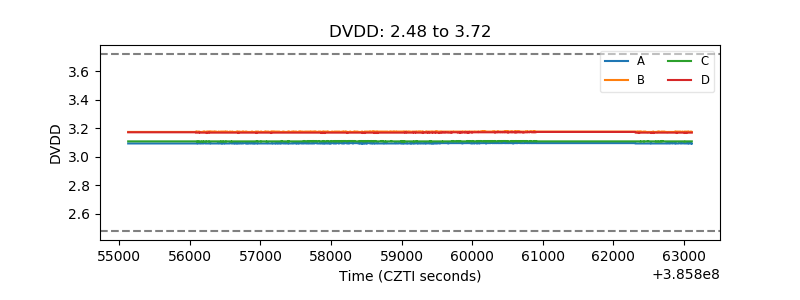 |
| Temperature 1 |  |
| Veto HV Monitor | 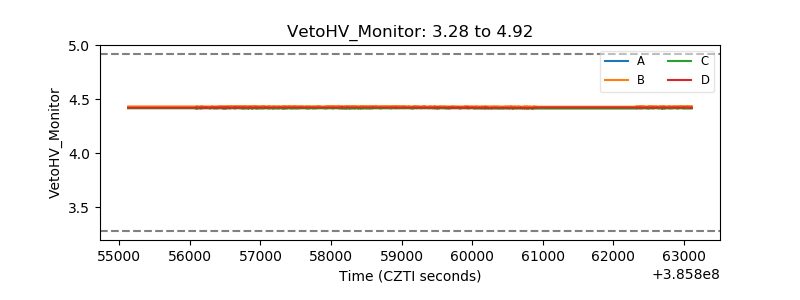 |
| Veto LLD | 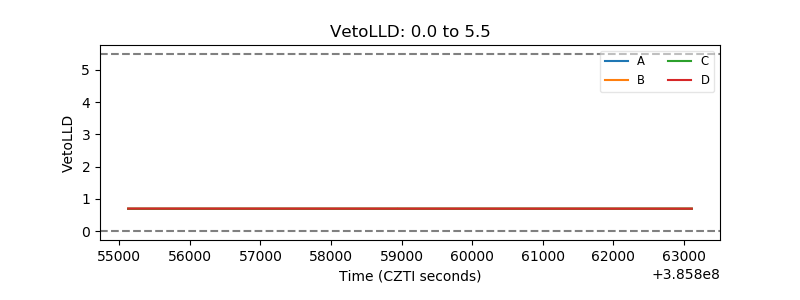 |
| Alpha Counter | 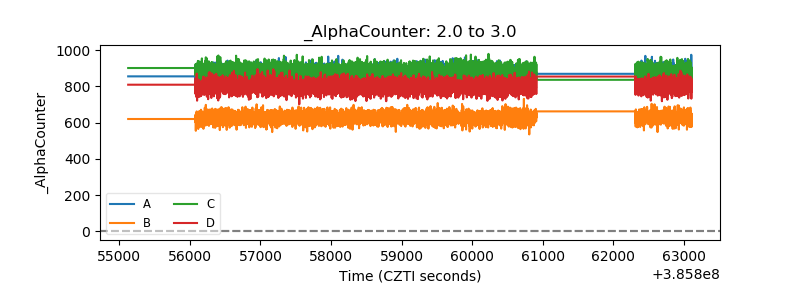 |
| _CPM_Rate | 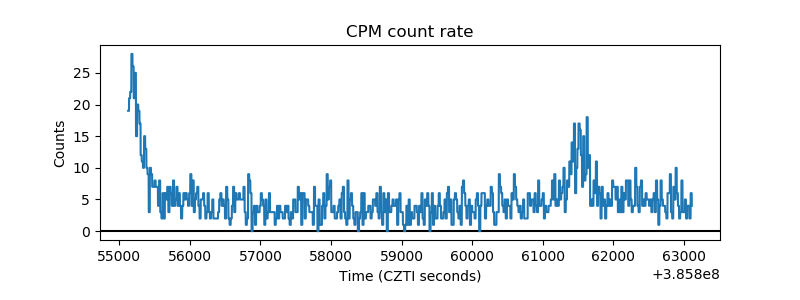 |
| CZT Counter | 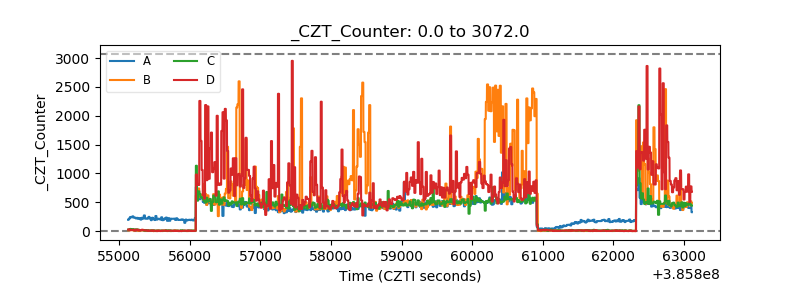 |
| +2.5 Volts monitor |  |
| +5 Volts monitor |  |
| _ROLL_ROT | 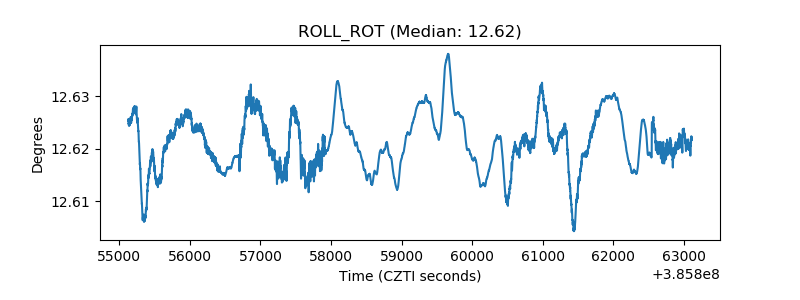 |
| _Roll_DEC | 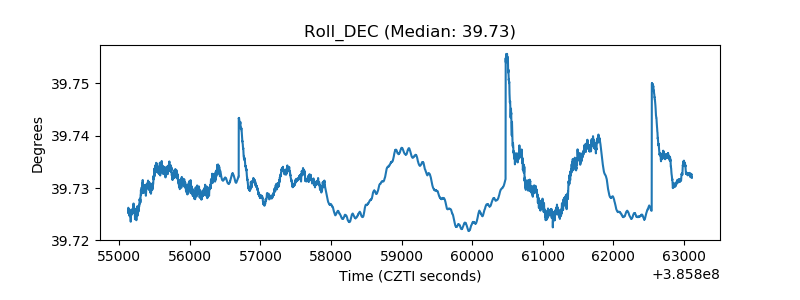 |
| _Roll_RA |  |
| Veto Counter | 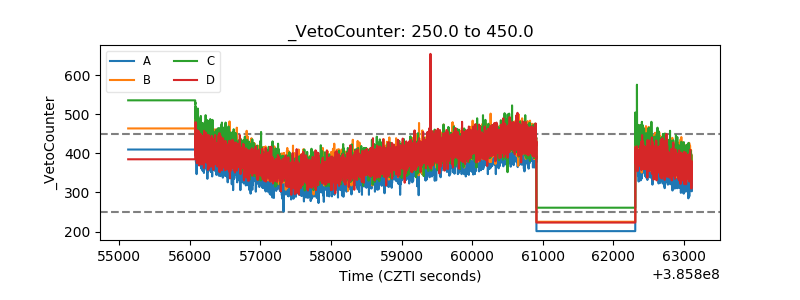 |