| Param | Original file | Final file |
|---|---|---|
| Filename | modeM0/AS1T05_015T01_9000005026_35103cztM0_level2.evt | modeM0/AS1T05_015T01_9000005026_35103cztM0_level2_quad_clean.evt |
| Size (bytes) | 580,158,720 | 67,648,320 |
| Size | 553.3 MB | 64.5 MB |
| Events in quadrant A | 2,744,788 | 435,021 |
| Events in quadrant B | 3,028,976 | 438,023 |
| Events in quadrant C | 3,522,060 | 438,411 |
| Events in quadrant D | 7,933,064 | 382,346 |
| Mode SS | |||
|---|---|---|---|
| Quadrant | BADHDUFLAG | Total packets | Discarded packets |
| A | 0 | 102 | 0 |
| B | 0 | 102 | 0 |
| C | 0 | 102 | 0 |
| D | 0 | 102 | 0 |
| Mode M9 | |||
|---|---|---|---|
| Quadrant | BADHDUFLAG | Total packets | Discarded packets |
| A | 0 | 33 | 0 |
| B | 0 | 33 | 0 |
| C | 0 | 33 | 0 |
| D | 0 | 34 | 0 |
| Mode M0 | |||
|---|---|---|---|
| Quadrant | BADHDUFLAG | Total packets | Discarded packets |
| A | 0 | 11258 | 3 |
| B | 0 | 12184 | 2 |
| C | 0 | 13629 | 2 |
| D | 0 | 27092 | 2 |
| Quadrant | Total seconds | Saturated seconds | Saturation percentage |
|---|---|---|---|
| A | 5057 | 13 | 0.257069% |
| B | 5057 | 54 | 1.067827% |
| C | 5057 | 259 | 5.121614% |
| D | 5057 | 1103 | 21.811351% |
Noise dominated data is calculated using 1-second bins in cleaned event files. If a bin has >2000 counts, and if more than 50% of those come from <1% of pixels, then it is considered to be noise-dominated and hence unusable.
| Quadrant | # 1 sec bins | Bins with >0 counts | Bins with >2000 counts | High rate bins dominated by noise | Noise dominated (total time) | Noise dominated (detector-on time) | Marked lightcurve |
|---|---|---|---|---|---|---|---|
| A | 7178 | 5058 | 1 | 1 | 0.01% | 0.02% | 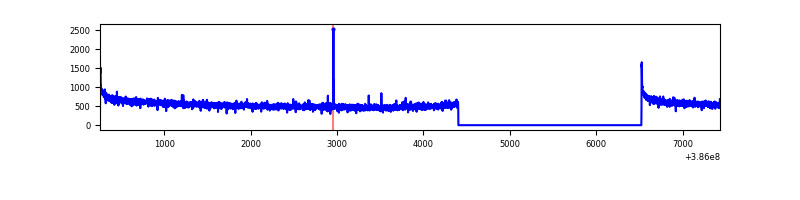 |
| B | 7178 | 5058 | 31 | 31 | 0.43% | 0.61% | 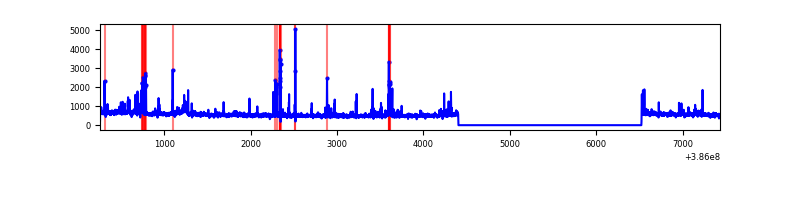 |
| C | 7178 | 5058 | 207 | 207 | 2.88% | 4.09% | 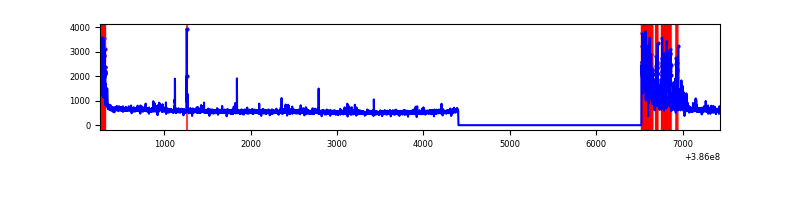 |
| D | 7178 | 5058 | 1074 | 1074 | 14.96% | 21.23% | 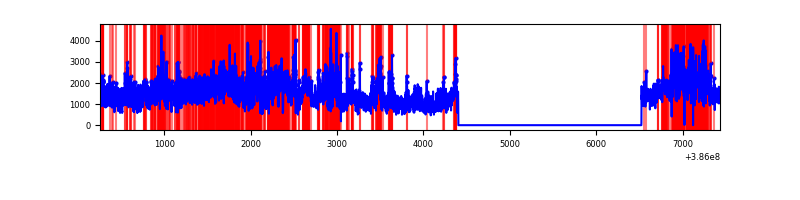 |
Top three noisy pixels from each quadrant. If the there are fewer than three noisy pixels in the level2.evt file, extra rows are filled as -1
| Pixel properties | Quadrant properties | ||||||
|---|---|---|---|---|---|---|---|
| Quadrant | DetID | PixID | Counts | Sigma | Mean | Median | Sigma |
| A | 10 | 83 | 83137 | 611.32 | 683 | 672 | 134.9 |
| A | 13 | 6 | 13726 | 96.77 | 683 | 672 | 134.9 |
| A | 13 | 254 | 9259 | 63.66 | 683 | 672 | 134.9 |
| B | 5 | 172 | 190235 | 1511.43 | 676 | 662 | 125.4 |
| B | 5 | 255 | 100680 | 797.43 | 676 | 662 | 125.4 |
| B | 15 | 85 | 45221 | 355.26 | 676 | 662 | 125.4 |
| C | 0 | 10 | 679978 | 4559.27 | 655 | 661 | 149.0 |
| C | 15 | 214 | 206815 | 1383.61 | 655 | 661 | 149.0 |
| C | 12 | 250 | 39407 | 260.05 | 655 | 661 | 149.0 |
| D | 8 | 195 | 3836124 | 25902.7 | 615 | 600 | 148.1 |
| D | 7 | 80 | 605016 | 4081.84 | 615 | 600 | 148.1 |
| D | 10 | 118 | 563109 | 3798.83 | 615 | 600 | 148.1 |
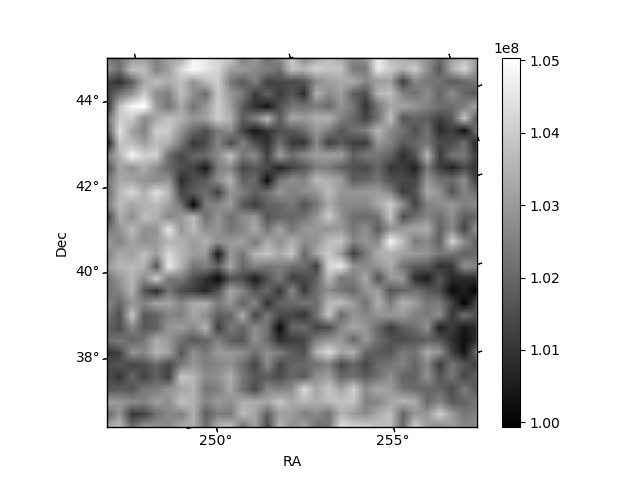
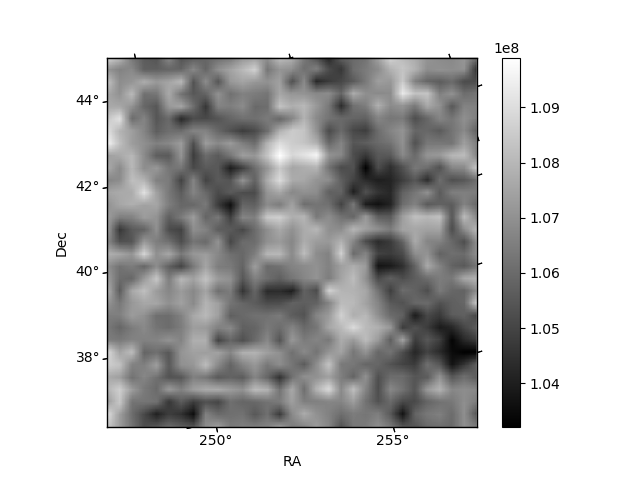
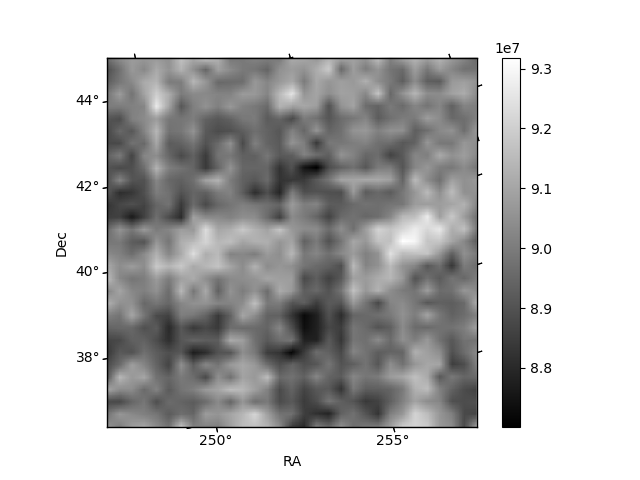
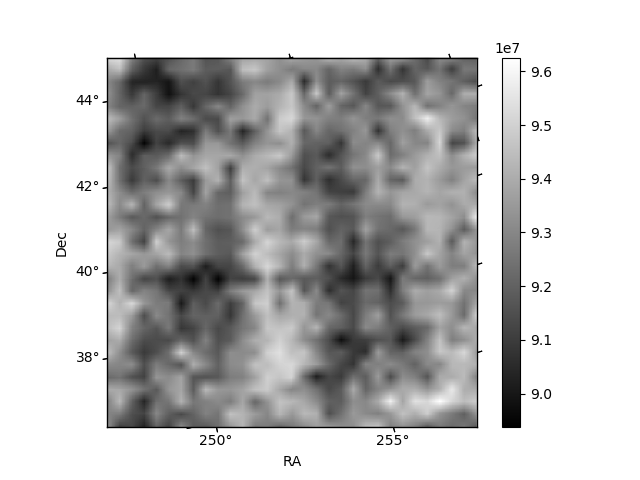
Histogram calculated using DETX and DETY for each event in the final _common_clean file
| Quadrant A |  |
 |
Quadrant B |
|---|---|---|---|
| Quadrant D | 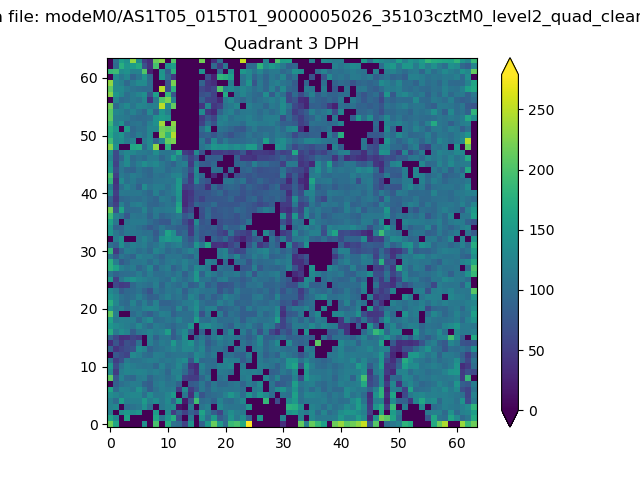 |
 |
Quadrant C |
| Plot type | Count rate plots | Images |
|---|---|---|
| Comparison with Poisson distribution Blue bars denote a histogram of data divided into 1 sec bins. Red curve is a Poisson curve with rate = median count rate of data. |
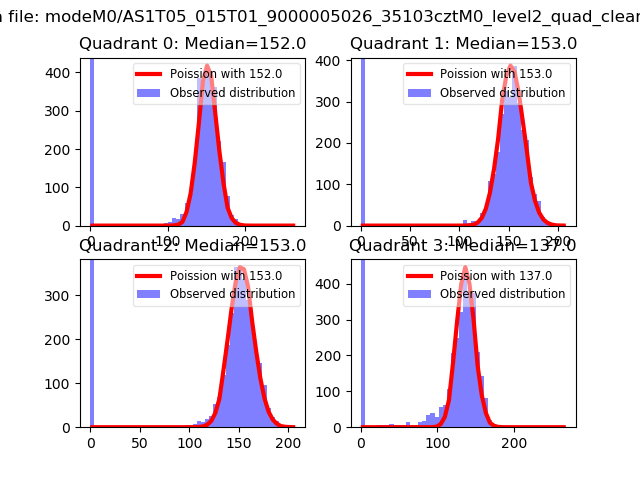 |
 |
| Quadrant-wise count rates Data is divided into 100 sec bins |
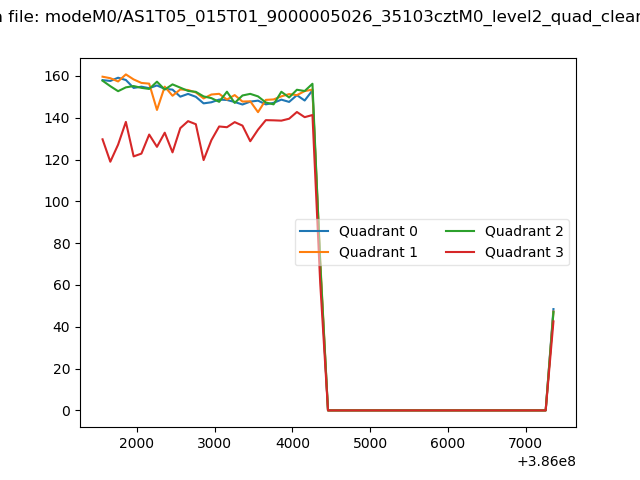 |
|
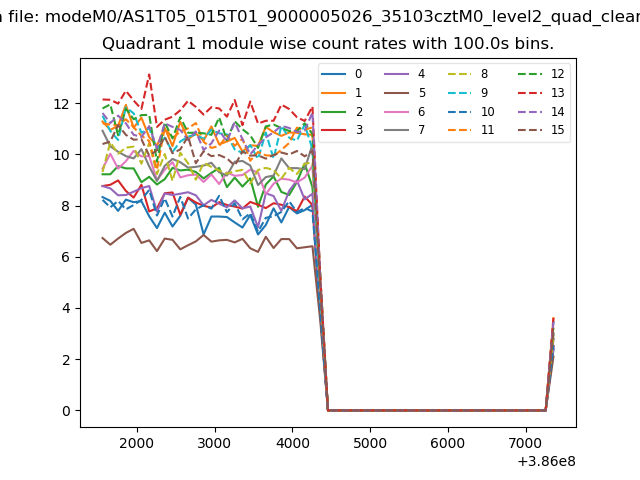
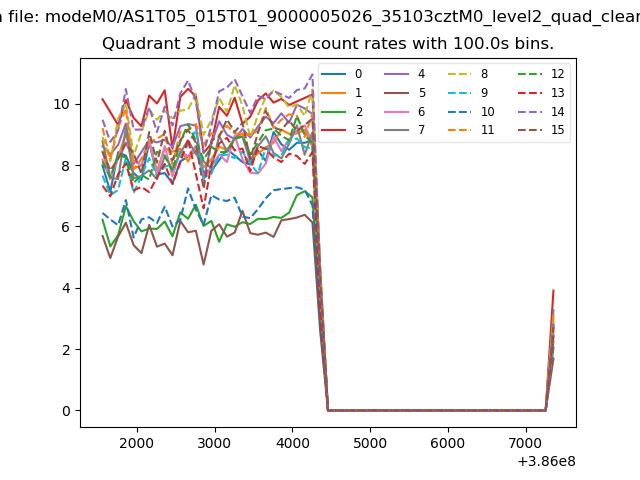
| Module-wise count rates for Quadrant A Data is divided into 100 sec bins |
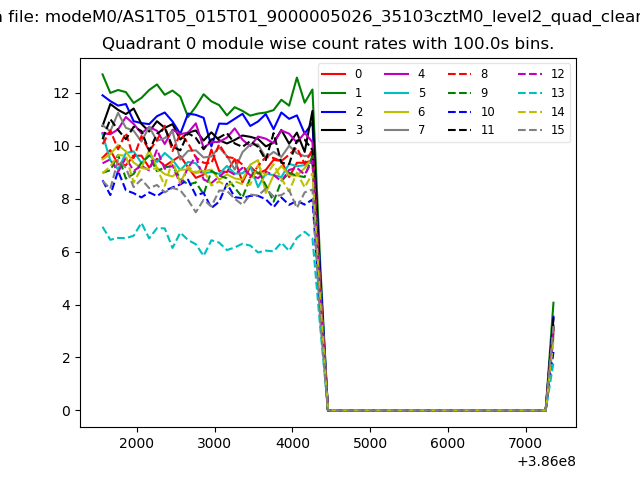 |
 |
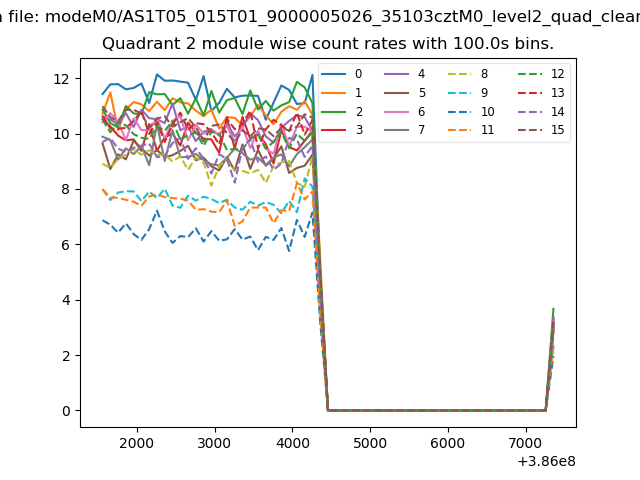
| Module-wise count rates for Quadrant B Data is divided into 100 sec bins |
 |
 |
| Module-wise count rates for Quadrant C Data is divided into 100 sec bins |
 |
 |
| Module-wise count rates for Quadrant D Data is divided into 100 sec bins |
 |
 |
| Parameter | Plot |
|---|---|
| CZT HV Monitor | 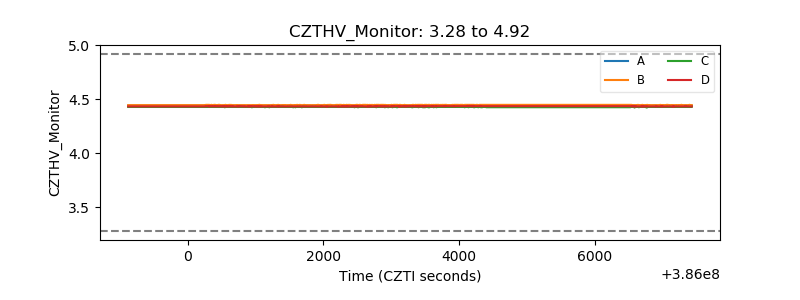 |
| D_VDD | 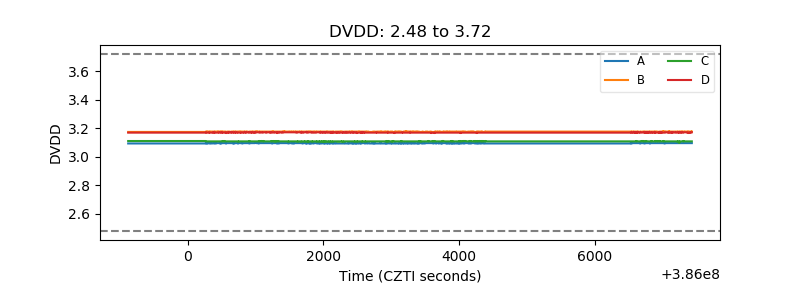 |
| Temperature 1 | 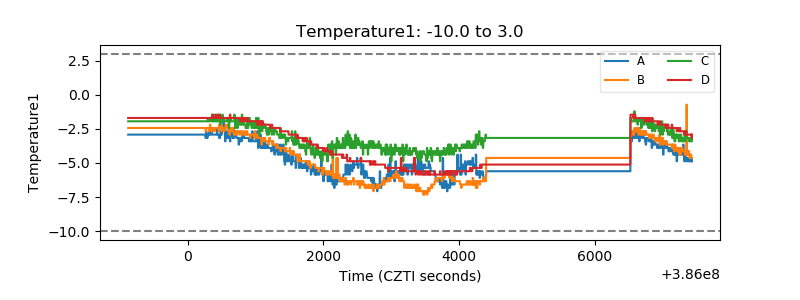 |
| Veto HV Monitor | 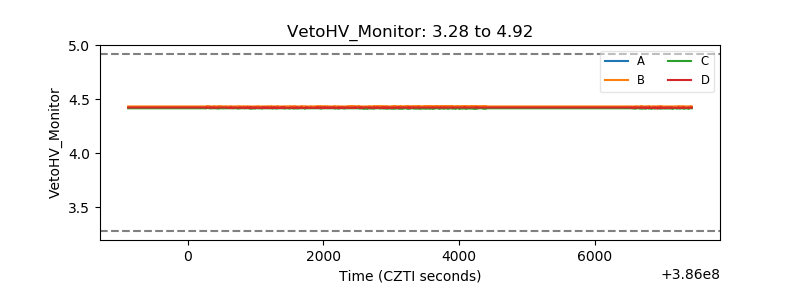 |
| Veto LLD |  |
| Alpha Counter | 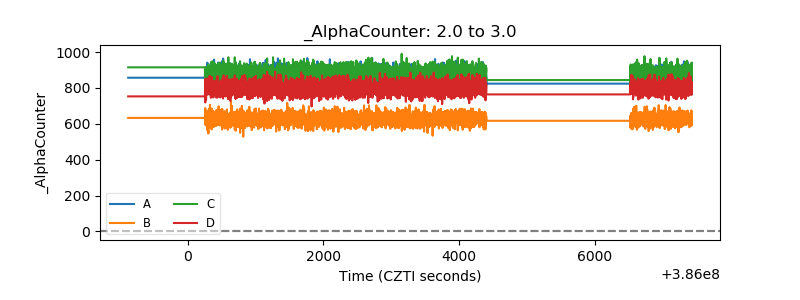 |
| _CPM_Rate | 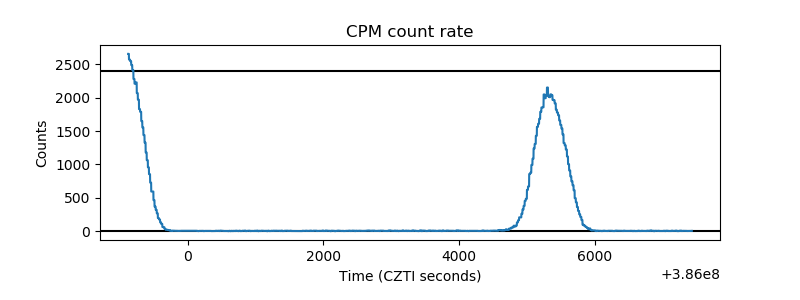 |
| CZT Counter | 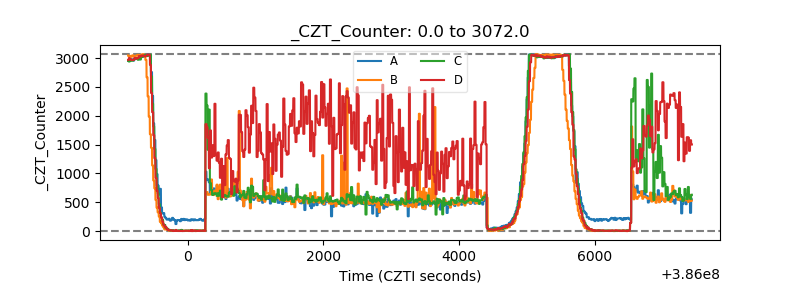 |
| +2.5 Volts monitor |  |
| +5 Volts monitor |  |
| _ROLL_ROT | 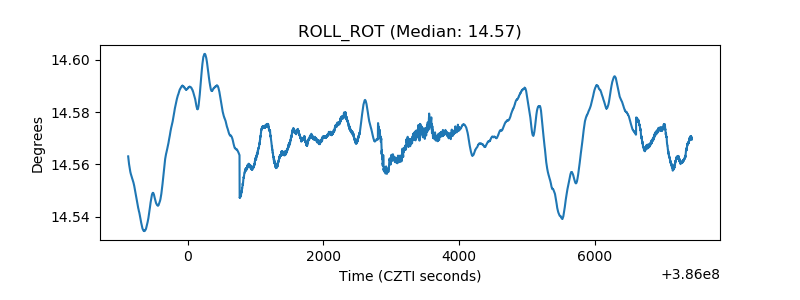 |
| _Roll_DEC | 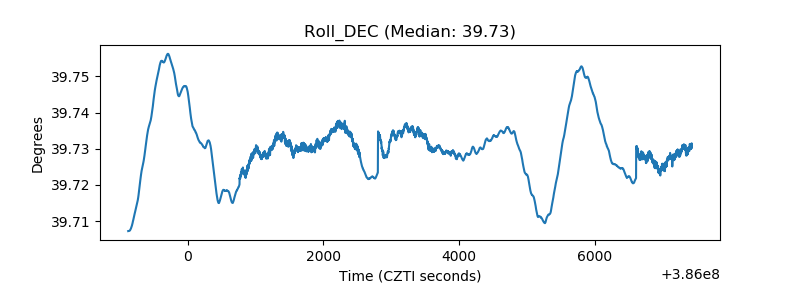 |
| _Roll_RA |  |
| Veto Counter | 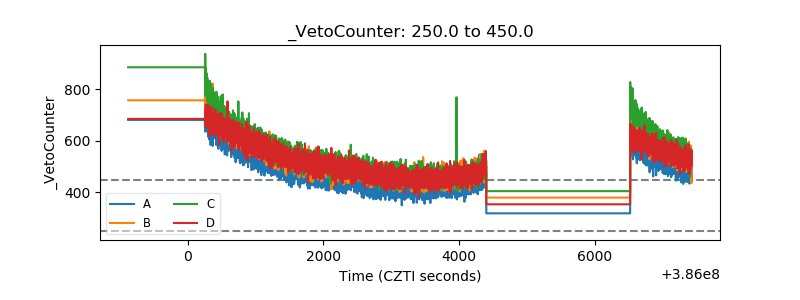 |