| Param | Original file | Final file |
|---|---|---|
| Filename | modeM0/AS1T05_015T01_9000005026_35104cztM0_level2.evt | modeM0/AS1T05_015T01_9000005026_35104cztM0_level2_quad_clean.evt |
| Size (bytes) | 484,790,400 | 79,364,160 |
| Size | 462.3 MB | 75.7 MB |
| Events in quadrant A | 2,528,921 | 520,091 |
| Events in quadrant B | 2,719,282 | 529,304 |
| Events in quadrant C | 3,314,518 | 526,551 |
| Events in quadrant D | 5,788,283 | 484,758 |
| Mode SS | |||
|---|---|---|---|
| Quadrant | BADHDUFLAG | Total packets | Discarded packets |
| A | 0 | 100 | 0 |
| B | 0 | 100 | 0 |
| C | 0 | 100 | 0 |
| D | 0 | 100 | 0 |
| Mode M9 | |||
|---|---|---|---|
| Quadrant | BADHDUFLAG | Total packets | Discarded packets |
| A | 0 | 35 | 0 |
| B | 0 | 35 | 0 |
| C | 0 | 35 | 0 |
| D | 0 | 36 | 0 |
| Mode M0 | |||
|---|---|---|---|
| Quadrant | BADHDUFLAG | Total packets | Discarded packets |
| A | 0 | 10527 | 3 |
| B | 0 | 10950 | 2 |
| C | 0 | 12797 | 2 |
| D | 0 | 20680 | 2 |
| Quadrant | Total seconds | Saturated seconds | Saturation percentage |
|---|---|---|---|
| A | 4883 | 10 | 0.204792% |
| B | 4883 | 56 | 1.146836% |
| C | 4883 | 247 | 5.058366% |
| D | 4883 | 528 | 10.813025% |
Noise dominated data is calculated using 1-second bins in cleaned event files. If a bin has >2000 counts, and if more than 50% of those come from <1% of pixels, then it is considered to be noise-dominated and hence unusable.
| Quadrant | # 1 sec bins | Bins with >0 counts | Bins with >2000 counts | High rate bins dominated by noise | Noise dominated (total time) | Noise dominated (detector-on time) | Marked lightcurve |
|---|---|---|---|---|---|---|---|
| A | 7004 | 4884 | 0 | 0 | 0.00% | 0.00% | 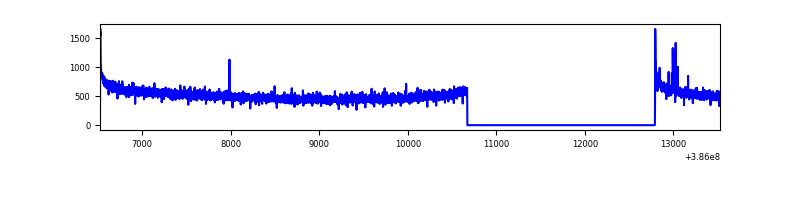 |
| B | 7004 | 4884 | 21 | 21 | 0.30% | 0.43% | 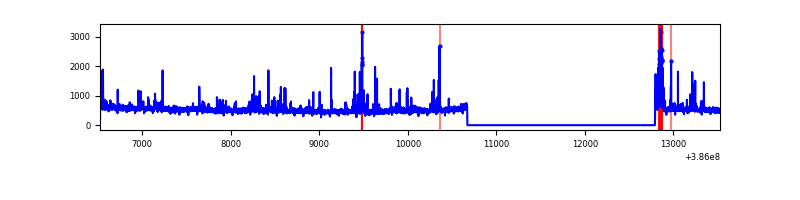 |
| C | 7004 | 4884 | 196 | 196 | 2.80% | 4.01% | 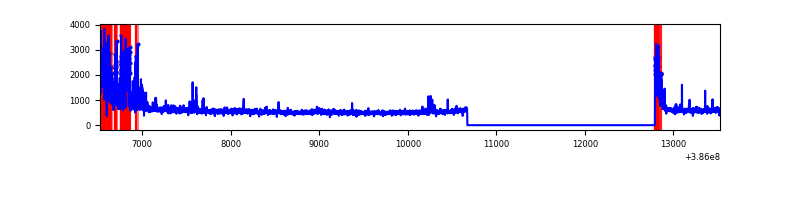 |
| D | 7004 | 4884 | 349 | 349 | 4.98% | 7.15% | 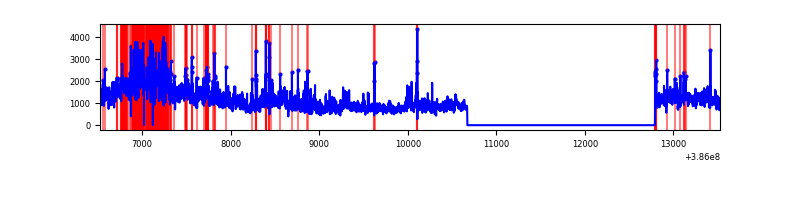 |
Top three noisy pixels from each quadrant. If the there are fewer than three noisy pixels in the level2.evt file, extra rows are filled as -1
| Pixel properties | Quadrant properties | ||||||
|---|---|---|---|---|---|---|---|
| Quadrant | DetID | PixID | Counts | Sigma | Mean | Median | Sigma |
| A | 10 | 83 | 81947 | 656.76 | 626 | 618 | 123.8 |
| A | 9 | 143 | 13216 | 101.73 | 626 | 618 | 123.8 |
| A | 13 | 6 | 11384 | 86.94 | 626 | 618 | 123.8 |
| B | 5 | 172 | 182569 | 1548.53 | 623 | 607 | 117.5 |
| B | 5 | 255 | 55150 | 464.17 | 623 | 607 | 117.5 |
| B | 4 | 232 | 16018 | 131.15 | 623 | 607 | 117.5 |
| C | 0 | 10 | 682424 | 4945.66 | 604 | 610 | 137.9 |
| C | 15 | 214 | 200868 | 1452.61 | 604 | 610 | 137.9 |
| C | 14 | 67 | 51888 | 371.95 | 604 | 610 | 137.9 |
| D | 8 | 195 | 2511749 | 17955.97 | 576 | 561 | 139.9 |
| D | 10 | 118 | 568774 | 4062.94 | 576 | 561 | 139.9 |
| D | 7 | 80 | 96317 | 684.69 | 576 | 561 | 139.9 |
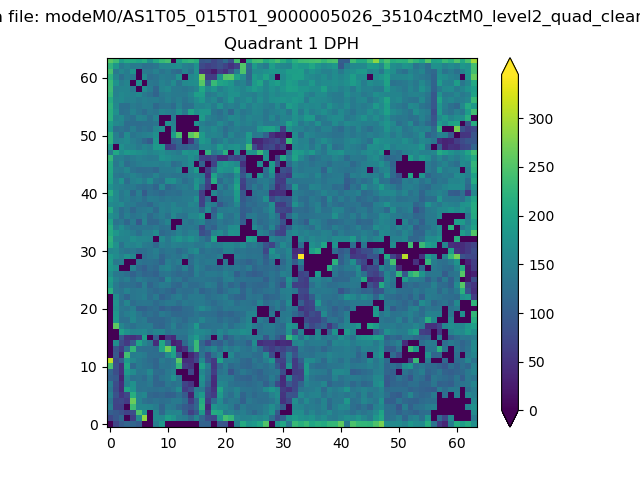
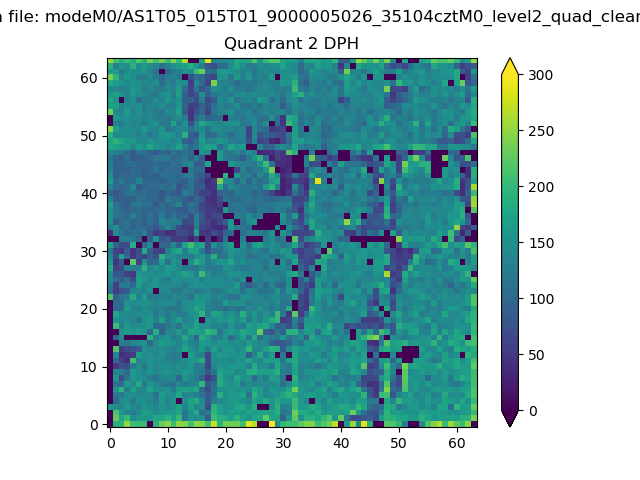
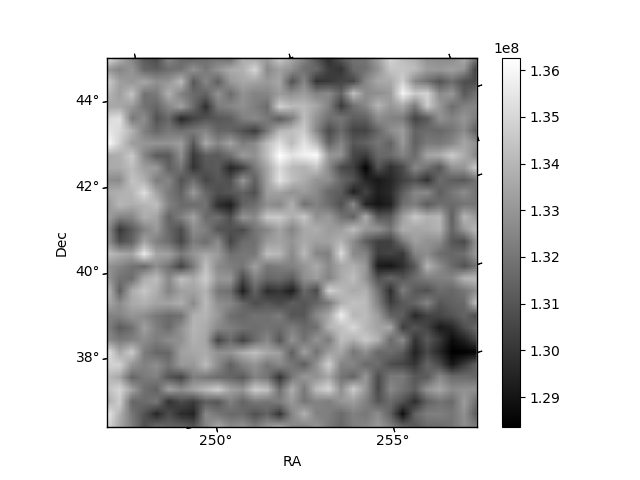
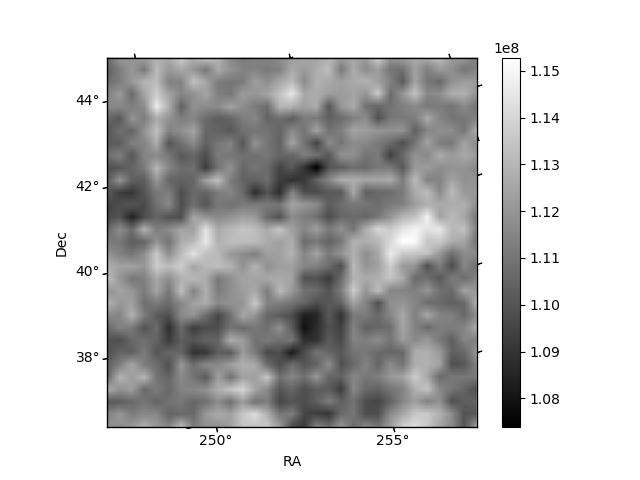
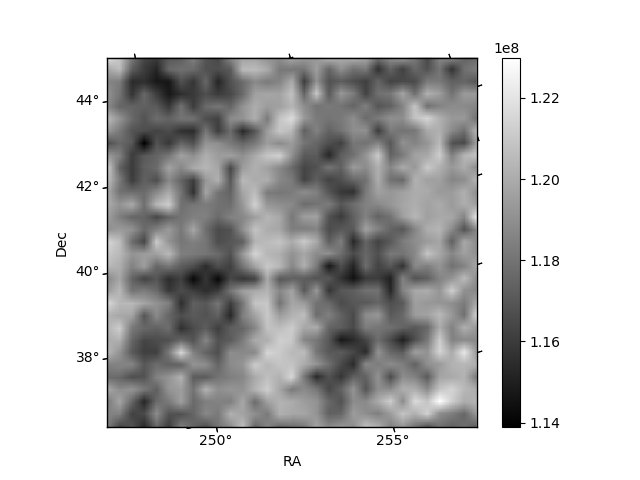
Histogram calculated using DETX and DETY for each event in the final _common_clean file
| Quadrant A |  |
 |
Quadrant B |
|---|---|---|---|
| Quadrant D |  |
 |
Quadrant C |
| Plot type | Count rate plots | Images |
|---|---|---|
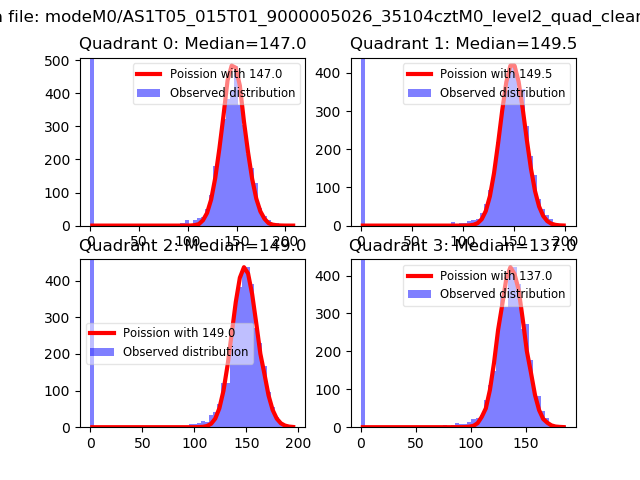
| Comparison with Poisson distribution Blue bars denote a histogram of data divided into 1 sec bins. Red curve is a Poisson curve with rate = median count rate of data. |
 |
 |
| Quadrant-wise count rates Data is divided into 100 sec bins |
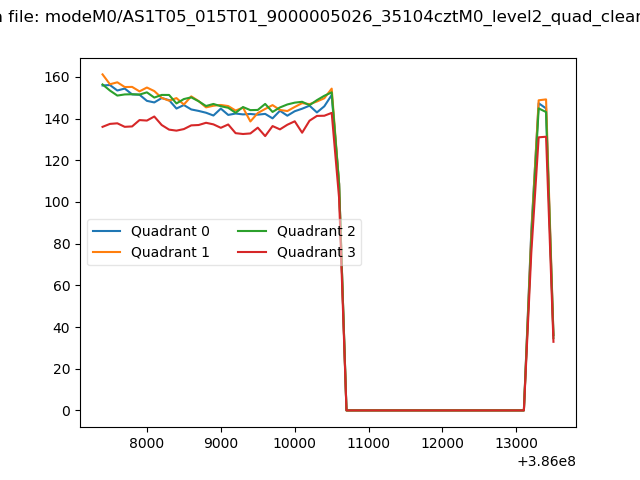 |
|
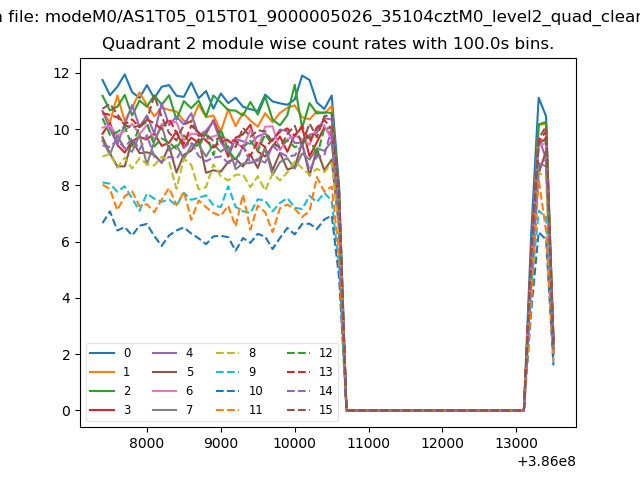
| Module-wise count rates for Quadrant A Data is divided into 100 sec bins |
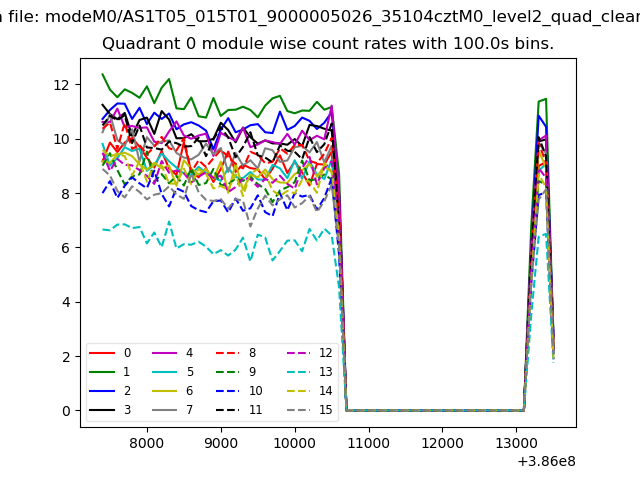 |
 |
| Module-wise count rates for Quadrant B Data is divided into 100 sec bins |
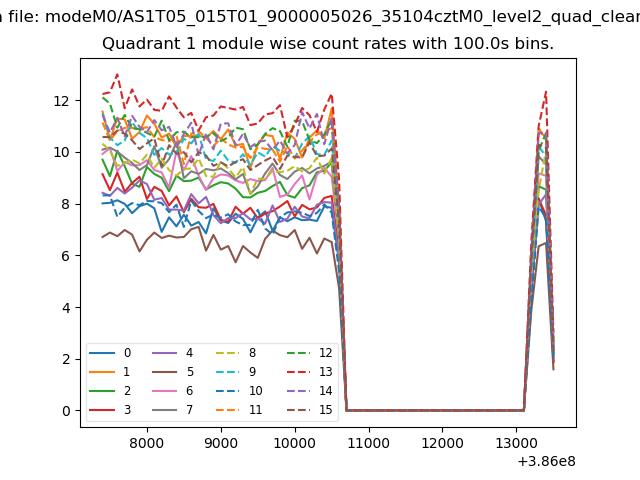 |
 |
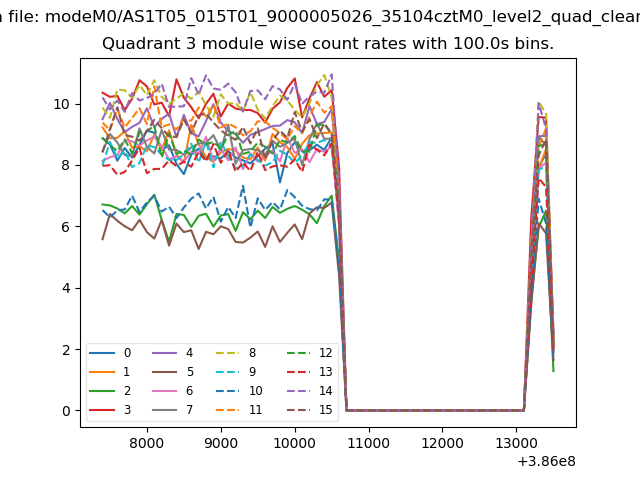
| Module-wise count rates for Quadrant C Data is divided into 100 sec bins |
 |
 |
| Module-wise count rates for Quadrant D Data is divided into 100 sec bins |
 |
 |
| Parameter | Plot |
|---|---|
| CZT HV Monitor | 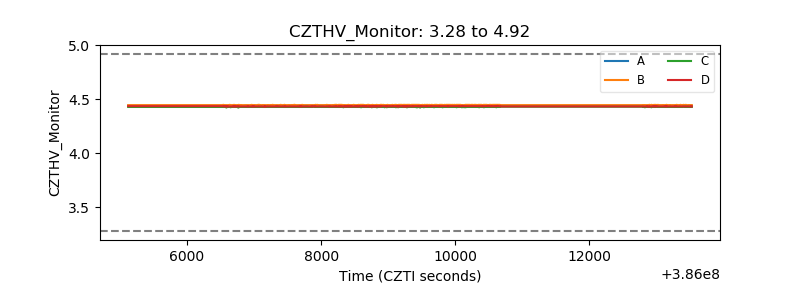 |
| D_VDD | 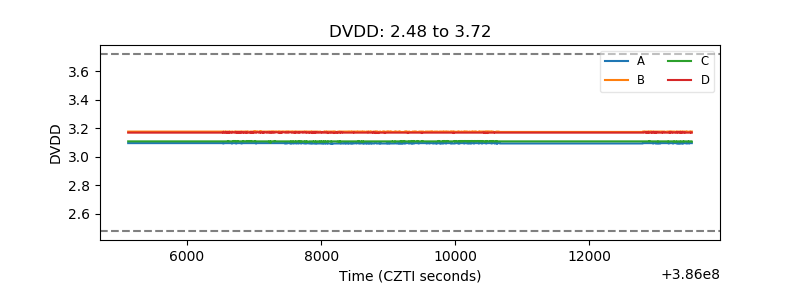 |
| Temperature 1 | 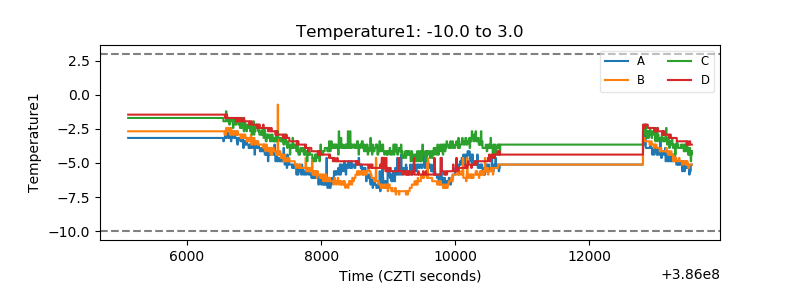 |
| Veto HV Monitor |  |
| Veto LLD | 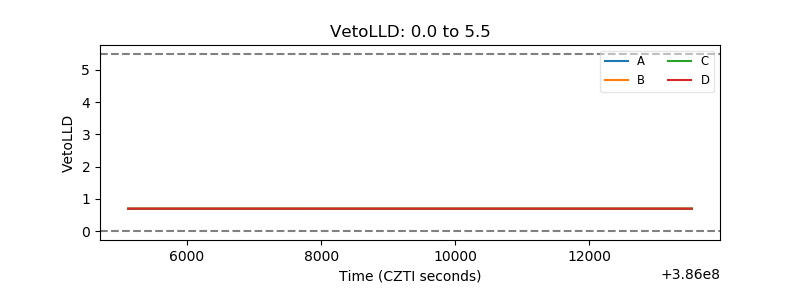 |
| Alpha Counter | 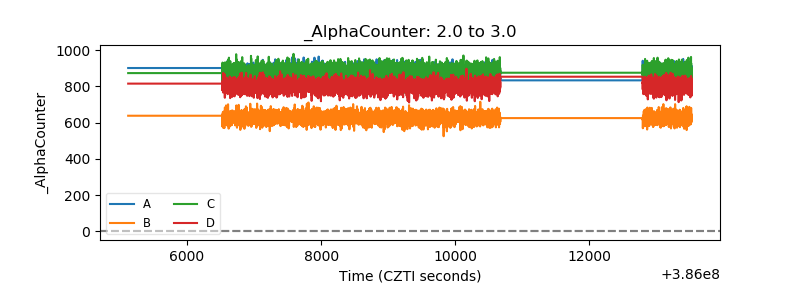 |
| _CPM_Rate | 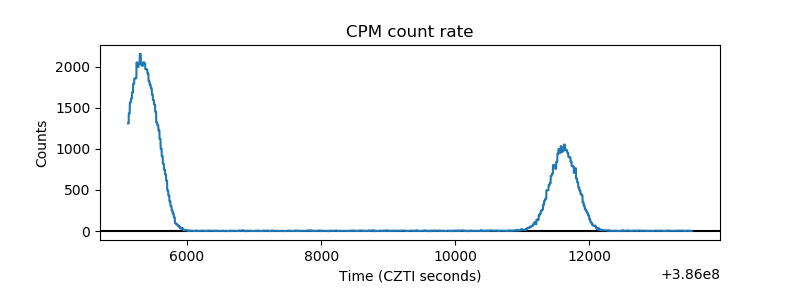 |
| CZT Counter |  |
| +2.5 Volts monitor |  |
| +5 Volts monitor |  |
| _ROLL_ROT | 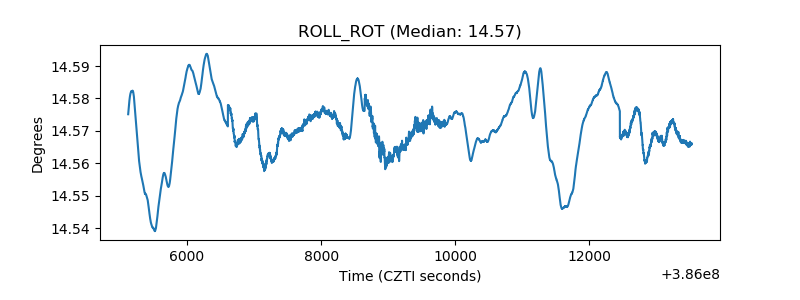 |
| _Roll_DEC | 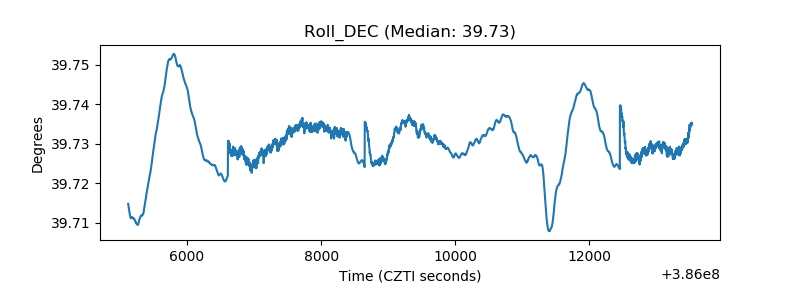 |
| _Roll_RA |  |
| Veto Counter | 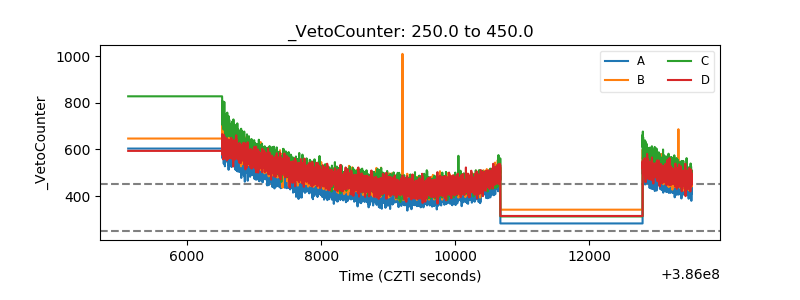 |