| Param | Original file | Final file |
|---|---|---|
| Filename | modeM0/AS1A11_047T09_9000005028cztM0_level2.fits | modeM0/AS1A11_047T09_9000005028cztM0_level2_quad_clean.evt |
| Size (bytes) | 738,944,640 | 636,816,960 |
| Size | 704.7 MB | 607.3 MB |
| Events in quadrant A | 4,033,754 | 3,103,690 |
| Events in quadrant B | 4,482,872 | 3,913,347 |
| Events in quadrant C | 4,582,210 | 3,787,913 |
| Events in quadrant D | 3,800,822 | 3,011,917 |
| Mode SS | |||
|---|---|---|---|
| Quadrant | BADHDUFLAG | Total packets | Discarded packets |
| A | 0 | 1628 | 0 |
| B | 0 | 1628 | 0 |
| C | 0 | 1628 | 0 |
| D | 0 | 1628 | 0 |
| Mode M9 | |||
|---|---|---|---|
| Quadrant | BADHDUFLAG | Total packets | Discarded packets |
| A | 0 | 283 | 0 |
| B | 0 | 283 | 0 |
| C | 0 | 283 | 0 |
| D | 0 | 284 | 0 |
| Mode M0 | |||
|---|---|---|---|
| Quadrant | BADHDUFLAG | Total packets | Discarded packets |
| A | 0 | 315253 | 0 |
| B | 0 | 194511 | 0 |
| C | 0 | 178444 | 0 |
| D | 0 | 320522 | 0 |
| Quadrant | Total seconds | Saturated seconds | Saturation percentage |
|---|---|---|---|
| A | 79709 | 20441 | 25.644532% |
| B | 79709 | 2097 | 2.630820% |
| C | 79709 | 829 | 1.040033% |
| D | 79709 | 8249 | 10.348894% |
Noise dominated data is calculated using 1-second bins in cleaned event files. If a bin has >2000 counts, and if more than 50% of those come from <1% of pixels, then it is considered to be noise-dominated and hence unusable.
| Quadrant | # 1 sec bins | Bins with >0 counts | Bins with >2000 counts | High rate bins dominated by noise | Noise dominated (total time) | Noise dominated (detector-on time) | Marked lightcurve |
|---|---|---|---|---|---|---|---|
| A | 112587 | 79483 | 0 | 0 | 0.00% | 0.00% |  |
| B | 112587 | 79704 | 0 | 0 | 0.00% | 0.00% |  |
| C | 112587 | 79704 | 0 | 0 | 0.00% | 0.00% |  |
| D | 112587 | 79588 | 0 | 0 | 0.00% | 0.00% |  |
Top three noisy pixels from each quadrant. If the there are fewer than three noisy pixels in the level2.evt file, extra rows are filled as -1
| Pixel properties | Quadrant properties | ||||||
|---|---|---|---|---|---|---|---|
| Quadrant | DetID | PixID | Counts | Sigma | Mean | Median | Sigma |
| A | 7 | 110 | 3331 | 9.09 | 1053 | 991 | 257.4 |
| A | 9 | 19 | 3250 | 8.78 | 1053 | 991 | 257.4 |
| A | 0 | 29 | 3235 | 8.72 | 1053 | 991 | 257.4 |
| B | 2 | 9 | 4010 | 12.41 | 1187 | 1135 | 231.6 |
| B | 3 | 80 | 3407 | 9.81 | 1187 | 1135 | 231.6 |
| B | 2 | 8 | 3199 | 8.91 | 1187 | 1135 | 231.6 |
| C | 1 | 81 | 3693 | 8.34 | 1212 | 1139 | 306.2 |
| C | 1 | 80 | 3559 | 7.9 | 1212 | 1139 | 306.2 |
| C | 3 | 202 | 3540 | 7.84 | 1212 | 1139 | 306.2 |
| D | 4 | 160 | 2771 | 6.17 | 1089 | 997 | 287.4 |
| D | 7 | 3 | 2754 | 6.11 | 1089 | 997 | 287.4 |
| D | 10 | 189 | 2690 | 5.89 | 1089 | 997 | 287.4 |
Histogram calculated using DETX and DETY for each event in the final _common_clean file
| Quadrant A |  |
 |
Quadrant B |
|---|---|---|---|
| Quadrant D |  |
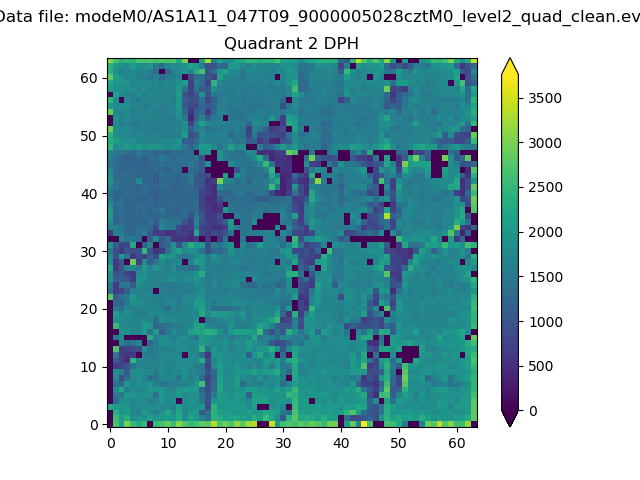 |
Quadrant C |
| Plot type | Count rate plots | Images |
|---|---|---|
| Comparison with Poisson distribution Blue bars denote a histogram of data divided into 1 sec bins. Red curve is a Poisson curve with rate = median count rate of data. |
 |
 |
| Quadrant-wise count rates Data is divided into 100 sec bins |
 |
|
| Module-wise count rates for Quadrant A Data is divided into 100 sec bins |
 |
 |
| Module-wise count rates for Quadrant B Data is divided into 100 sec bins |
 |
 |
| Module-wise count rates for Quadrant C Data is divided into 100 sec bins |
 |
 |
| Module-wise count rates for Quadrant D Data is divided into 100 sec bins |
 |
 |
| Parameter | Plot |
|---|---|
| CZT HV Monitor |  |
| D_VDD |  |
| Temperature 1 |  |
| Veto HV Monitor |  |
| Veto LLD |  |
| Alpha Counter |  |
| _CPM_Rate |  |
| CZT Counter |  |
| +2.5 Volts monitor |  |
| +5 Volts monitor |  |
| _ROLL_ROT |  |
| _Roll_DEC |  |
| _Roll_RA |  |
| Veto Counter |  |