| Param | Original file | Final file |
|---|---|---|
| Filename | modeM0/AS1A11_037T01_9000005030cztM0_level2.fits | modeM0/AS1A11_037T01_9000005030cztM0_level2_quad_clean.evt |
| Size (bytes) | 133,657,920 | 59,883,840 |
| Size | 127.5 MB | 57.1 MB |
| Events in quadrant A | 782,396 | 174,214 |
| Events in quadrant B | 807,148 | 247,399 |
| Events in quadrant C | 828,072 | 246,157 |
| Events in quadrant D | 697,014 | 211,195 |
| Mode M0 | |||
|---|---|---|---|
| Quadrant | BADHDUFLAG | Total packets | Discarded packets |
| A | 0 | 52755 | 0 |
| B | 0 | 35618 | 0 |
| C | 0 | 31279 | 0 |
| D | 0 | 55005 | 0 |
| Mode SS | |||
|---|---|---|---|
| Quadrant | BADHDUFLAG | Total packets | Discarded packets |
| A | 0 | 274 | 0 |
| B | 0 | 274 | 0 |
| C | 0 | 274 | 0 |
| D | 0 | 274 | 0 |
| Mode M9 | |||
|---|---|---|---|
| Quadrant | BADHDUFLAG | Total packets | Discarded packets |
| A | 0 | 49 | 0 |
| B | 0 | 50 | 0 |
| C | 0 | 50 | 0 |
| D | 0 | 50 | 0 |
| Quadrant | Total seconds | Saturated seconds | Saturation percentage |
|---|---|---|---|
| A | 13485 | 3078 | 22.825362% |
| B | 13485 | 614 | 4.553207% |
| C | 13485 | 202 | 1.497961% |
| D | 13485 | 873 | 6.473860% |
Noise dominated data is calculated using 1-second bins in cleaned event files. If a bin has >2000 counts, and if more than 50% of those come from <1% of pixels, then it is considered to be noise-dominated and hence unusable.
| Quadrant | # 1 sec bins | Bins with >0 counts | Bins with >2000 counts | High rate bins dominated by noise | Noise dominated (total time) | Noise dominated (detector-on time) | Marked lightcurve |
|---|---|---|---|---|---|---|---|
| A | 22428 | 13481 | 0 | 0 | 0.00% | 0.00% |  |
| B | 22427 | 13481 | 0 | 0 | 0.00% | 0.00% | 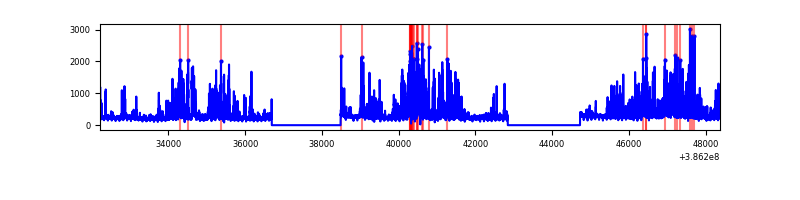 |
| C | 22427 | 13484 | 0 | 0 | 0.00% | 0.00% |  |
| D | 22427 | 13481 | 0 | 0 | 0.00% | 0.00% |  |
Top three noisy pixels from each quadrant. If the there are fewer than three noisy pixels in the level2.evt file, extra rows are filled as -1
| Pixel properties | Quadrant properties | ||||||
|---|---|---|---|---|---|---|---|
| Quadrant | DetID | PixID | Counts | Sigma | Mean | Median | Sigma |
| A | 7 | 110 | 637 | 8.97 | 204 | 194 | 49.4 |
| A | 9 | 19 | 632 | 8.87 | 204 | 194 | 49.4 |
| A | 0 | 29 | 612 | 8.47 | 204 | 194 | 49.4 |
| B | 2 | 9 | 717 | 11.84 | 214 | 206 | 43.2 |
| B | 2 | 8 | 578 | 8.62 | 214 | 206 | 43.2 |
| B | 3 | 80 | 558 | 8.16 | 214 | 206 | 43.2 |
| C | 3 | 202 | 661 | 8.01 | 218 | 207 | 56.7 |
| C | 3 | 203 | 644 | 7.71 | 218 | 207 | 56.7 |
| C | 1 | 81 | 641 | 7.66 | 218 | 207 | 56.7 |
| D | 7 | 3 | 525 | 6.36 | 199 | 183 | 53.8 |
| D | 10 | 189 | 514 | 6.16 | 199 | 183 | 53.8 |
| D | 10 | 113 | 501 | 5.91 | 199 | 183 | 53.8 |
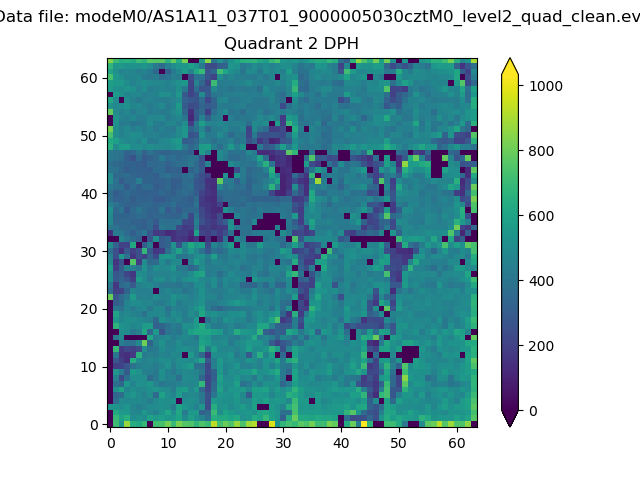
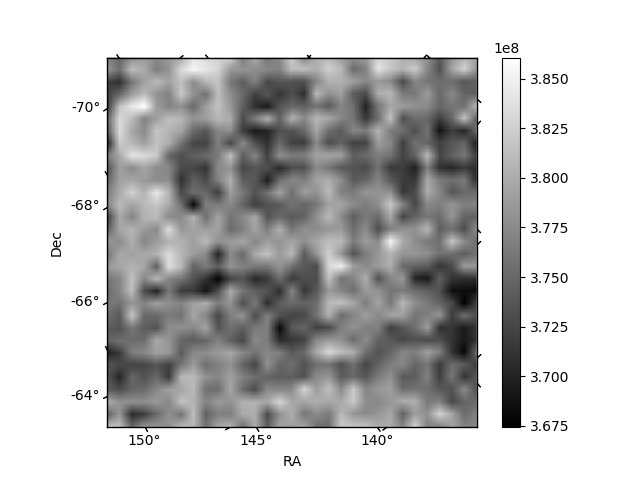
Histogram calculated using DETX and DETY for each event in the final _common_clean file
| Quadrant A |  |
 |
Quadrant B |
|---|---|---|---|
| Quadrant D | 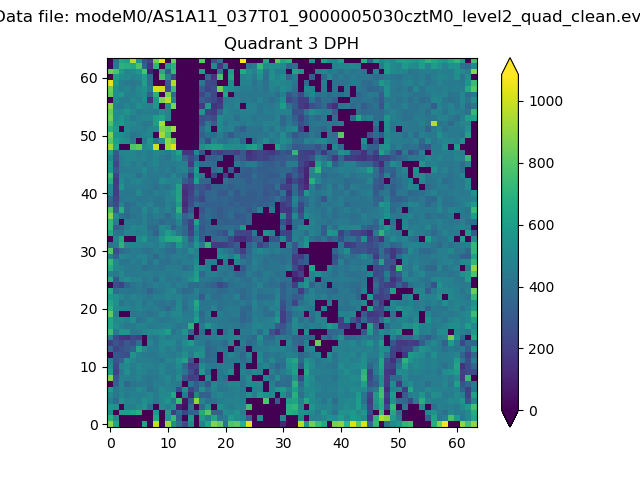 |
 |
Quadrant C |
| Plot type | Count rate plots | Images |
|---|---|---|
| Comparison with Poisson distribution Blue bars denote a histogram of data divided into 1 sec bins. Red curve is a Poisson curve with rate = median count rate of data. |
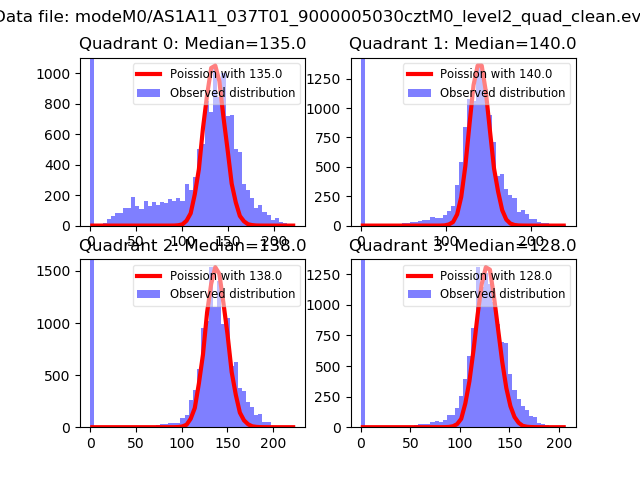 |
 |
| Quadrant-wise count rates Data is divided into 100 sec bins |
 |
|
| Module-wise count rates for Quadrant A Data is divided into 100 sec bins |
 |
 |
| Module-wise count rates for Quadrant B Data is divided into 100 sec bins |
 |
 |
| Module-wise count rates for Quadrant C Data is divided into 100 sec bins |
 |
 |
| Module-wise count rates for Quadrant D Data is divided into 100 sec bins |
 |
 |
| Parameter | Plot |
|---|---|
| CZT HV Monitor |  |
| D_VDD |  |
| Temperature 1 |  |
| Veto HV Monitor |  |
| Veto LLD |  |
| Alpha Counter |  |
| _CPM_Rate |  |
| CZT Counter |  |
| +2.5 Volts monitor | 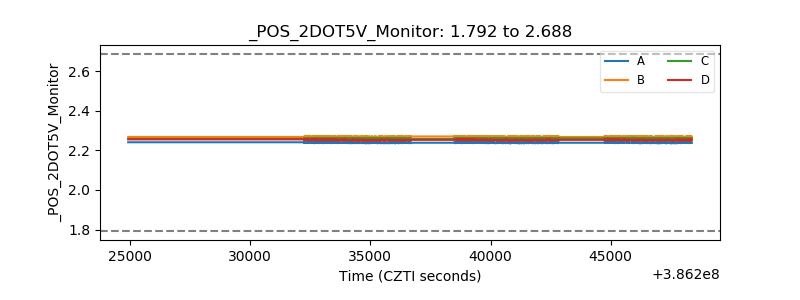 |
| +5 Volts monitor |  |
| _ROLL_ROT |  |
| _Roll_DEC |  |
| _Roll_RA | 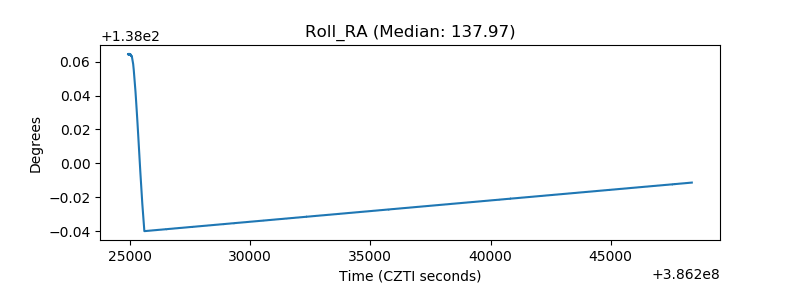 |
| Veto Counter |  |