| Param | Original file | Final file |
|---|---|---|
| Filename | modeM0/AS1A11_069T01_9000005034cztM0_level2.fits | modeM0/AS1A11_069T01_9000005034cztM0_level2_quad_clean.evt |
| Size (bytes) | 173,448,000 | 138,775,680 |
| Size | 165.4 MB | 132.3 MB |
| Events in quadrant A | 1,071,116 | 805,869 |
| Events in quadrant B | 891,070 | 573,463 |
| Events in quadrant C | 1,060,526 | 801,321 |
| Events in quadrant D | 904,752 | 698,607 |
| Mode M0 | |||
|---|---|---|---|
| Quadrant | BADHDUFLAG | Total packets | Discarded packets |
| A | 0 | 54332 | 0 |
| B | 0 | 81401 | 0 |
| C | 0 | 43661 | 0 |
| D | 0 | 65928 | 0 |
| Mode M9 | |||
|---|---|---|---|
| Quadrant | BADHDUFLAG | Total packets | Discarded packets |
| A | 0 | 59 | 0 |
| B | 0 | 59 | 0 |
| C | 0 | 59 | 0 |
| D | 0 | 59 | 0 |
| Mode SS | |||
|---|---|---|---|
| Quadrant | BADHDUFLAG | Total packets | Discarded packets |
| A | 0 | 390 | 0 |
| B | 0 | 390 | 0 |
| C | 0 | 390 | 0 |
| D | 0 | 390 | 0 |
| Quadrant | Total seconds | Saturated seconds | Saturation percentage |
|---|---|---|---|
| A | 19188 | 1345 | 7.009589% |
| B | 19188 | 5512 | 28.726287% |
| C | 19188 | 342 | 1.782364% |
| D | 19188 | 1157 | 6.029810% |
Noise dominated data is calculated using 1-second bins in cleaned event files. If a bin has >2000 counts, and if more than 50% of those come from <1% of pixels, then it is considered to be noise-dominated and hence unusable.
| Quadrant | # 1 sec bins | Bins with >0 counts | Bins with >2000 counts | High rate bins dominated by noise | Noise dominated (total time) | Noise dominated (detector-on time) | Marked lightcurve |
|---|---|---|---|---|---|---|---|
| A | 25130 | 19185 | 0 | 0 | 0.00% | 0.00% |  |
| B | 25130 | 19132 | 0 | 0 | 0.00% | 0.00% |  |
| C | 25130 | 19188 | 0 | 0 | 0.00% | 0.00% |  |
| D | 25130 | 19162 | 0 | 0 | 0.00% | 0.00% |  |
Top three noisy pixels from each quadrant. If the there are fewer than three noisy pixels in the level2.evt file, extra rows are filled as -1
| Pixel properties | Quadrant properties | ||||||
|---|---|---|---|---|---|---|---|
| Quadrant | DetID | PixID | Counts | Sigma | Mean | Median | Sigma |
| A | 7 | 110 | 909 | 9.05 | 279 | 262 | 71.5 |
| A | 0 | 29 | 866 | 8.45 | 279 | 262 | 71.5 |
| A | 9 | 19 | 860 | 8.36 | 279 | 262 | 71.5 |
| B | 2 | 9 | 812 | 12.12 | 236 | 226 | 48.4 |
| B | 3 | 80 | 700 | 9.8 | 236 | 226 | 48.4 |
| B | 2 | 8 | 670 | 9.18 | 236 | 226 | 48.4 |
| C | 1 | 80 | 857 | 8.15 | 280 | 263 | 72.9 |
| C | 1 | 81 | 829 | 7.76 | 280 | 263 | 72.9 |
| C | 1 | 65 | 745 | 6.61 | 280 | 263 | 72.9 |
| D | 1 | 3 | 670 | 6.1 | 258 | 236 | 71.1 |
| D | 6 | 62 | 669 | 6.09 | 258 | 236 | 71.1 |
| D | 6 | 231 | 661 | 5.98 | 258 | 236 | 71.1 |
Histogram calculated using DETX and DETY for each event in the final _common_clean file
| Quadrant A |  |
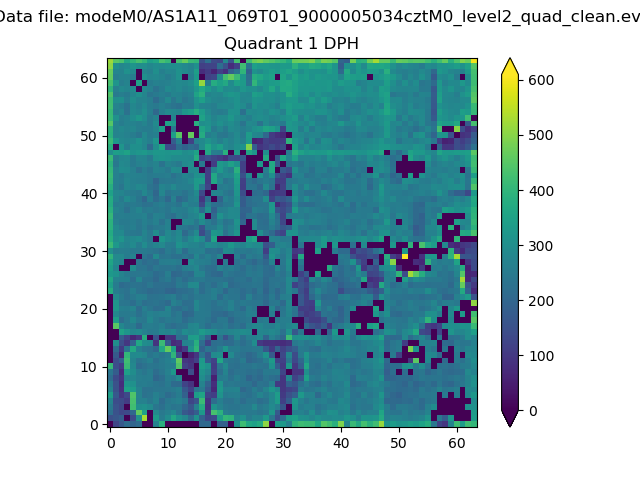 |
Quadrant B |
|---|---|---|---|
| Quadrant D |  |
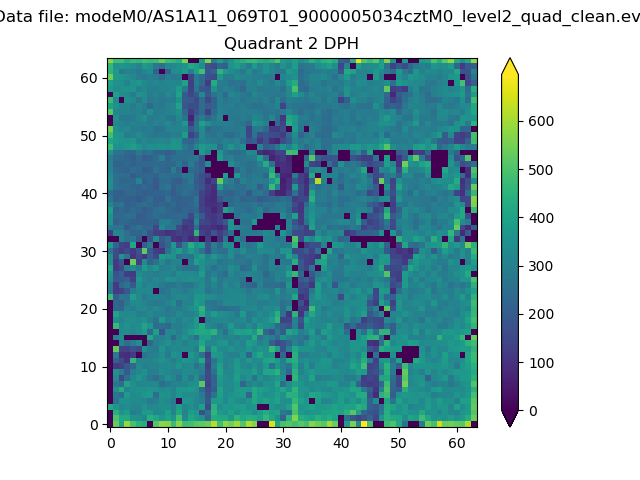 |
Quadrant C |
| Plot type | Count rate plots | Images |
|---|---|---|
| Comparison with Poisson distribution Blue bars denote a histogram of data divided into 1 sec bins. Red curve is a Poisson curve with rate = median count rate of data. |
 |
 |
| Quadrant-wise count rates Data is divided into 100 sec bins |
 |
|
| Module-wise count rates for Quadrant A Data is divided into 100 sec bins |
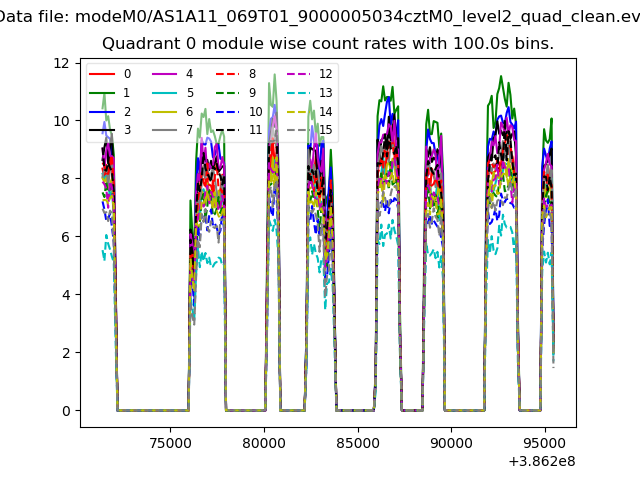 |
 |
| Module-wise count rates for Quadrant B Data is divided into 100 sec bins |
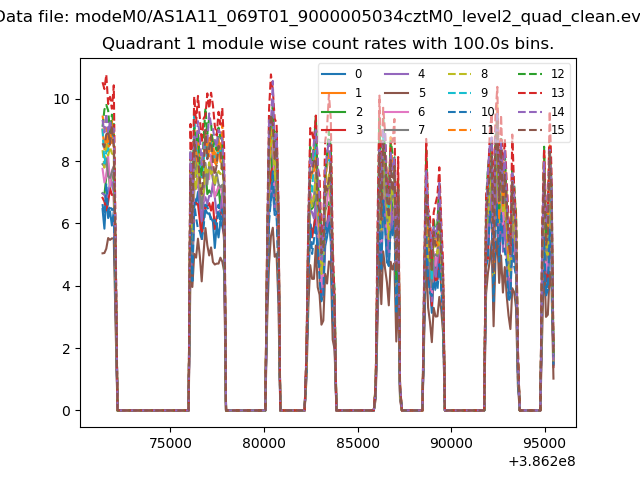 |
 |
| Module-wise count rates for Quadrant C Data is divided into 100 sec bins |
 |
 |
| Module-wise count rates for Quadrant D Data is divided into 100 sec bins |
 |
 |
| Parameter | Plot |
|---|---|
| CZT HV Monitor |  |
| D_VDD | 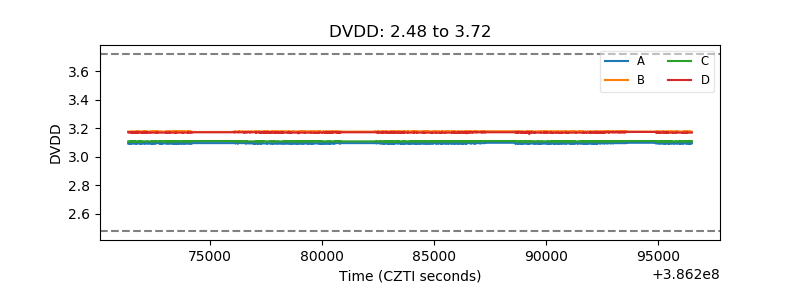 |
| Temperature 1 |  |
| Veto HV Monitor |  |
| Veto LLD |  |
| Alpha Counter |  |
| _CPM_Rate |  |
| CZT Counter | 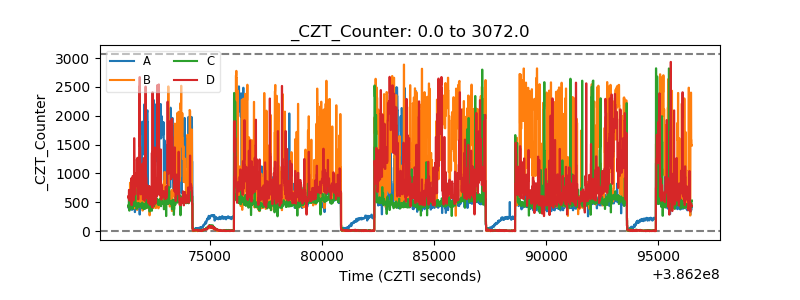 |
| +2.5 Volts monitor |  |
| +5 Volts monitor |  |
| _ROLL_ROT |  |
| _Roll_DEC |  |
| _Roll_RA | 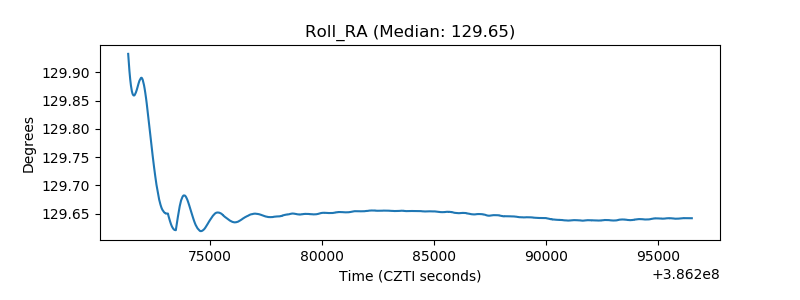 |
| Veto Counter |  |