| Param | Original file | Final file |
|---|---|---|
| Filename | modeM0/AS1A11_069T05_9000005038cztM0_level2.fits | modeM0/AS1A11_069T05_9000005038cztM0_level2_quad_clean.evt |
| Size (bytes) | 234,895,680 | 167,322,240 |
| Size | 224.0 MB | 159.6 MB |
| Events in quadrant A | 1,556,304 | 990,527 |
| Events in quadrant B | 1,323,688 | 852,818 |
| Events in quadrant C | 1,450,806 | 922,624 |
| Events in quadrant D | 1,184,510 | 703,560 |
| Mode M9 | |||
|---|---|---|---|
| Quadrant | BADHDUFLAG | Total packets | Discarded packets |
| A | 0 | 92 | 0 |
| B | 0 | 92 | 0 |
| C | 0 | 92 | 0 |
| D | 0 | 92 | 0 |
| Mode SS | |||
|---|---|---|---|
| Quadrant | BADHDUFLAG | Total packets | Discarded packets |
| A | 0 | 472 | 0 |
| B | 0 | 472 | 0 |
| C | 0 | 472 | 0 |
| D | 0 | 472 | 0 |
| Mode M0 | |||
|---|---|---|---|
| Quadrant | BADHDUFLAG | Total packets | Discarded packets |
| A | 0 | 50382 | 0 |
| B | 0 | 89564 | 0 |
| C | 0 | 54937 | 0 |
| D | 0 | 102666 | 0 |
| Quadrant | Total seconds | Saturated seconds | Saturation percentage |
|---|---|---|---|
| A | 23193 | 110 | 0.474281% |
| B | 23193 | 4272 | 18.419351% |
| C | 23193 | 361 | 1.556504% |
| D | 23193 | 3549 | 15.302031% |
Noise dominated data is calculated using 1-second bins in cleaned event files. If a bin has >2000 counts, and if more than 50% of those come from <1% of pixels, then it is considered to be noise-dominated and hence unusable.
| Quadrant | # 1 sec bins | Bins with >0 counts | Bins with >2000 counts | High rate bins dominated by noise | Noise dominated (total time) | Noise dominated (detector-on time) | Marked lightcurve |
|---|---|---|---|---|---|---|---|
| A | 32339 | 23193 | 0 | 0 | 0.00% | 0.00% |  |
| B | 32339 | 23116 | 0 | 0 | 0.00% | 0.00% |  |
| C | 32339 | 23188 | 0 | 0 | 0.00% | 0.00% |  |
| D | 32339 | 23178 | 0 | 0 | 0.00% | 0.00% |  |
Top three noisy pixels from each quadrant. If the there are fewer than three noisy pixels in the level2.evt file, extra rows are filled as -1
| Pixel properties | Quadrant properties | ||||||
|---|---|---|---|---|---|---|---|
| Quadrant | DetID | PixID | Counts | Sigma | Mean | Median | Sigma |
| A | 7 | 110 | 1286 | 9.17 | 406 | 384 | 98.4 |
| A | 9 | 19 | 1259 | 8.89 | 406 | 384 | 98.4 |
| A | 0 | 29 | 1240 | 8.7 | 406 | 384 | 98.4 |
| B | 2 | 9 | 1154 | 11.78 | 351 | 337 | 69.4 |
| B | 3 | 80 | 1029 | 9.98 | 351 | 337 | 69.4 |
| B | 2 | 8 | 967 | 9.08 | 351 | 337 | 69.4 |
| C | 1 | 80 | 1166 | 8.11 | 384 | 362 | 99.2 |
| C | 1 | 81 | 1161 | 8.06 | 384 | 362 | 99.2 |
| C | 7 | 233 | 987 | 6.3 | 384 | 362 | 99.2 |
| D | 10 | 189 | 864 | 6.13 | 340 | 312 | 90.1 |
| D | 7 | 3 | 860 | 6.08 | 340 | 312 | 90.1 |
| D | 6 | 231 | 850 | 5.97 | 340 | 312 | 90.1 |
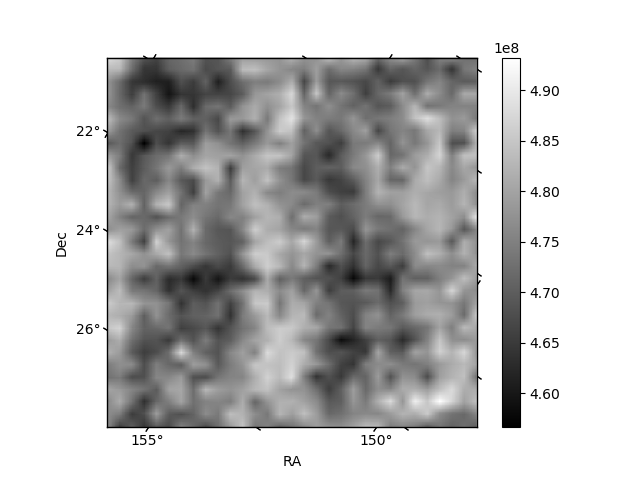
Histogram calculated using DETX and DETY for each event in the final _common_clean file
| Quadrant A | 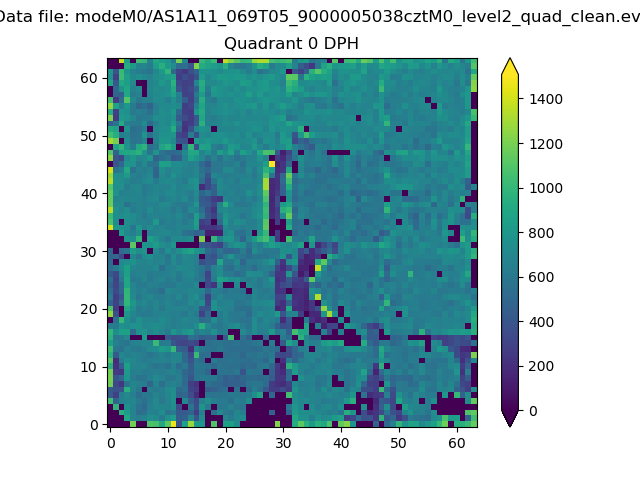 |
 |
Quadrant B |
|---|---|---|---|
| Quadrant D | 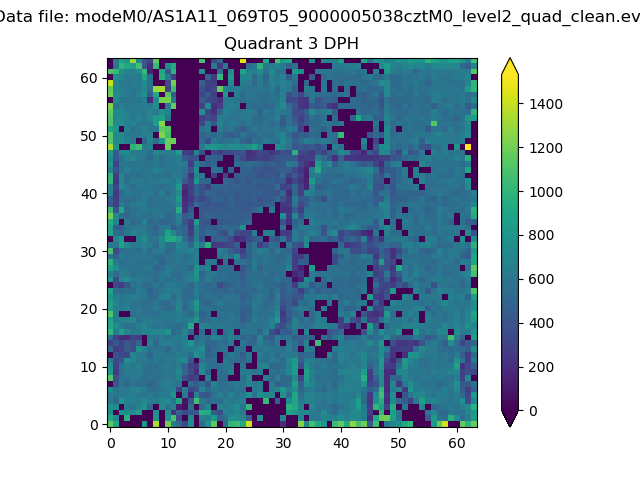 |
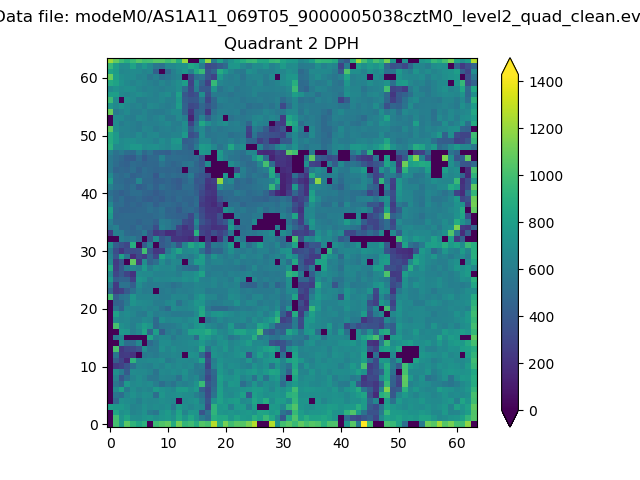 |
Quadrant C |
| Plot type | Count rate plots | Images |
|---|---|---|
| Comparison with Poisson distribution Blue bars denote a histogram of data divided into 1 sec bins. Red curve is a Poisson curve with rate = median count rate of data. |
 |
 |
| Quadrant-wise count rates Data is divided into 100 sec bins |
 |
|
| Module-wise count rates for Quadrant A Data is divided into 100 sec bins |
 |
 |
| Module-wise count rates for Quadrant B Data is divided into 100 sec bins |
 |
 |
| Module-wise count rates for Quadrant C Data is divided into 100 sec bins |
 |
 |
| Module-wise count rates for Quadrant D Data is divided into 100 sec bins |
 |
 |
| Parameter | Plot |
|---|---|
| CZT HV Monitor |  |
| D_VDD |  |
| Temperature 1 |  |
| Veto HV Monitor |  |
| Veto LLD | 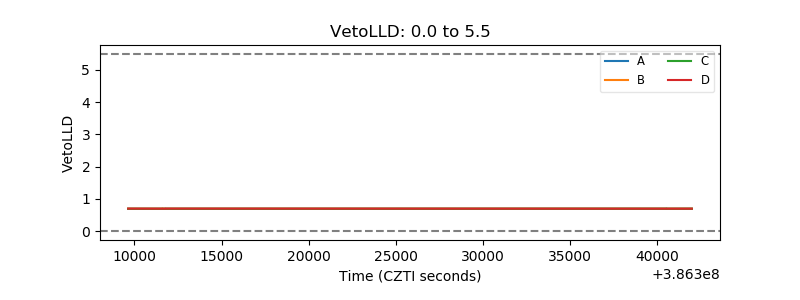 |
| Alpha Counter |  |
| _CPM_Rate |  |
| CZT Counter |  |
| +2.5 Volts monitor | 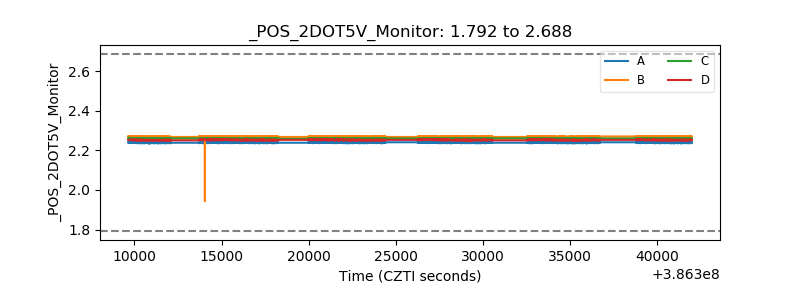 |
| +5 Volts monitor |  |
| _ROLL_ROT |  |
| _Roll_DEC |  |
| _Roll_RA | 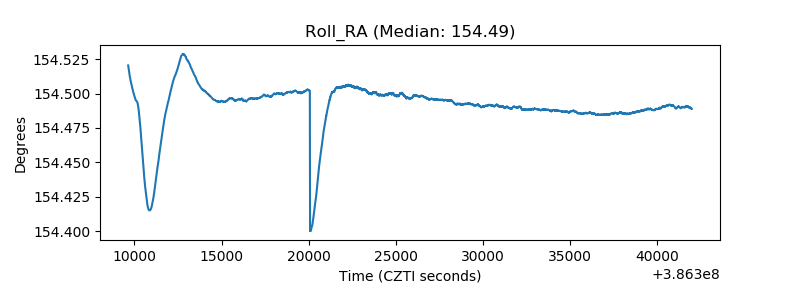 |
| Veto Counter |  |