| Param | Original file | Final file |
|---|---|---|
| Filename | modeM0/AS1C07_006T01_9000005040cztM0_level2.fits | modeM0/AS1C07_006T01_9000005040cztM0_level2_quad_clean.evt |
| Size (bytes) | 45,480,960 | 10,293,120 |
| Size | 43.4 MB | 9.8 MB |
| Events in quadrant A | 296,514 | 2,383 |
| Events in quadrant B | 261,206 | 2,128 |
| Events in quadrant C | 284,382 | 2,299 |
| Events in quadrant D | 233,938 | 2,216 |
| Mode M9 | |||
|---|---|---|---|
| Quadrant | BADHDUFLAG | Total packets | Discarded packets |
| A | 0 | 28 | 0 |
| B | 0 | 28 | 0 |
| C | 0 | 28 | 0 |
| D | 0 | 28 | 0 |
| Mode M0 | |||
|---|---|---|---|
| Quadrant | BADHDUFLAG | Total packets | Discarded packets |
| A | 0 | 9211 | 0 |
| B | 0 | 15194 | 0 |
| C | 0 | 10010 | 0 |
| D | 0 | 17080 | 0 |
| Mode SS | |||
|---|---|---|---|
| Quadrant | BADHDUFLAG | Total packets | Discarded packets |
| A | 0 | 88 | 0 |
| B | 0 | 88 | 0 |
| C | 0 | 88 | 0 |
| D | 0 | 88 | 0 |
| Quadrant | Total seconds | Saturated seconds | Saturation percentage |
|---|---|---|---|
| A | 4283 | 10 | 0.233481% |
| B | 4283 | 579 | 13.518562% |
| C | 4283 | 96 | 2.241420% |
| D | 4283 | 538 | 12.561289% |
Noise dominated data is calculated using 1-second bins in cleaned event files. If a bin has >2000 counts, and if more than 50% of those come from <1% of pixels, then it is considered to be noise-dominated and hence unusable.
| Quadrant | # 1 sec bins | Bins with >0 counts | Bins with >2000 counts | High rate bins dominated by noise | Noise dominated (total time) | Noise dominated (detector-on time) | Marked lightcurve |
|---|---|---|---|---|---|---|---|
| A | 6408 | 4283 | 0 | 0 | 0.00% | 0.00% |  |
| B | 6408 | 4281 | 0 | 0 | 0.00% | 0.00% |  |
| C | 6408 | 4283 | 0 | 0 | 0.00% | 0.00% |  |
| D | 6408 | 4282 | 0 | 0 | 0.00% | 0.00% |  |
Top three noisy pixels from each quadrant. If the there are fewer than three noisy pixels in the level2.evt file, extra rows are filled as -1
| Pixel properties | Quadrant properties | ||||||
|---|---|---|---|---|---|---|---|
| Quadrant | DetID | PixID | Counts | Sigma | Mean | Median | Sigma |
| A | 0 | 29 | 261 | 9.3 | 77 | 73 | 20.2 |
| A | 7 | 110 | 252 | 8.85 | 77 | 73 | 20.2 |
| A | 0 | 30 | 226 | 7.57 | 77 | 73 | 20.2 |
| B | 2 | 9 | 202 | 8.77 | 69 | 66 | 15.5 |
| B | 3 | 80 | 195 | 8.32 | 69 | 66 | 15.5 |
| B | 14 | 254 | 182 | 7.48 | 69 | 66 | 15.5 |
| C | 3 | 202 | 249 | 8.53 | 75 | 71 | 20.9 |
| C | 1 | 81 | 220 | 7.14 | 75 | 71 | 20.9 |
| C | 3 | 203 | 209 | 6.61 | 75 | 71 | 20.9 |
| D | 10 | 113 | 177 | 6.14 | 66 | 61 | 18.9 |
| D | 6 | 38 | 177 | 6.14 | 66 | 61 | 18.9 |
| D | 4 | 160 | 170 | 5.77 | 66 | 61 | 18.9 |
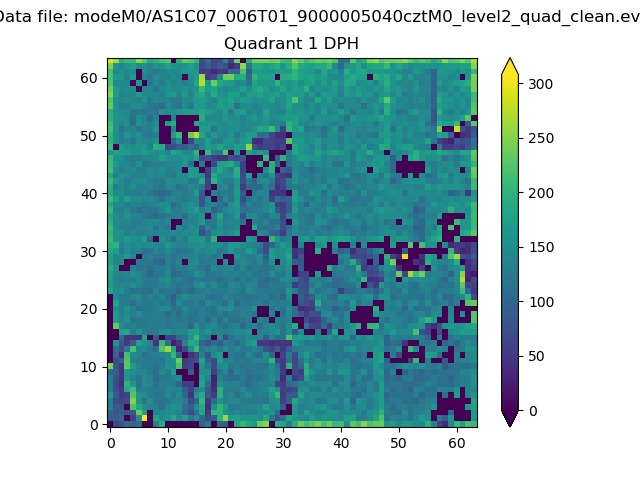
Histogram calculated using DETX and DETY for each event in the final _common_clean file
| Quadrant A |  |
 |
Quadrant B |
|---|---|---|---|
| Quadrant D | 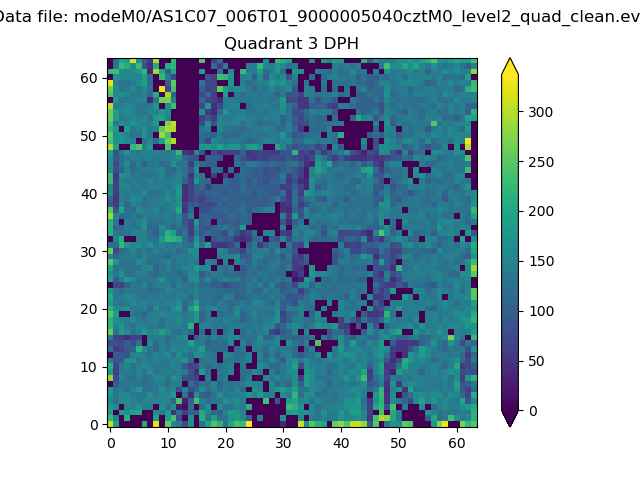 |
 |
Quadrant C |
| Plot type | Count rate plots | Images |
|---|---|---|
| Comparison with Poisson distribution Blue bars denote a histogram of data divided into 1 sec bins. Red curve is a Poisson curve with rate = median count rate of data. |
 |
 |
| Quadrant-wise count rates Data is divided into 100 sec bins |
 |
|
| Module-wise count rates for Quadrant A Data is divided into 100 sec bins |
 |
 |
| Module-wise count rates for Quadrant B Data is divided into 100 sec bins |
 |
 |
| Module-wise count rates for Quadrant C Data is divided into 100 sec bins |
 |
 |
| Module-wise count rates for Quadrant D Data is divided into 100 sec bins |
 |
 |
| Parameter | Plot |
|---|---|
| CZT HV Monitor |  |
| D_VDD |  |
| Temperature 1 |  |
| Veto HV Monitor |  |
| Veto LLD |  |
| Alpha Counter |  |
| _CPM_Rate |  |
| CZT Counter |  |
| +2.5 Volts monitor |  |
| +5 Volts monitor |  |
| _ROLL_ROT |  |
| _Roll_DEC |  |
| _Roll_RA |  |
| Veto Counter |  |