| Param | Original file | Final file |
|---|---|---|
| Filename | modeM0/AS1T05_016T01_9000005036cztM0_level2.fits | modeM0/AS1T05_016T01_9000005036cztM0_level2_quad_clean.evt |
| Size (bytes) | 73,883,520 | 96,168,960 |
| Size | 70.5 MB | 91.7 MB |
| Events in quadrant A | 465,828 | 658,764 |
| Events in quadrant B | 382,788 | 528,654 |
| Events in quadrant C | 443,288 | 617,397 |
| Events in quadrant D | 376,598 | 538,922 |
| Mode SS | |||
|---|---|---|---|
| Quadrant | BADHDUFLAG | Total packets | Discarded packets |
| A | 0 | 164 | 0 |
| B | 0 | 164 | 0 |
| C | 0 | 164 | 0 |
| D | 0 | 164 | 0 |
| Mode M9 | |||
|---|---|---|---|
| Quadrant | BADHDUFLAG | Total packets | Discarded packets |
| A | 0 | 29 | 0 |
| B | 0 | 29 | 0 |
| C | 0 | 29 | 0 |
| D | 0 | 29 | 0 |
| Mode M0 | |||
|---|---|---|---|
| Quadrant | BADHDUFLAG | Total packets | Discarded packets |
| A | 0 | 16964 | 0 |
| B | 0 | 35225 | 0 |
| C | 0 | 18302 | 0 |
| D | 0 | 28473 | 0 |
| Quadrant | Total seconds | Saturated seconds | Saturation percentage |
|---|---|---|---|
| A | 8186 | 42 | 0.513071% |
| B | 8186 | 2133 | 26.056682% |
| C | 8186 | 98 | 1.197166% |
| D | 8186 | 504 | 6.156853% |
Noise dominated data is calculated using 1-second bins in cleaned event files. If a bin has >2000 counts, and if more than 50% of those come from <1% of pixels, then it is considered to be noise-dominated and hence unusable.
| Quadrant | # 1 sec bins | Bins with >0 counts | Bins with >2000 counts | High rate bins dominated by noise | Noise dominated (total time) | Noise dominated (detector-on time) | Marked lightcurve |
|---|---|---|---|---|---|---|---|
| A | 10961 | 8185 | 0 | 0 | 0.00% | 0.00% |  |
| B | 10961 | 8150 | 0 | 0 | 0.00% | 0.00% | 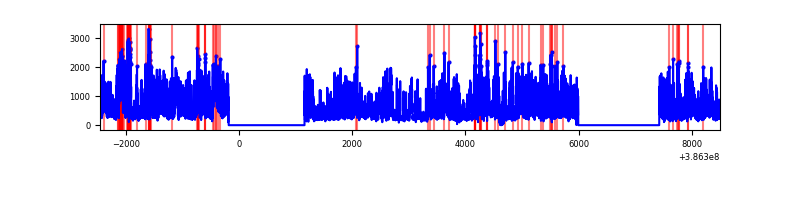 |
| C | 10961 | 8186 | 0 | 0 | 0.00% | 0.00% |  |
| D | 10961 | 8177 | 0 | 0 | 0.00% | 0.00% |  |
Top three noisy pixels from each quadrant. If the there are fewer than three noisy pixels in the level2.evt file, extra rows are filled as -1
| Pixel properties | Quadrant properties | ||||||
|---|---|---|---|---|---|---|---|
| Quadrant | DetID | PixID | Counts | Sigma | Mean | Median | Sigma |
| A | 0 | 29 | 409 | 9.22 | 121 | 114 | 32.0 |
| A | 7 | 110 | 393 | 8.72 | 121 | 114 | 32.0 |
| A | 9 | 19 | 358 | 7.63 | 121 | 114 | 32.0 |
| B | 2 | 9 | 321 | 10.2 | 101 | 96 | 22.0 |
| B | 3 | 80 | 309 | 9.65 | 101 | 96 | 22.0 |
| B | 2 | 8 | 277 | 8.2 | 101 | 96 | 22.0 |
| C | 9 | 233 | 308 | 6.39 | 117 | 110 | 31.0 |
| C | 1 | 65 | 306 | 6.32 | 117 | 110 | 31.0 |
| C | 9 | 242 | 306 | 6.32 | 117 | 110 | 31.0 |
| D | 10 | 189 | 293 | 6.4 | 107 | 98 | 30.5 |
| D | 1 | 3 | 274 | 5.78 | 107 | 98 | 30.5 |
| D | 6 | 67 | 273 | 5.75 | 107 | 98 | 30.5 |
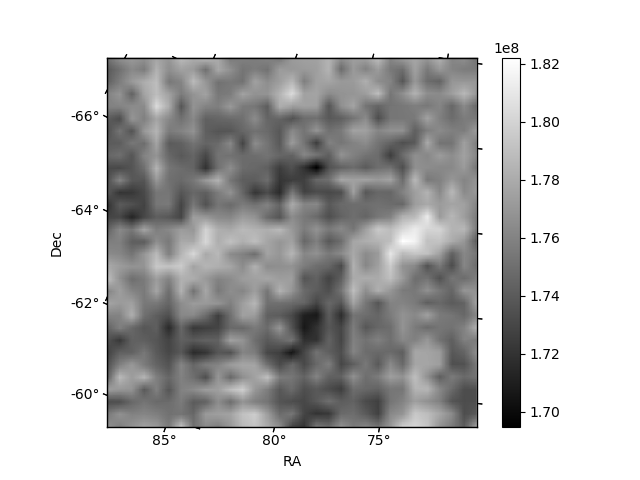
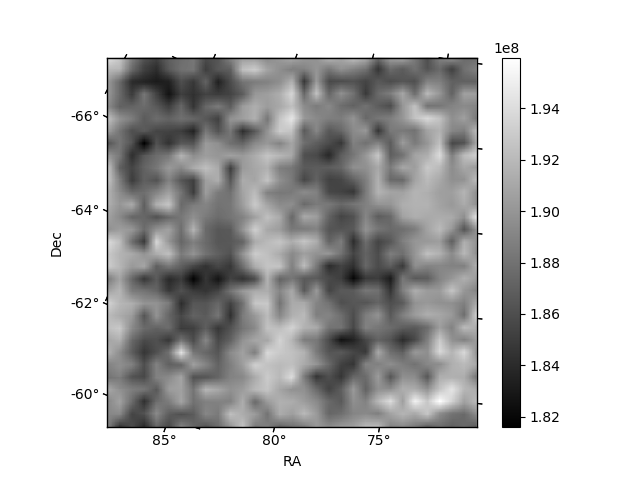
Histogram calculated using DETX and DETY for each event in the final _common_clean file
| Quadrant A | 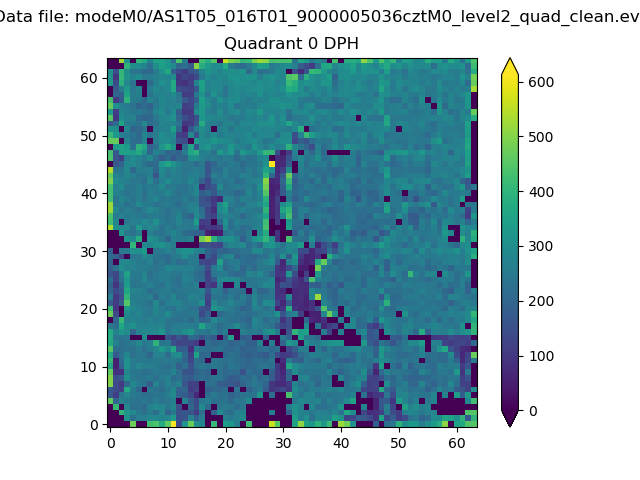 |
 |
Quadrant B |
|---|---|---|---|
| Quadrant D |  |
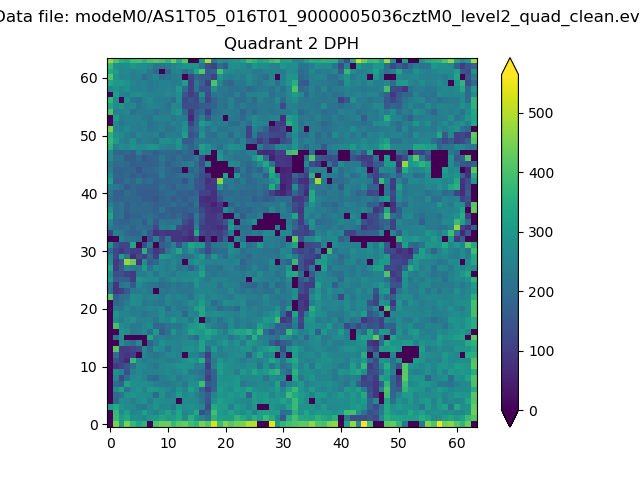 |
Quadrant C |
| Plot type | Count rate plots | Images |
|---|---|---|
| Comparison with Poisson distribution Blue bars denote a histogram of data divided into 1 sec bins. Red curve is a Poisson curve with rate = median count rate of data. |
 |
 |
| Quadrant-wise count rates Data is divided into 100 sec bins |
 |
|
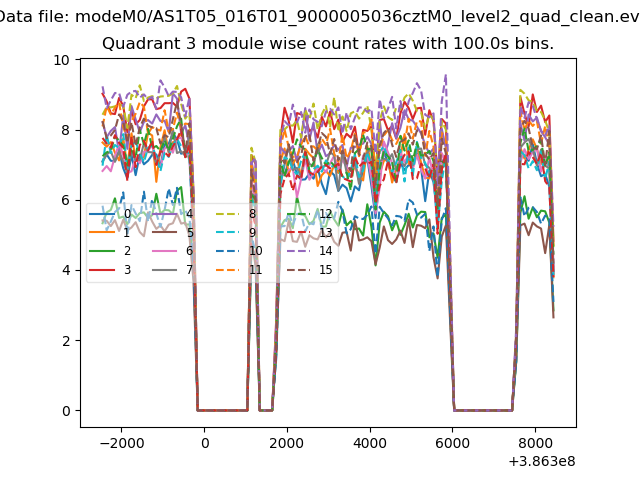
| Module-wise count rates for Quadrant A Data is divided into 100 sec bins |
 |
 |
| Module-wise count rates for Quadrant B Data is divided into 100 sec bins |
 |
 |
| Module-wise count rates for Quadrant C Data is divided into 100 sec bins |
 |
 |
| Module-wise count rates for Quadrant D Data is divided into 100 sec bins |
 |
 |
| Parameter | Plot |
|---|---|
| CZT HV Monitor |  |
| D_VDD | 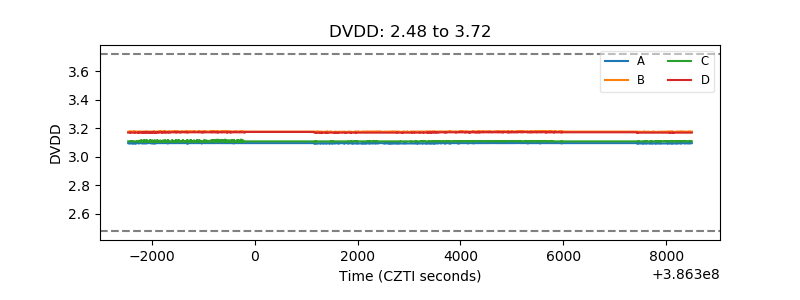 |
| Temperature 1 |  |
| Veto HV Monitor |  |
| Veto LLD | 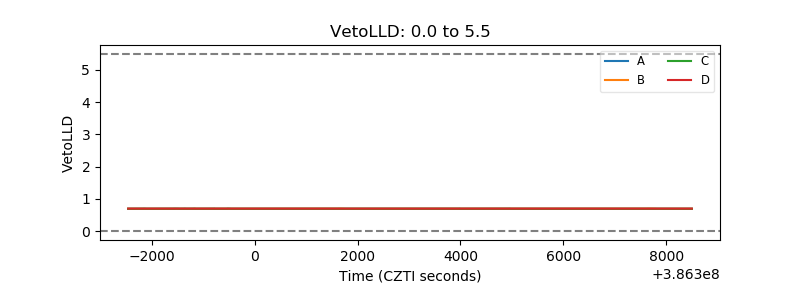 |
| Alpha Counter |  |
| _CPM_Rate | 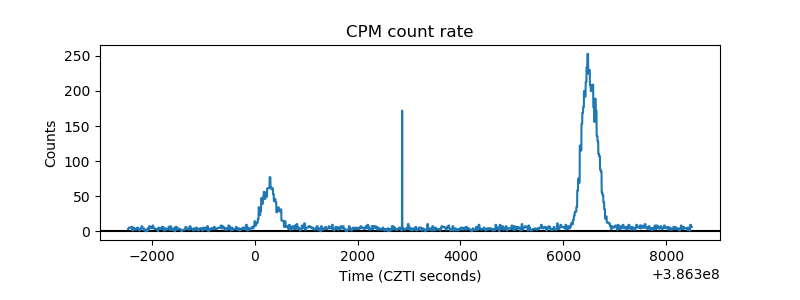 |
| CZT Counter |  |
| +2.5 Volts monitor |  |
| +5 Volts monitor | 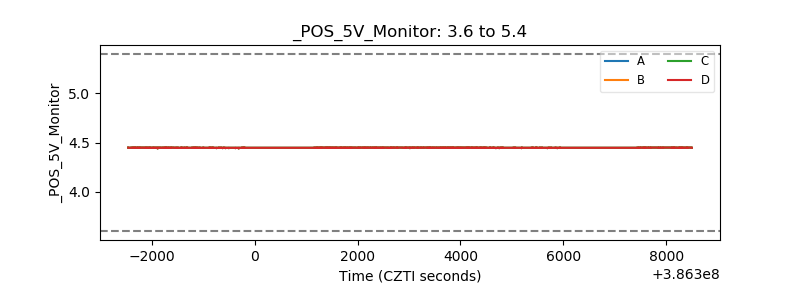 |
| _ROLL_ROT |  |
| _Roll_DEC |  |
| _Roll_RA |  |
| Veto Counter |  |