| Param | Original file | Final file |
|---|---|---|
| Filename | modeM0/AS1T05_016T01_9000005048cztM0_level2.fits | modeM0/AS1T05_016T01_9000005048cztM0_level2_quad_clean.evt |
| Size (bytes) | 76,426,560 | 84,196,800 |
| Size | 72.9 MB | 80.3 MB |
| Events in quadrant A | 494,534 | 619,860 |
| Events in quadrant B | 357,498 | 364,074 |
| Events in quadrant C | 483,288 | 583,783 |
| Events in quadrant D | 352,726 | 357,718 |
| Mode SS | |||
|---|---|---|---|
| Quadrant | BADHDUFLAG | Total packets | Discarded packets |
| A | 0 | 180 | 0 |
| B | 0 | 180 | 0 |
| C | 0 | 180 | 0 |
| D | 0 | 180 | 0 |
| Mode M9 | |||
|---|---|---|---|
| Quadrant | BADHDUFLAG | Total packets | Discarded packets |
| A | 0 | 14 | 0 |
| B | 0 | 14 | 0 |
| C | 0 | 14 | 0 |
| D | 0 | 14 | 0 |
| Mode M0 | |||
|---|---|---|---|
| Quadrant | BADHDUFLAG | Total packets | Discarded packets |
| A | 0 | 18150 | 0 |
| B | 0 | 49719 | 0 |
| C | 0 | 18828 | 0 |
| D | 0 | 52976 | 0 |
| Quadrant | Total seconds | Saturated seconds | Saturation percentage |
|---|---|---|---|
| A | 8980 | 11 | 0.122494% |
| B | 8980 | 4439 | 49.432071% |
| C | 8980 | 46 | 0.512249% |
| D | 8980 | 3036 | 33.808463% |
Noise dominated data is calculated using 1-second bins in cleaned event files. If a bin has >2000 counts, and if more than 50% of those come from <1% of pixels, then it is considered to be noise-dominated and hence unusable.
| Quadrant | # 1 sec bins | Bins with >0 counts | Bins with >2000 counts | High rate bins dominated by noise | Noise dominated (total time) | Noise dominated (detector-on time) | Marked lightcurve |
|---|---|---|---|---|---|---|---|
| A | 10443 | 8980 | 0 | 0 | 0.00% | 0.00% |  |
| B | 10443 | 8950 | 0 | 0 | 0.00% | 0.00% |  |
| C | 10443 | 8980 | 0 | 0 | 0.00% | 0.00% |  |
| D | 10443 | 8959 | 0 | 0 | 0.00% | 0.00% |  |
Top three noisy pixels from each quadrant. If the there are fewer than three noisy pixels in the level2.evt file, extra rows are filled as -1
| Pixel properties | Quadrant properties | ||||||
|---|---|---|---|---|---|---|---|
| Quadrant | DetID | PixID | Counts | Sigma | Mean | Median | Sigma |
| A | 7 | 110 | 427 | 9.21 | 128 | 121 | 33.2 |
| A | 9 | 19 | 414 | 8.82 | 128 | 121 | 33.2 |
| A | 0 | 29 | 379 | 7.76 | 128 | 121 | 33.2 |
| B | 2 | 9 | 320 | 11.19 | 94 | 90 | 20.6 |
| B | 3 | 80 | 282 | 9.34 | 94 | 90 | 20.6 |
| B | 5 | 255 | 262 | 8.37 | 94 | 90 | 20.6 |
| C | 9 | 233 | 364 | 7.14 | 128 | 120 | 34.2 |
| C | 3 | 187 | 327 | 6.05 | 128 | 120 | 34.2 |
| C | 1 | 65 | 310 | 5.56 | 128 | 120 | 34.2 |
| D | 6 | 62 | 278 | 6.56 | 100 | 92 | 28.4 |
| D | 6 | 38 | 260 | 5.92 | 100 | 92 | 28.4 |
| D | 6 | 83 | 258 | 5.85 | 100 | 92 | 28.4 |
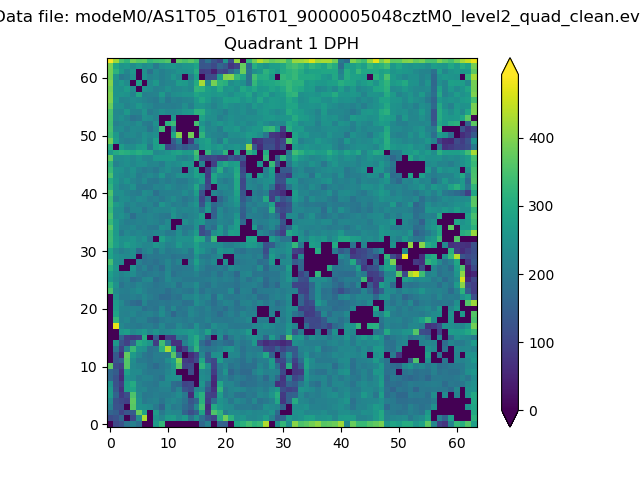
Histogram calculated using DETX and DETY for each event in the final _common_clean file
| Quadrant A |  |
 |
Quadrant B |
|---|---|---|---|
| Quadrant D |  |
 |
Quadrant C |
| Plot type | Count rate plots | Images |
|---|---|---|
| Comparison with Poisson distribution Blue bars denote a histogram of data divided into 1 sec bins. Red curve is a Poisson curve with rate = median count rate of data. |
 |
 |
| Quadrant-wise count rates Data is divided into 100 sec bins |
 |
|
| Module-wise count rates for Quadrant A Data is divided into 100 sec bins |
 |
 |
| Module-wise count rates for Quadrant B Data is divided into 100 sec bins |
 |
 |
| Module-wise count rates for Quadrant C Data is divided into 100 sec bins |
 |
 |
| Module-wise count rates for Quadrant D Data is divided into 100 sec bins |
 |
 |
| Parameter | Plot |
|---|---|
| CZT HV Monitor | 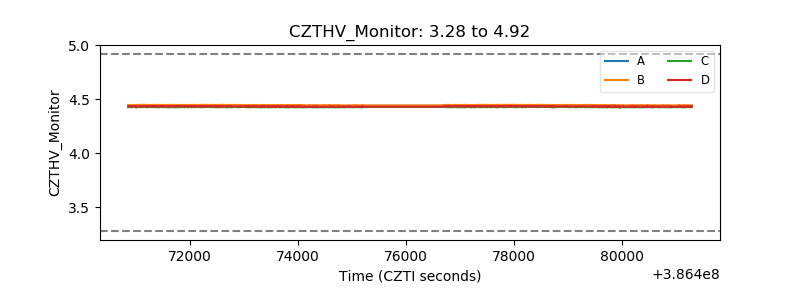 |
| D_VDD |  |
| Temperature 1 |  |
| Veto HV Monitor |  |
| Veto LLD |  |
| Alpha Counter |  |
| _CPM_Rate |  |
| CZT Counter |  |
| +2.5 Volts monitor |  |
| +5 Volts monitor |  |
| _ROLL_ROT |  |
| _Roll_DEC |  |
| _Roll_RA |  |
| Veto Counter | 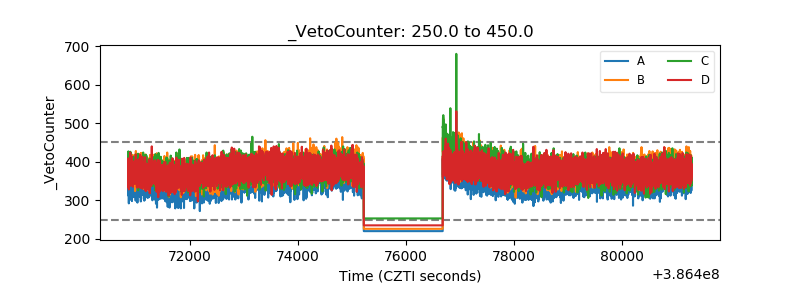 |