| Param | Original file | Final file |
|---|---|---|
| Filename | modeM0/AS1T05_020T01_9000005050cztM0_level2.fits | modeM0/AS1T05_020T01_9000005050cztM0_level2_quad_clean.evt |
| Size (bytes) | 630,060,480 | 581,757,120 |
| Size | 600.9 MB | 554.8 MB |
| Events in quadrant A | 4,152,622 | 3,755,819 |
| Events in quadrant B | 3,274,456 | 2,809,227 |
| Events in quadrant C | 3,963,326 | 3,533,780 |
| Events in quadrant D | 3,001,460 | 2,845,822 |
| Mode SS | |||
|---|---|---|---|
| Quadrant | BADHDUFLAG | Total packets | Discarded packets |
| A | 0 | 1386 | 0 |
| B | 0 | 1386 | 0 |
| C | 0 | 1386 | 0 |
| D | 0 | 1386 | 0 |
| Mode M0 | |||
|---|---|---|---|
| Quadrant | BADHDUFLAG | Total packets | Discarded packets |
| A | 0 | 141856 | 0 |
| B | 0 | 329431 | 0 |
| C | 0 | 156966 | 0 |
| D | 0 | 328869 | 0 |
| Mode M9 | |||
|---|---|---|---|
| Quadrant | BADHDUFLAG | Total packets | Discarded packets |
| A | 0 | 249 | 0 |
| B | 0 | 250 | 0 |
| C | 0 | 250 | 0 |
| D | 0 | 250 | 0 |
| Quadrant | Total seconds | Saturated seconds | Saturation percentage |
|---|---|---|---|
| A | 68130 | 145 | 0.212828% |
| B | 68129 | 23214 | 34.073596% |
| C | 68130 | 1027 | 1.507412% |
| D | 68130 | 16904 | 24.811390% |
Noise dominated data is calculated using 1-second bins in cleaned event files. If a bin has >2000 counts, and if more than 50% of those come from <1% of pixels, then it is considered to be noise-dominated and hence unusable.
| Quadrant | # 1 sec bins | Bins with >0 counts | Bins with >2000 counts | High rate bins dominated by noise | Noise dominated (total time) | Noise dominated (detector-on time) | Marked lightcurve |
|---|---|---|---|---|---|---|---|
| A | 92153 | 68130 | 0 | 0 | 0.00% | 0.00% |  |
| B | 92152 | 68000 | 0 | 0 | 0.00% | 0.00% |  |
| C | 92153 | 68110 | 0 | 0 | 0.00% | 0.00% |  |
| D | 92153 | 68078 | 0 | 0 | 0.00% | 0.00% |  |
Top three noisy pixels from each quadrant. If the there are fewer than three noisy pixels in the level2.evt file, extra rows are filled as -1
| Pixel properties | Quadrant properties | ||||||
|---|---|---|---|---|---|---|---|
| Quadrant | DetID | PixID | Counts | Sigma | Mean | Median | Sigma |
| A | 9 | 19 | 3338 | 8.76 | 1084 | 1021 | 264.6 |
| A | 7 | 110 | 3301 | 8.62 | 1084 | 1021 | 264.6 |
| A | 0 | 29 | 3256 | 8.45 | 1084 | 1021 | 264.6 |
| B | 2 | 9 | 2843 | 11.82 | 867 | 829 | 170.4 |
| B | 3 | 80 | 2454 | 9.54 | 867 | 829 | 170.4 |
| B | 2 | 8 | 2297 | 8.61 | 867 | 829 | 170.4 |
| C | 1 | 81 | 3331 | 8.86 | 1047 | 985 | 264.9 |
| C | 3 | 203 | 3218 | 8.43 | 1047 | 985 | 264.9 |
| C | 1 | 80 | 3215 | 8.42 | 1047 | 985 | 264.9 |
| D | 7 | 3 | 2231 | 6.36 | 861 | 790 | 226.5 |
| D | 10 | 113 | 2213 | 6.28 | 861 | 790 | 226.5 |
| D | 6 | 67 | 2204 | 6.24 | 861 | 790 | 226.5 |
Histogram calculated using DETX and DETY for each event in the final _common_clean file
| Quadrant A |  |
 |
Quadrant B |
|---|---|---|---|
| Quadrant D |  |
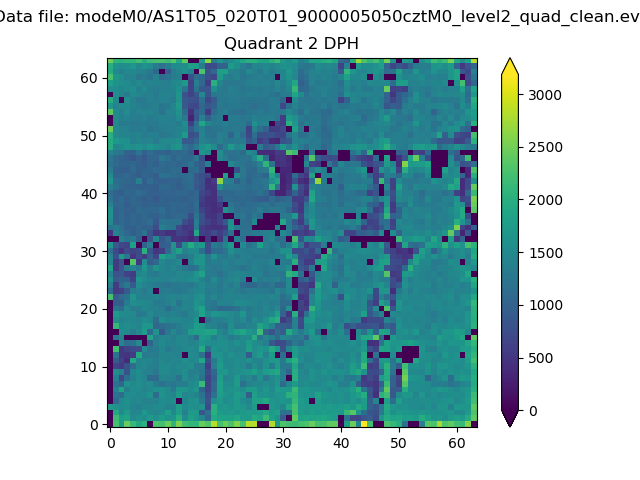 |
Quadrant C |
| Plot type | Count rate plots | Images |
|---|---|---|
| Comparison with Poisson distribution Blue bars denote a histogram of data divided into 1 sec bins. Red curve is a Poisson curve with rate = median count rate of data. |
 |
 |
| Quadrant-wise count rates Data is divided into 100 sec bins |
 |
|
| Module-wise count rates for Quadrant A Data is divided into 100 sec bins |
 |
 |
| Module-wise count rates for Quadrant B Data is divided into 100 sec bins |
 |
 |
| Module-wise count rates for Quadrant C Data is divided into 100 sec bins |
 |
 |
| Module-wise count rates for Quadrant D Data is divided into 100 sec bins |
 |
 |
| Parameter | Plot |
|---|---|
| CZT HV Monitor |  |
| D_VDD |  |
| Temperature 1 |  |
| Veto HV Monitor |  |
| Veto LLD |  |
| Alpha Counter |  |
| _CPM_Rate |  |
| CZT Counter |  |
| +2.5 Volts monitor |  |
| +5 Volts monitor |  |
| _ROLL_ROT |  |
| _Roll_DEC |  |
| _Roll_RA |  |
| Veto Counter |  |