| Param | Original file | Final file |
|---|---|---|
| Filename | modeM0/AS1T05_020T01_9000005050_35190cztM0_level2.evt | modeM0/AS1T05_020T01_9000005050_35190cztM0_level2_quad_clean.evt |
| Size (bytes) | 698,567,040 | 49,040,640 |
| Size | 666.2 MB | 46.8 MB |
| Events in quadrant A | 2,812,413 | 297,108 |
| Events in quadrant B | 6,773,392 | 282,311 |
| Events in quadrant C | 3,427,263 | 286,721 |
| Events in quadrant D | 7,794,222 | 254,860 |
| Mode SS | |||
|---|---|---|---|
| Quadrant | BADHDUFLAG | Total packets | Discarded packets |
| A | 0 | 106 | 0 |
| B | 0 | 106 | 0 |
| C | 0 | 106 | 0 |
| D | 0 | 106 | 0 |
| Mode M0 | |||
|---|---|---|---|
| Quadrant | BADHDUFLAG | Total packets | Discarded packets |
| A | 0 | 11338 | 3 |
| B | 0 | 23764 | 2 |
| C | 0 | 13440 | 2 |
| D | 0 | 26820 | 2 |
| Mode M9 | |||
|---|---|---|---|
| Quadrant | BADHDUFLAG | Total packets | Discarded packets |
| A | 0 | 28 | 0 |
| B | 0 | 28 | 0 |
| C | 0 | 28 | 0 |
| D | 0 | 29 | 0 |
| Quadrant | Total seconds | Saturated seconds | Saturation percentage |
|---|---|---|---|
| A | 5184 | 8 | 0.154321% |
| B | 5184 | 1460 | 28.163580% |
| C | 5184 | 126 | 2.430556% |
| D | 5184 | 845 | 16.300154% |
Noise dominated data is calculated using 1-second bins in cleaned event files. If a bin has >2000 counts, and if more than 50% of those come from <1% of pixels, then it is considered to be noise-dominated and hence unusable.
| Quadrant | # 1 sec bins | Bins with >0 counts | Bins with >2000 counts | High rate bins dominated by noise | Noise dominated (total time) | Noise dominated (detector-on time) | Marked lightcurve |
|---|---|---|---|---|---|---|---|
| A | 7307 | 5185 | 1 | 1 | 0.01% | 0.02% | 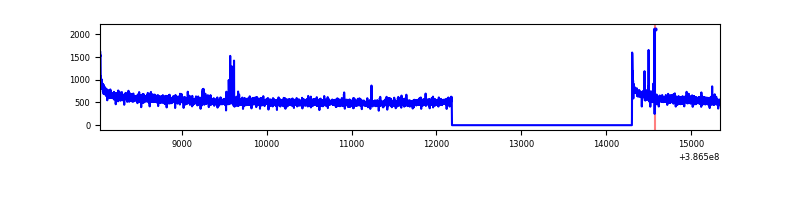 |
| B | 7307 | 5185 | 896 | 896 | 12.26% | 17.28% | 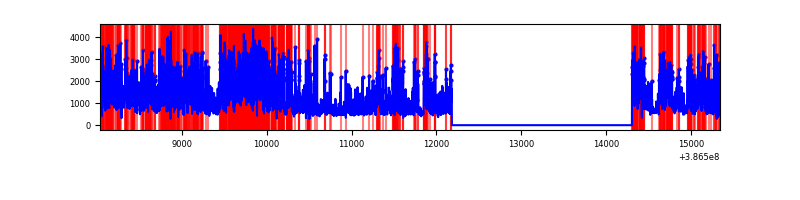 |
| C | 7307 | 5185 | 84 | 84 | 1.15% | 1.62% | 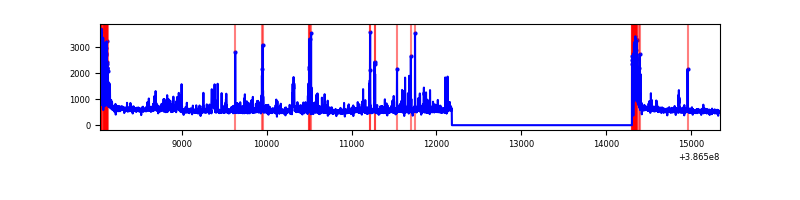 |
| D | 7307 | 5185 | 1138 | 1138 | 15.57% | 21.95% | 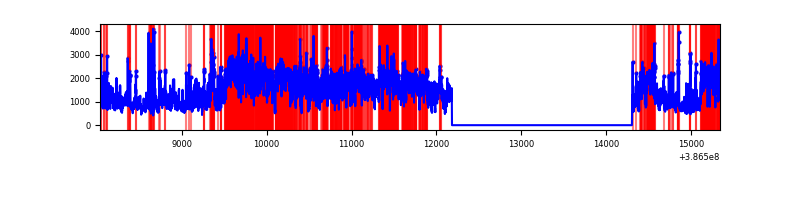 |
Top three noisy pixels from each quadrant. If the there are fewer than three noisy pixels in the level2.evt file, extra rows are filled as -1
| Pixel properties | Quadrant properties | ||||||
|---|---|---|---|---|---|---|---|
| Quadrant | DetID | PixID | Counts | Sigma | Mean | Median | Sigma |
| A | 10 | 83 | 101916 | 736.34 | 694 | 684 | 137.5 |
| A | 13 | 6 | 13490 | 93.15 | 694 | 684 | 137.5 |
| A | 9 | 143 | 10418 | 70.8 | 694 | 684 | 137.5 |
| B | 5 | 236 | 4037580 | 34699.43 | 620 | 606 | 116.3 |
| B | 5 | 172 | 152902 | 1309.05 | 620 | 606 | 116.3 |
| B | 5 | 200 | 55752 | 474.0 | 620 | 606 | 116.3 |
| C | 0 | 10 | 464370 | 3117.98 | 655 | 662 | 148.7 |
| C | 15 | 214 | 217254 | 1456.37 | 655 | 662 | 148.7 |
| C | 1 | 23 | 145753 | 975.59 | 655 | 662 | 148.7 |
| D | 8 | 195 | 4589896 | 29298.52 | 647 | 630 | 156.6 |
| D | 5 | 223 | 208758 | 1328.72 | 647 | 630 | 156.6 |
| D | 12 | 233 | 103435 | 656.32 | 647 | 630 | 156.6 |
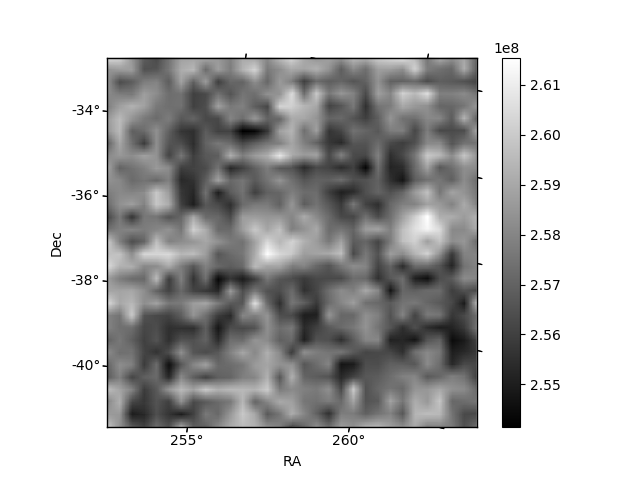
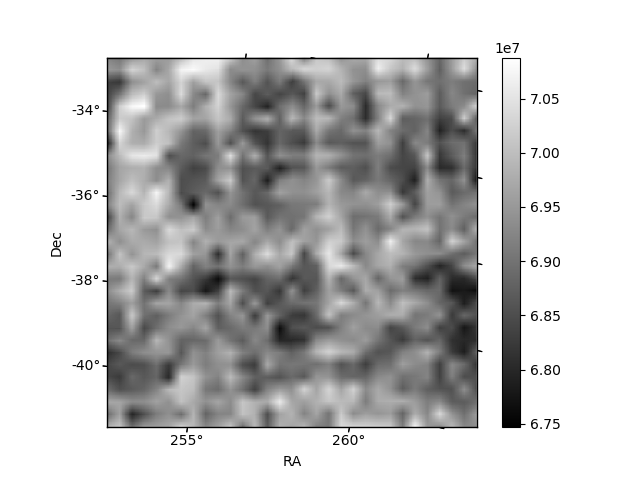
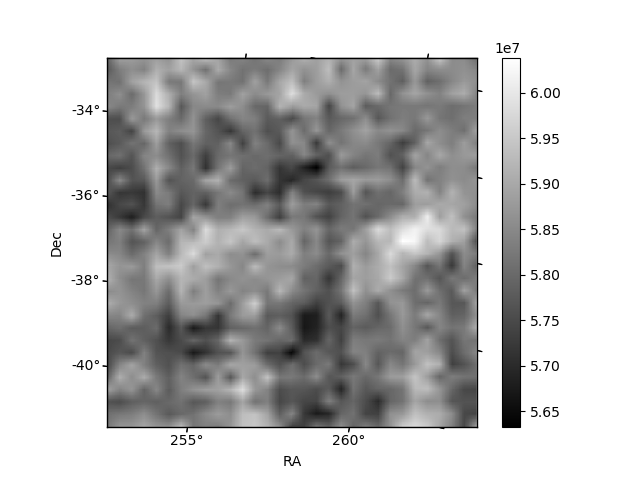
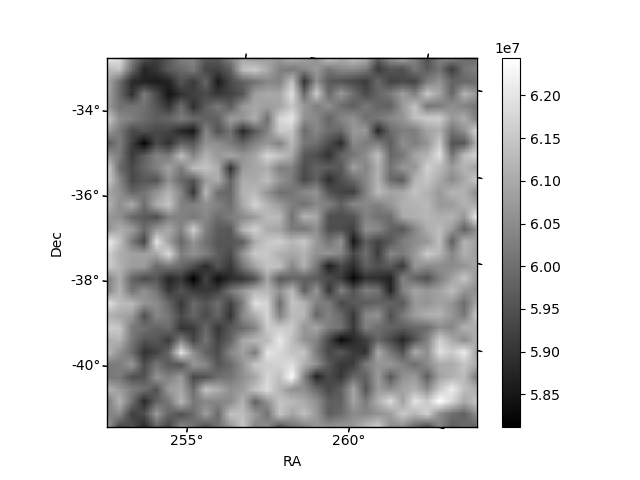
Histogram calculated using DETX and DETY for each event in the final _common_clean file
| Quadrant A | 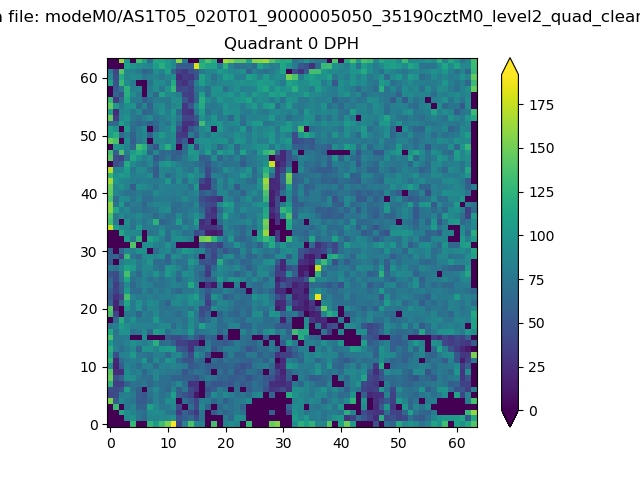 |
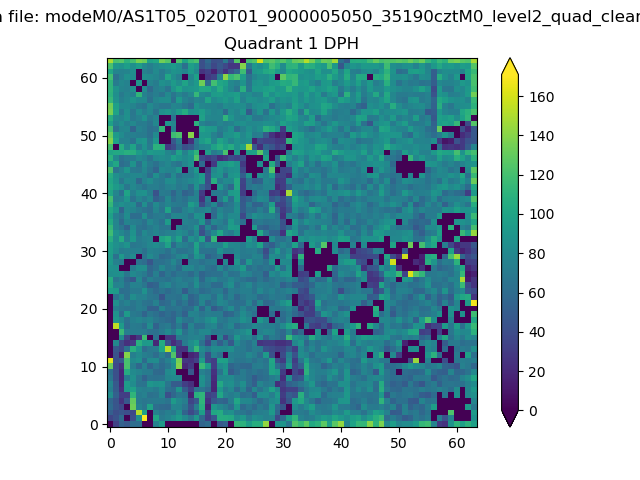 |
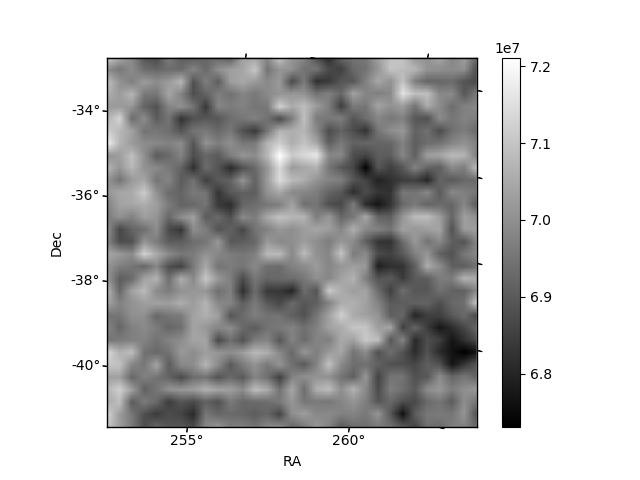
Quadrant B |
|---|---|---|---|
| Quadrant D | 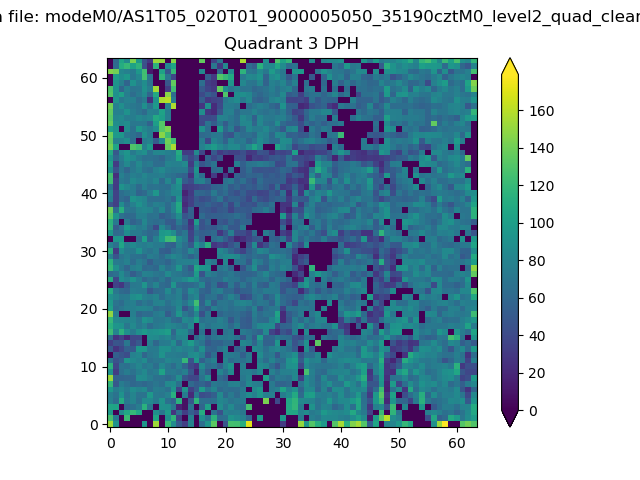 |
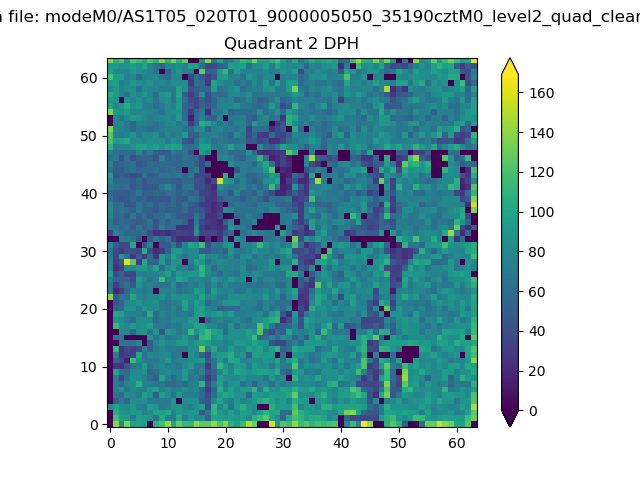 |
Quadrant C |
| Plot type | Count rate plots | Images |
|---|---|---|
| Comparison with Poisson distribution Blue bars denote a histogram of data divided into 1 sec bins. Red curve is a Poisson curve with rate = median count rate of data. |
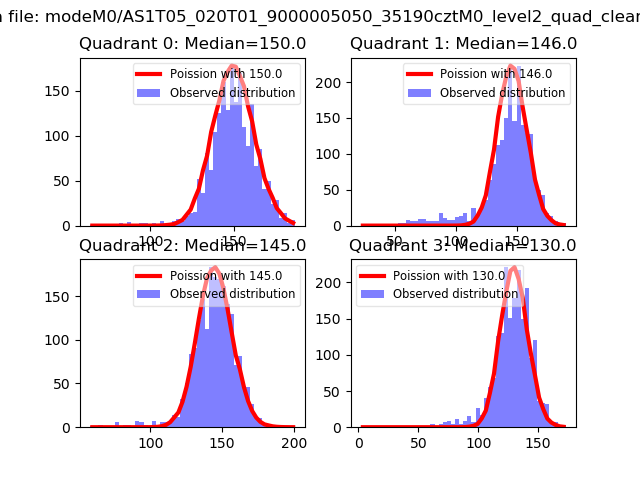 |
 |
| Quadrant-wise count rates Data is divided into 100 sec bins |
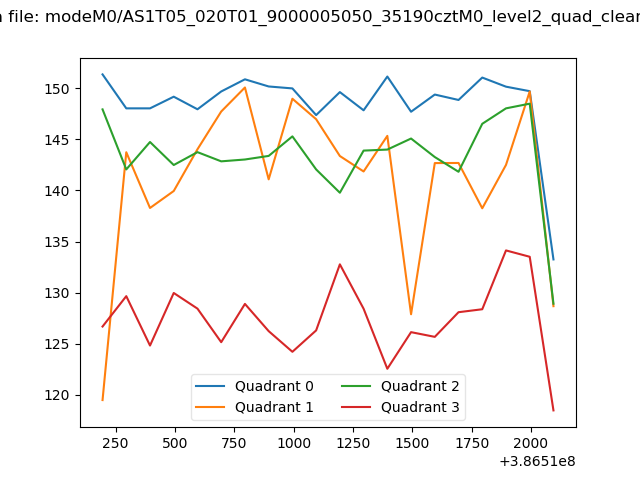 |
|
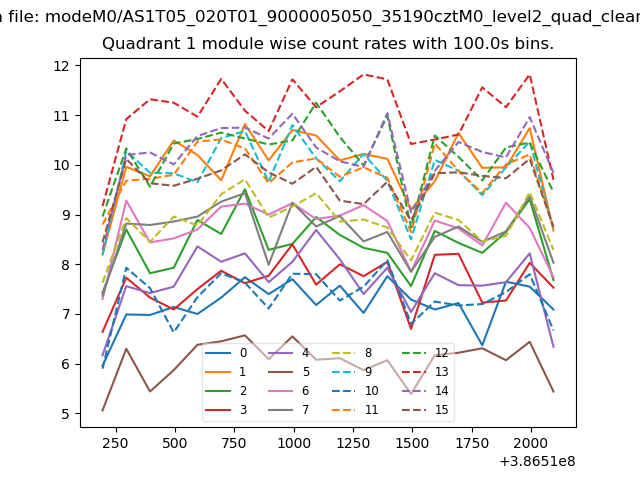
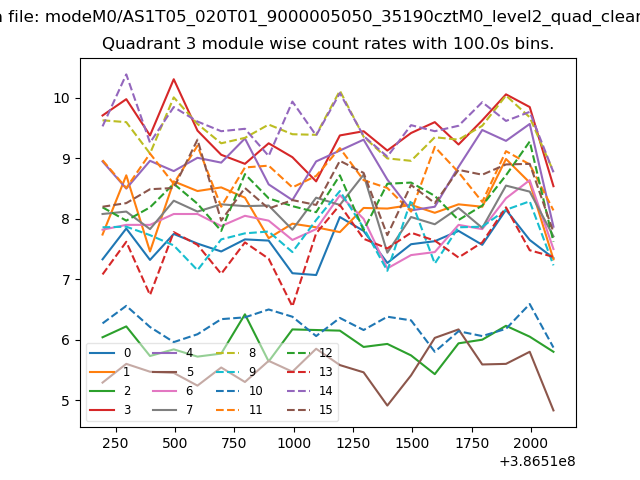
| Module-wise count rates for Quadrant A Data is divided into 100 sec bins |
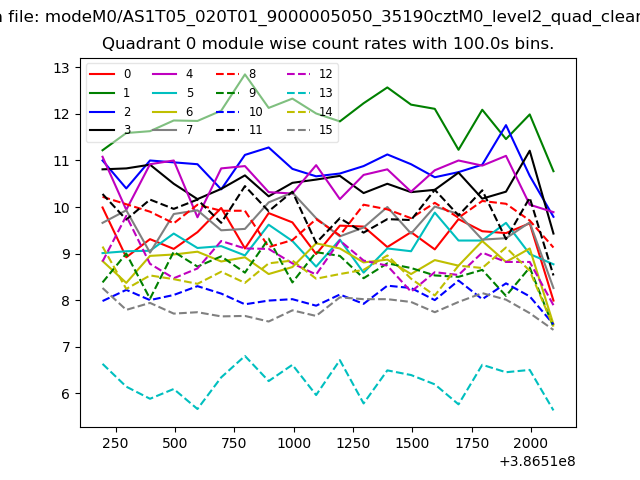 |
 |
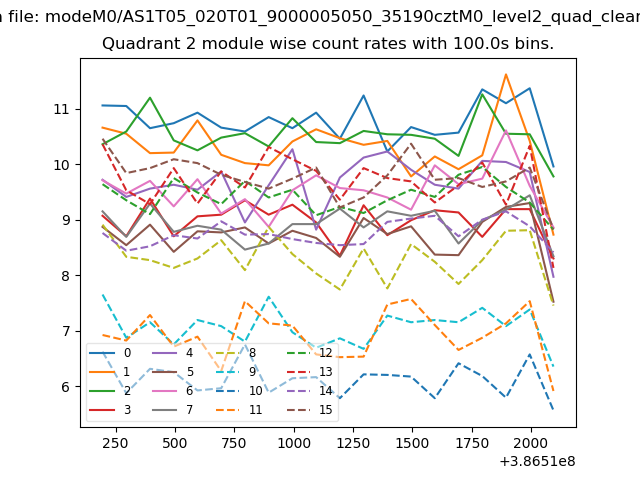
| Module-wise count rates for Quadrant B Data is divided into 100 sec bins |
 |
 |
| Module-wise count rates for Quadrant C Data is divided into 100 sec bins |
 |
 |
| Module-wise count rates for Quadrant D Data is divided into 100 sec bins |
 |
 |
| Parameter | Plot |
|---|---|
| CZT HV Monitor | 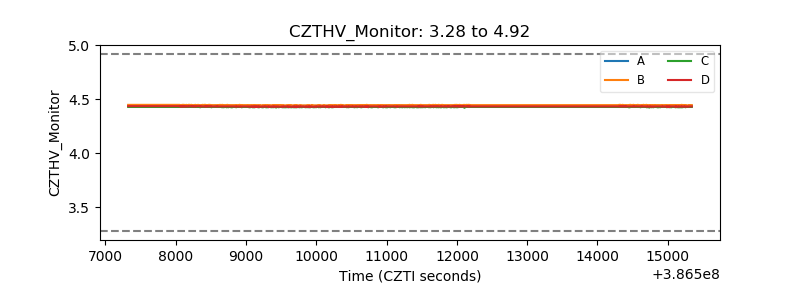 |
| D_VDD | 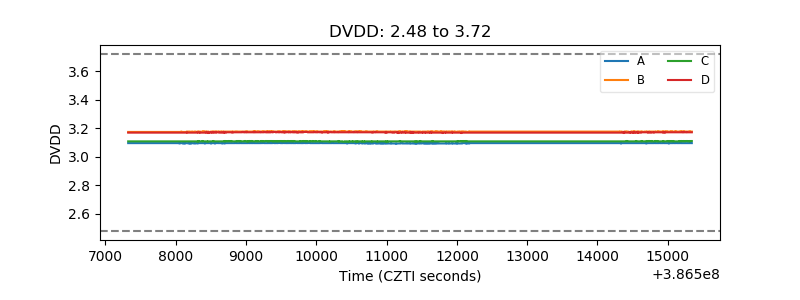 |
| Temperature 1 | 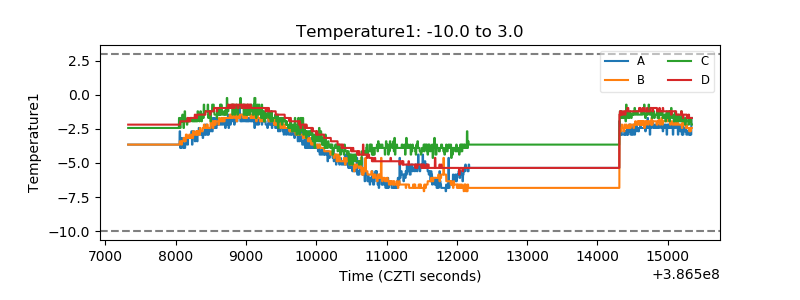 |
| Veto HV Monitor | 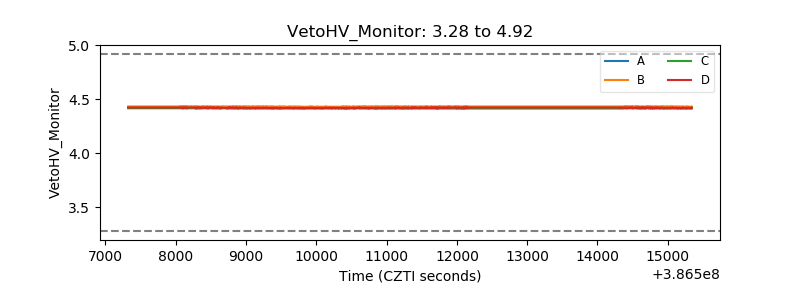 |
| Veto LLD | 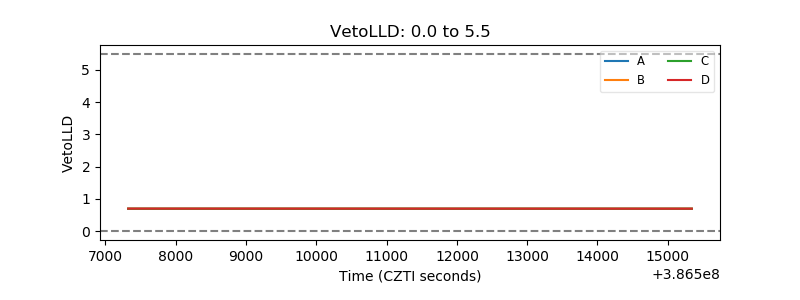 |
| Alpha Counter | 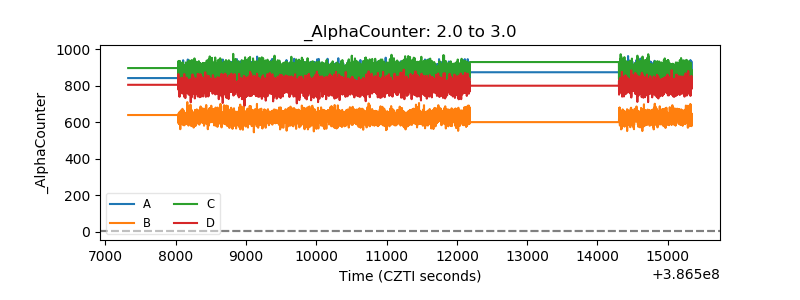 |
| _CPM_Rate | 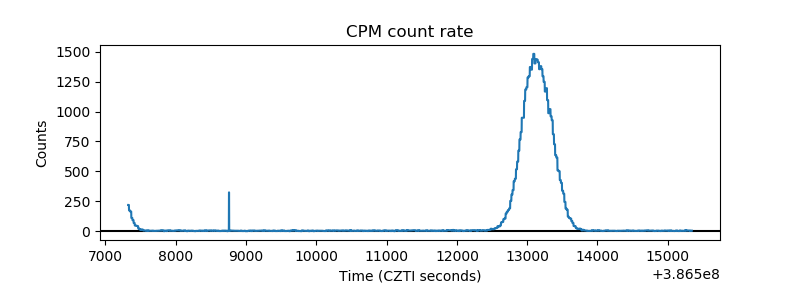 |
| CZT Counter | 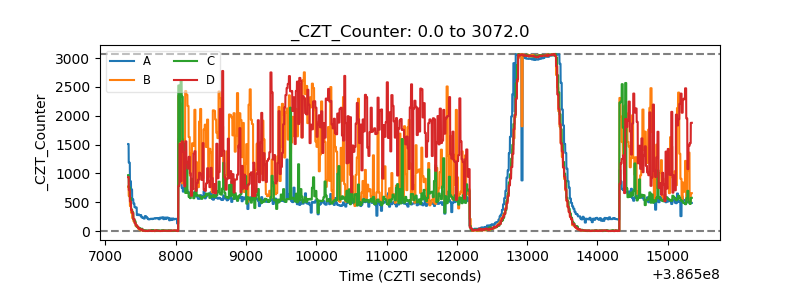 |
| +2.5 Volts monitor |  |
| +5 Volts monitor |  |
| _ROLL_ROT | 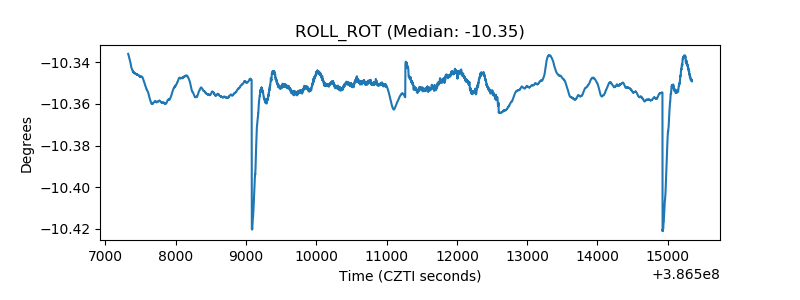 |
| _Roll_DEC | 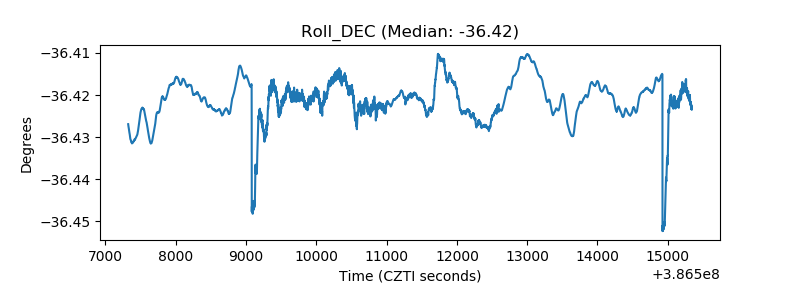 |
| _Roll_RA | 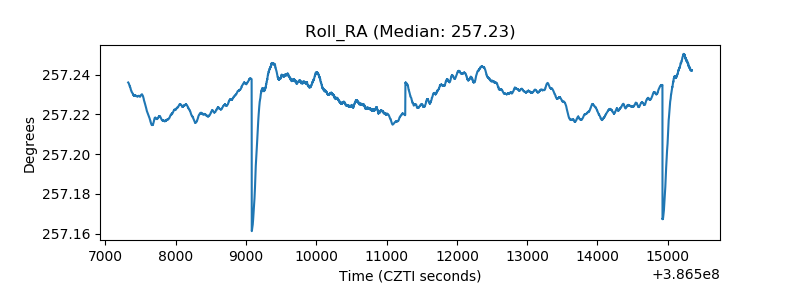 |
| Veto Counter | 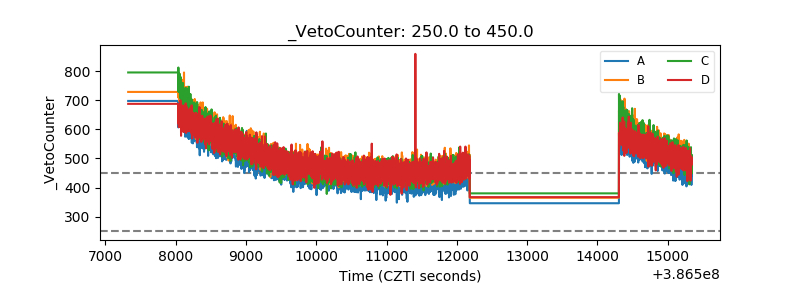 |