| Param | Original file | Final file |
|---|---|---|
| Filename | modeM0/AS1C07_004T01_9000005052cztM0_level2.fits | modeM0/AS1C07_004T01_9000005052cztM0_level2_quad_clean.evt |
| Size (bytes) | 27,092,160 | 10,578,240 |
| Size | 25.8 MB | 10.1 MB |
| Events in quadrant A | 186,682 | 43,295 |
| Events in quadrant B | 144,754 | 23,467 |
| Events in quadrant C | 175,322 | 41,651 |
| Events in quadrant D | 133,746 | 31,300 |
| Mode M0 | |||
|---|---|---|---|
| Quadrant | BADHDUFLAG | Total packets | Discarded packets |
| A | 0 | 6064 | 0 |
| B | 0 | 12479 | 0 |
| C | 0 | 6165 | 0 |
| D | 0 | 13491 | 0 |
| Mode SS | |||
|---|---|---|---|
| Quadrant | BADHDUFLAG | Total packets | Discarded packets |
| A | 0 | 50 | 0 |
| B | 0 | 50 | 0 |
| C | 0 | 50 | 0 |
| D | 0 | 50 | 0 |
| Mode M9 | |||
|---|---|---|---|
| Quadrant | BADHDUFLAG | Total packets | Discarded packets |
| A | 0 | 13 | 0 |
| B | 0 | 13 | 0 |
| C | 0 | 13 | 0 |
| D | 0 | 14 | 0 |
| Quadrant | Total seconds | Saturated seconds | Saturation percentage |
|---|---|---|---|
| A | 2498 | 31 | 1.240993% |
| B | 2498 | 887 | 35.508407% |
| C | 2498 | 74 | 2.962370% |
| D | 2498 | 760 | 30.424339% |
Noise dominated data is calculated using 1-second bins in cleaned event files. If a bin has >2000 counts, and if more than 50% of those come from <1% of pixels, then it is considered to be noise-dominated and hence unusable.
| Quadrant | # 1 sec bins | Bins with >0 counts | Bins with >2000 counts | High rate bins dominated by noise | Noise dominated (total time) | Noise dominated (detector-on time) | Marked lightcurve |
|---|---|---|---|---|---|---|---|
| A | 2497 | 2497 | 0 | 0 | 0.00% | 0.00% |  |
| B | 2496 | 2495 | 0 | 0 | 0.00% | 0.00% |  |
| C | 2497 | 2494 | 0 | 0 | 0.00% | 0.00% |  |
| D | 2497 | 2495 | 0 | 0 | 0.00% | 0.00% |  |
Top three noisy pixels from each quadrant. If the there are fewer than three noisy pixels in the level2.evt file, extra rows are filled as -1
| Pixel properties | Quadrant properties | ||||||
|---|---|---|---|---|---|---|---|
| Quadrant | DetID | PixID | Counts | Sigma | Mean | Median | Sigma |
| A | 0 | 29 | 156 | 8.23 | 48 | 47 | 13.2 |
| A | 14 | 79 | 155 | 8.15 | 48 | 47 | 13.2 |
| A | 9 | 19 | 155 | 8.15 | 48 | 47 | 13.2 |
| B | 5 | 128 | 121 | 8.7 | 38 | 37 | 9.7 |
| B | 14 | 254 | 105 | 7.04 | 38 | 37 | 9.7 |
| B | 2 | 9 | 102 | 6.73 | 38 | 37 | 9.7 |
| C | 1 | 80 | 150 | 7.86 | 46 | 44 | 13.5 |
| C | 1 | 81 | 146 | 7.56 | 46 | 44 | 13.5 |
| C | 7 | 233 | 130 | 6.37 | 46 | 44 | 13.5 |
| D | 6 | 62 | 118 | 7.2 | 38 | 35 | 11.5 |
| D | 10 | 63 | 110 | 6.51 | 38 | 35 | 11.5 |
| D | 4 | 12 | 108 | 6.33 | 38 | 35 | 11.5 |
Histogram calculated using DETX and DETY for each event in the final _common_clean file
| Quadrant A | 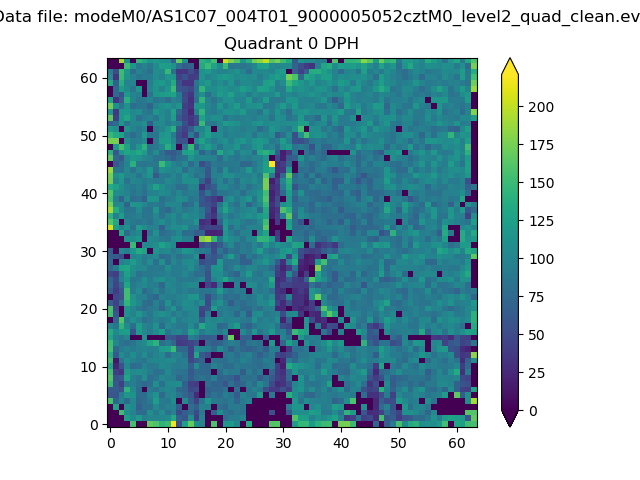 |
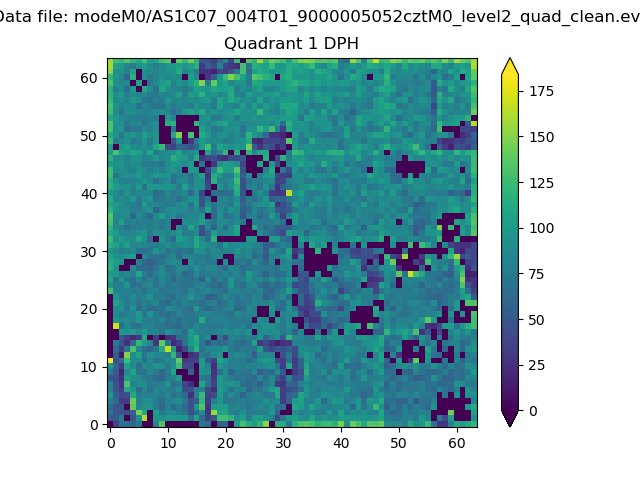 |
Quadrant B |
|---|---|---|---|
| Quadrant D |  |
 |
Quadrant C |
| Plot type | Count rate plots | Images |
|---|---|---|
| Comparison with Poisson distribution Blue bars denote a histogram of data divided into 1 sec bins. Red curve is a Poisson curve with rate = median count rate of data. |
 |
 |
| Quadrant-wise count rates Data is divided into 100 sec bins |
 |
|
| Module-wise count rates for Quadrant A Data is divided into 100 sec bins |
 |
 |
| Module-wise count rates for Quadrant B Data is divided into 100 sec bins |
 |
 |
| Module-wise count rates for Quadrant C Data is divided into 100 sec bins |
 |
 |
| Module-wise count rates for Quadrant D Data is divided into 100 sec bins |
 |
 |
| Parameter | Plot |
|---|---|
| CZT HV Monitor |  |
| D_VDD | 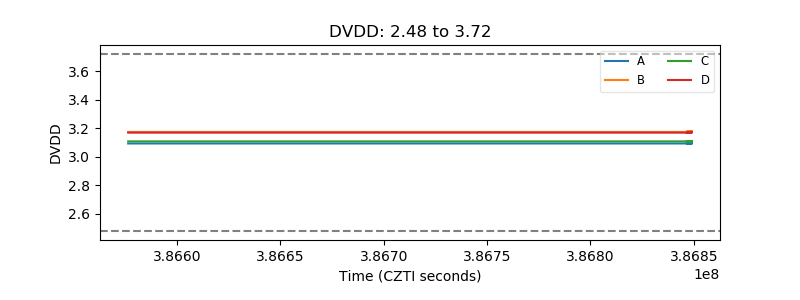 |
| Temperature 1 |  |
| Veto HV Monitor |  |
| Veto LLD |  |
| Alpha Counter |  |
| _CPM_Rate |  |
| CZT Counter |  |
| +2.5 Volts monitor |  |
| +5 Volts monitor |  |
| _ROLL_ROT |  |
| _Roll_DEC |  |
| _Roll_RA |  |
| Veto Counter |  |