| Param | Original file | Final file |
|---|---|---|
| Filename | modeM0/AS1A11_047T09_9000005054cztM0_level2.fits | modeM0/AS1A11_047T09_9000005054cztM0_level2_quad_clean.evt |
| Size (bytes) | 742,475,520 | 672,886,080 |
| Size | 708.1 MB | 641.7 MB |
| Events in quadrant A | 4,819,524 | 4,523,507 |
| Events in quadrant B | 3,818,968 | 2,909,679 |
| Events in quadrant C | 4,614,928 | 4,219,872 |
| Events in quadrant D | 3,741,530 | 3,248,567 |
| Mode M9 | |||
|---|---|---|---|
| Quadrant | BADHDUFLAG | Total packets | Discarded packets |
| A | 0 | 316 | 0 |
| B | 0 | 316 | 0 |
| C | 0 | 316 | 0 |
| D | 0 | 316 | 0 |
| Mode M0 | |||
|---|---|---|---|
| Quadrant | BADHDUFLAG | Total packets | Discarded packets |
| A | 0 | 171341 | 0 |
| B | 0 | 386929 | 0 |
| C | 0 | 189913 | 0 |
| D | 0 | 306520 | 0 |
| Mode SS | |||
|---|---|---|---|
| Quadrant | BADHDUFLAG | Total packets | Discarded packets |
| A | 0 | 1630 | 0 |
| B | 0 | 1630 | 0 |
| C | 0 | 1630 | 0 |
| D | 0 | 1630 | 0 |
| Quadrant | Total seconds | Saturated seconds | Saturation percentage |
|---|---|---|---|
| A | 79814 | 733 | 0.918385% |
| B | 79814 | 26717 | 33.474077% |
| C | 79814 | 2138 | 2.678728% |
| D | 79814 | 12341 | 15.462200% |
Noise dominated data is calculated using 1-second bins in cleaned event files. If a bin has >2000 counts, and if more than 50% of those come from <1% of pixels, then it is considered to be noise-dominated and hence unusable.
| Quadrant | # 1 sec bins | Bins with >0 counts | Bins with >2000 counts | High rate bins dominated by noise | Noise dominated (total time) | Noise dominated (detector-on time) | Marked lightcurve |
|---|---|---|---|---|---|---|---|
| A | 111460 | 79795 | 0 | 0 | 0.00% | 0.00% |  |
| B | 111460 | 79494 | 0 | 0 | 0.00% | 0.00% |  |
| C | 111460 | 79796 | 0 | 0 | 0.00% | 0.00% |  |
| D | 111460 | 79259 | 0 | 0 | 0.00% | 0.00% |  |
Top three noisy pixels from each quadrant. If the there are fewer than three noisy pixels in the level2.evt file, extra rows are filled as -1
| Pixel properties | Quadrant properties | ||||||
|---|---|---|---|---|---|---|---|
| Quadrant | DetID | PixID | Counts | Sigma | Mean | Median | Sigma |
| A | 9 | 19 | 3973 | 9.19 | 1259 | 1187 | 303.2 |
| A | 7 | 110 | 3890 | 8.91 | 1259 | 1187 | 303.2 |
| A | 0 | 29 | 3715 | 8.34 | 1259 | 1187 | 303.2 |
| B | 2 | 9 | 3321 | 12.09 | 1011 | 969 | 194.6 |
| B | 3 | 80 | 2942 | 10.14 | 1011 | 969 | 194.6 |
| B | 2 | 8 | 2716 | 8.98 | 1011 | 969 | 194.6 |
| C | 1 | 81 | 3792 | 8.5 | 1218 | 1146 | 311.3 |
| C | 1 | 80 | 3712 | 8.24 | 1218 | 1146 | 311.3 |
| C | 3 | 202 | 3629 | 7.98 | 1218 | 1146 | 311.3 |
| D | 10 | 113 | 2816 | 6.49 | 1072 | 982 | 282.4 |
| D | 10 | 189 | 2722 | 6.16 | 1072 | 982 | 282.4 |
| D | 6 | 67 | 2675 | 5.99 | 1072 | 982 | 282.4 |
Histogram calculated using DETX and DETY for each event in the final _common_clean file
| Quadrant A | 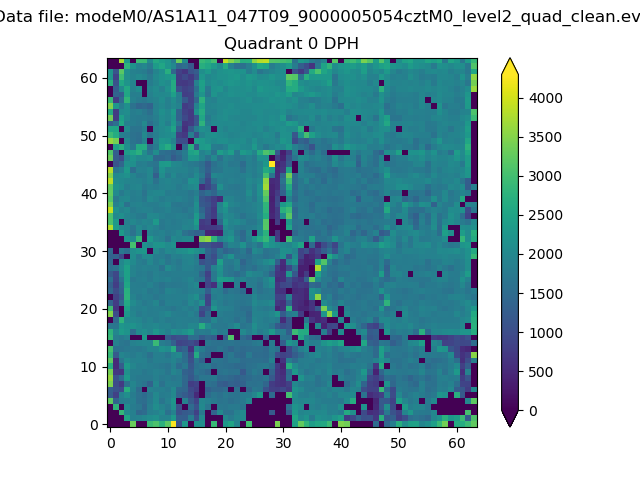 |
 |
Quadrant B |
|---|---|---|---|
| Quadrant D |  |
 |
Quadrant C |
| Plot type | Count rate plots | Images |
|---|---|---|
| Comparison with Poisson distribution Blue bars denote a histogram of data divided into 1 sec bins. Red curve is a Poisson curve with rate = median count rate of data. |
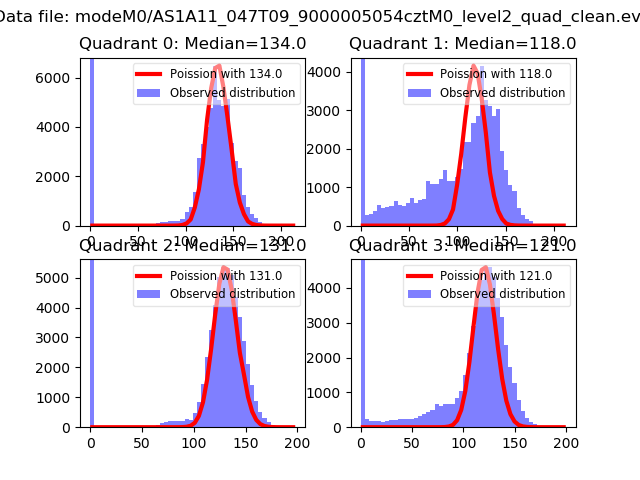 |
 |
| Quadrant-wise count rates Data is divided into 100 sec bins |
 |
|
| Module-wise count rates for Quadrant A Data is divided into 100 sec bins |
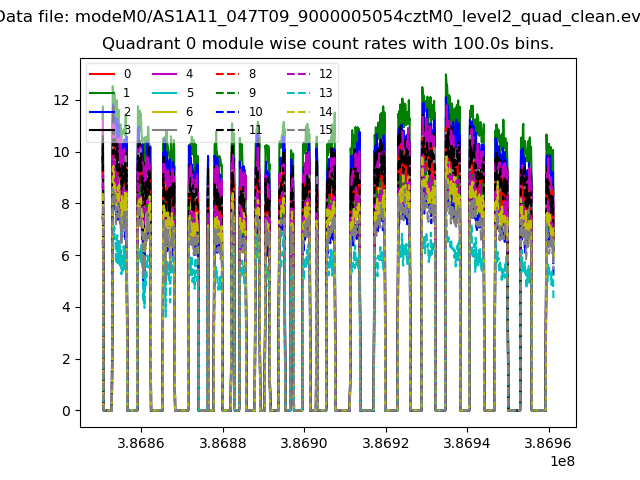 |
 |
| Module-wise count rates for Quadrant B Data is divided into 100 sec bins |
 |
 |
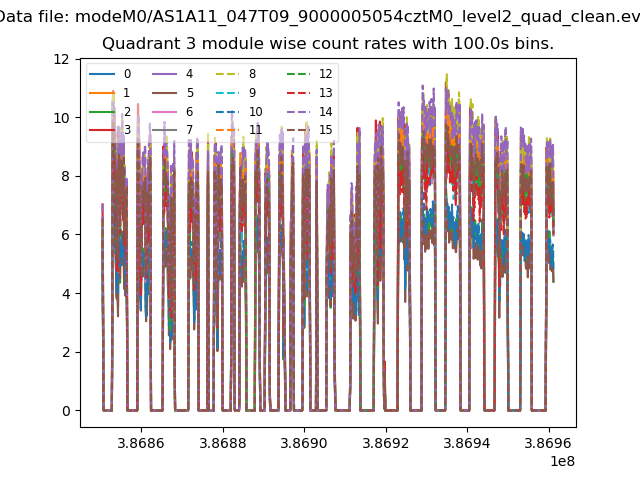
| Module-wise count rates for Quadrant C Data is divided into 100 sec bins |
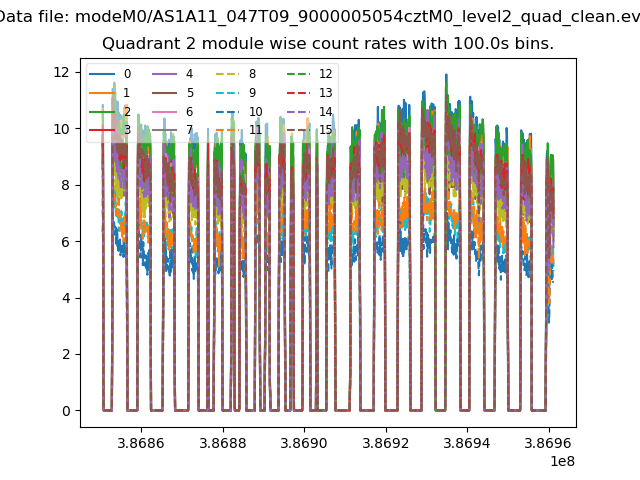 |
 |
| Module-wise count rates for Quadrant D Data is divided into 100 sec bins |
 |
 |
| Parameter | Plot |
|---|---|
| CZT HV Monitor |  |
| D_VDD |  |
| Temperature 1 |  |
| Veto HV Monitor |  |
| Veto LLD |  |
| Alpha Counter | 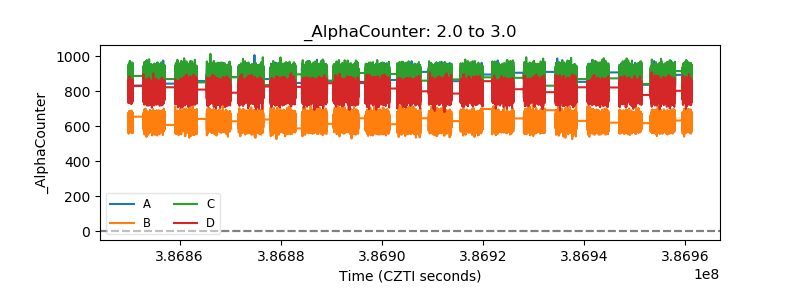 |
| _CPM_Rate |  |
| CZT Counter |  |
| +2.5 Volts monitor |  |
| +5 Volts monitor |  |
| _ROLL_ROT |  |
| _Roll_DEC | 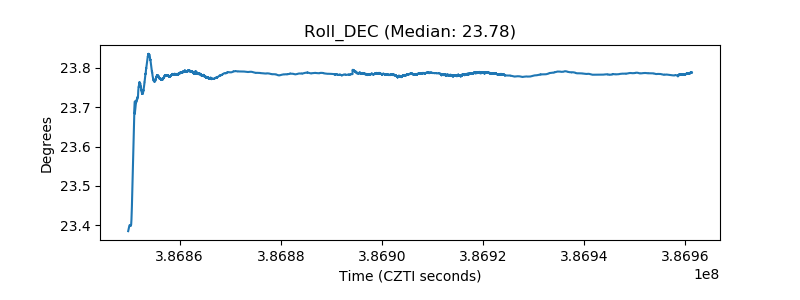 |
| _Roll_RA |  |
| Veto Counter |  |