| Param | Original file | Final file |
|---|---|---|
| Filename | modeM0/AS1A11_082T01_9000005056cztM0_level2.fits | modeM0/AS1A11_082T01_9000005056cztM0_level2_quad_clean.evt |
| Size (bytes) | 691,418,880 | 717,189,120 |
| Size | 659.4 MB | 684.0 MB |
| Events in quadrant A | 2,972,068 | 3,216,417 |
| Events in quadrant B | 2,547,918 | 2,808,945 |
| Events in quadrant C | 2,874,574 | 2,978,482 |
| Events in quadrant D | 2,425,456 | 2,623,389 |
| Mode M0 | |||
|---|---|---|---|
| Quadrant | BADHDUFLAG | Total packets | Discarded packets |
| A | 0 | 306372 | 0 |
| B | 0 | 667538 | 0 |
| C | 0 | 378311 | 0 |
| D | 0 | 481319 | 0 |
| Mode SS | |||
|---|---|---|---|
| Quadrant | BADHDUFLAG | Total packets | Discarded packets |
| A | 0 | 3002 | 0 |
| B | 0 | 3002 | 0 |
| C | 0 | 3002 | 0 |
| D | 0 | 3002 | 0 |
| Mode M9 | |||
|---|---|---|---|
| Quadrant | BADHDUFLAG | Total packets | Discarded packets |
| A | 0 | 535 | 0 |
| B | 0 | 535 | 0 |
| C | 0 | 535 | 0 |
| D | 0 | 535 | 0 |
| Quadrant | Total seconds | Saturated seconds | Saturation percentage |
|---|---|---|---|
| A | 147116 | 313 | 0.212757% |
| B | 147116 | 44699 | 30.383507% |
| C | 147116 | 3890 | 2.644172% |
| D | 147116 | 16376 | 11.131352% |
Noise dominated data is calculated using 1-second bins in cleaned event files. If a bin has >2000 counts, and if more than 50% of those come from <1% of pixels, then it is considered to be noise-dominated and hence unusable.
| Quadrant | # 1 sec bins | Bins with >0 counts | Bins with >2000 counts | High rate bins dominated by noise | Noise dominated (total time) | Noise dominated (detector-on time) | Marked lightcurve |
|---|---|---|---|---|---|---|---|
| A | 73041 | 49571 | 0 | 0 | 0.00% | 0.00% |  |
| B | 73025 | 49343 | 0 | 0 | 0.00% | 0.00% |  |
| C | 73041 | 49597 | 0 | 0 | 0.00% | 0.00% |  |
| D | 73041 | 49527 | 0 | 0 | 0.00% | 0.00% | 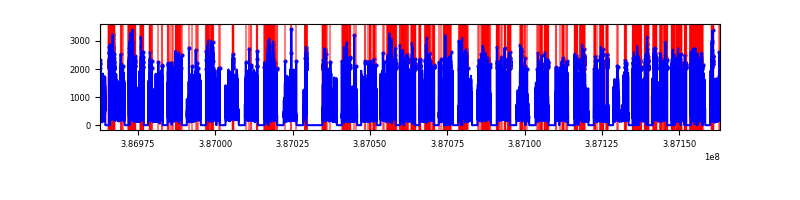 |
Top three noisy pixels from each quadrant. If the there are fewer than three noisy pixels in the level2.evt file, extra rows are filled as -1
| Pixel properties | Quadrant properties | ||||||
|---|---|---|---|---|---|---|---|
| Quadrant | DetID | PixID | Counts | Sigma | Mean | Median | Sigma |
| A | 9 | 19 | 2425 | 8.94 | 777 | 731 | 189.5 |
| A | 7 | 110 | 2357 | 8.58 | 777 | 731 | 189.5 |
| A | 0 | 29 | 2357 | 8.58 | 777 | 731 | 189.5 |
| B | 2 | 9 | 2110 | 11.12 | 674 | 644 | 131.8 |
| B | 3 | 80 | 1961 | 9.99 | 674 | 644 | 131.8 |
| B | 3 | 17 | 1807 | 8.82 | 674 | 644 | 131.8 |
| C | 1 | 81 | 2407 | 8.7 | 760 | 716 | 194.3 |
| C | 1 | 80 | 2304 | 8.17 | 760 | 716 | 194.3 |
| C | 3 | 202 | 2253 | 7.91 | 760 | 716 | 194.3 |
| D | 6 | 231 | 1776 | 6.29 | 695 | 639 | 180.6 |
| D | 7 | 3 | 1752 | 6.16 | 695 | 639 | 180.6 |
| D | 4 | 160 | 1727 | 6.02 | 695 | 639 | 180.6 |
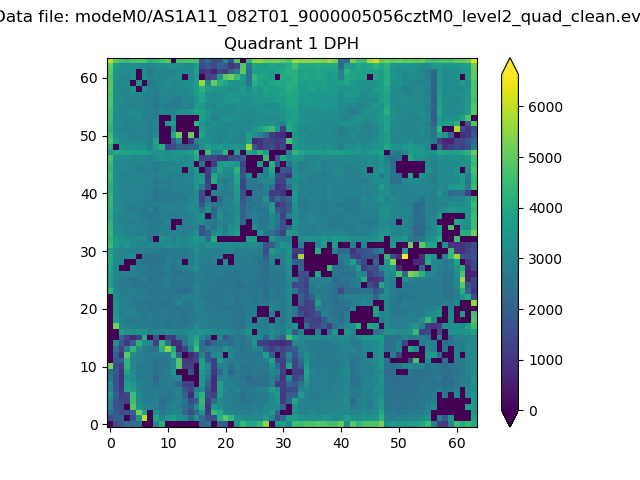
Histogram calculated using DETX and DETY for each event in the final _common_clean file
| Quadrant A |  |
 |
Quadrant B |
|---|---|---|---|
| Quadrant D |  |
 |
Quadrant C |
| Plot type | Count rate plots | Images |
|---|---|---|
| Comparison with Poisson distribution Blue bars denote a histogram of data divided into 1 sec bins. Red curve is a Poisson curve with rate = median count rate of data. |
 |
 |
| Quadrant-wise count rates Data is divided into 100 sec bins |
 |
|
| Module-wise count rates for Quadrant A Data is divided into 100 sec bins |
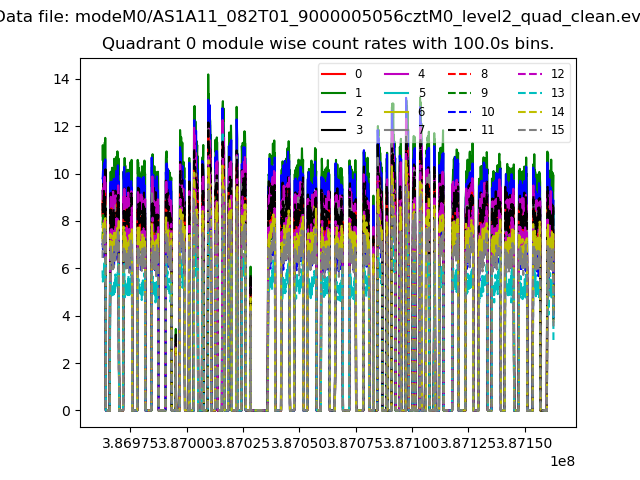 |
 |
| Module-wise count rates for Quadrant B Data is divided into 100 sec bins |
 |
 |
| Module-wise count rates for Quadrant C Data is divided into 100 sec bins |
 |
 |
| Module-wise count rates for Quadrant D Data is divided into 100 sec bins |
 |
 |
| Parameter | Plot |
|---|---|
| CZT HV Monitor |  |
| D_VDD |  |
| Temperature 1 |  |
| Veto HV Monitor |  |
| Veto LLD |  |
| Alpha Counter |  |
| _CPM_Rate |  |
| CZT Counter |  |
| +2.5 Volts monitor |  |
| +5 Volts monitor |  |
| _ROLL_ROT |  |
| _Roll_DEC |  |
| _Roll_RA |  |
| Veto Counter |  |