| Param | Original file | Final file |
|---|---|---|
| Filename | modeM0/AS1A11_082T01_9000005056_35271cztM0_level2.evt | modeM0/AS1A11_082T01_9000005056_35271cztM0_level2_quad_clean.evt |
| Size (bytes) | 1,136,200,320 | 149,454,720 |
| Size | 1.1 GB | 142.5 MB |
| Events in quadrant A | 5,538,112 | 971,594 |
| Events in quadrant B | 11,924,129 | 903,375 |
| Events in quadrant C | 6,473,885 | 947,988 |
| Events in quadrant D | 9,684,669 | 893,092 |
| Mode M0 | |||
|---|---|---|---|
| Quadrant | BADHDUFLAG | Total packets | Discarded packets |
| A | 0 | 23955 | 4 |
| B | 0 | 43392 | 3 |
| C | 0 | 26123 | 3 |
| D | 0 | 36720 | 3 |
| Mode SS | |||
|---|---|---|---|
| Quadrant | BADHDUFLAG | Total packets | Discarded packets |
| A | 0 | 240 | 0 |
| B | 0 | 240 | 0 |
| C | 0 | 240 | 0 |
| D | 0 | 240 | 0 |
| Mode M9 | |||
|---|---|---|---|
| Quadrant | BADHDUFLAG | Total packets | Discarded packets |
| A | 0 | 45 | 0 |
| B | 0 | 45 | 0 |
| C | 0 | 45 | 0 |
| D | 0 | 45 | 0 |
| Quadrant | Total seconds | Saturated seconds | Saturation percentage |
|---|---|---|---|
| A | 11703 | 18 | 0.153807% |
| B | 11703 | 1923 | 16.431684% |
| C | 11703 | 155 | 1.324447% |
| D | 11703 | 990 | 8.459369% |
Noise dominated data is calculated using 1-second bins in cleaned event files. If a bin has >2000 counts, and if more than 50% of those come from <1% of pixels, then it is considered to be noise-dominated and hence unusable.
| Quadrant | # 1 sec bins | Bins with >0 counts | Bins with >2000 counts | High rate bins dominated by noise | Noise dominated (total time) | Noise dominated (detector-on time) | Marked lightcurve |
|---|---|---|---|---|---|---|---|
| A | 16182 | 11706 | 0 | 0 | 0.00% | 0.00% | 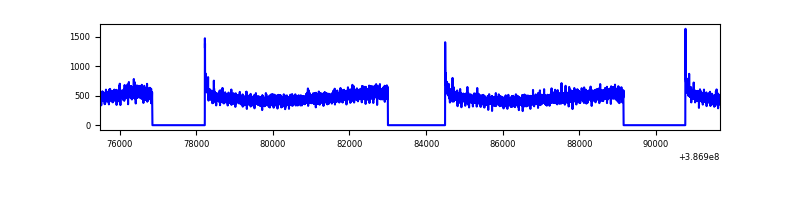 |
| B | 16182 | 11705 | 1315 | 1315 | 8.13% | 11.23% | 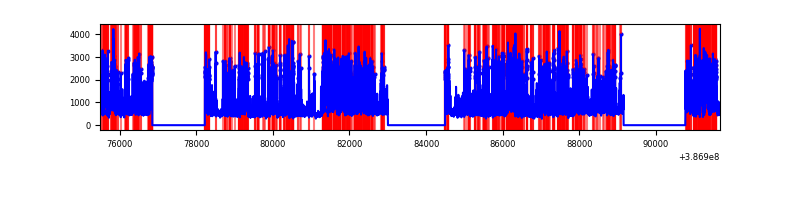 |
| C | 16182 | 11706 | 110 | 110 | 0.68% | 0.94% | 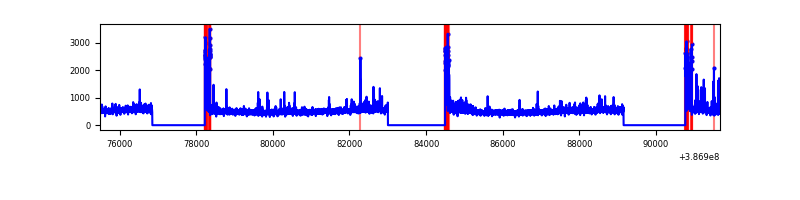 |
| D | 16182 | 11706 | 791 | 791 | 4.89% | 6.76% | 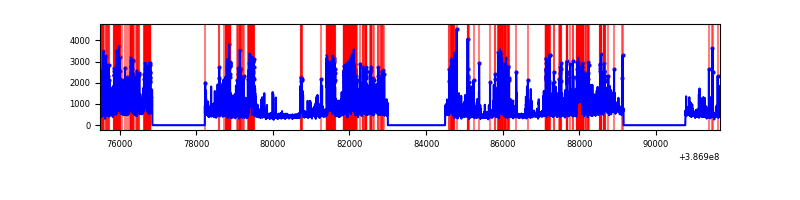 |
Top three noisy pixels from each quadrant. If the there are fewer than three noisy pixels in the level2.evt file, extra rows are filled as -1
| Pixel properties | Quadrant properties | ||||||
|---|---|---|---|---|---|---|---|
| Quadrant | DetID | PixID | Counts | Sigma | Mean | Median | Sigma |
| A | 10 | 83 | 168696 | 602.7 | 1381 | 1354 | 277.7 |
| A | 13 | 254 | 20177 | 67.79 | 1381 | 1354 | 277.7 |
| A | 13 | 6 | 19131 | 64.03 | 1381 | 1354 | 277.7 |
| B | 5 | 236 | 4762693 | 19576.99 | 1284 | 1251 | 243.2 |
| B | 5 | 172 | 1920901 | 7892.77 | 1284 | 1251 | 243.2 |
| B | 0 | 189 | 81092 | 328.27 | 1284 | 1251 | 243.2 |
| C | 0 | 10 | 575614 | 1840.78 | 1344 | 1354 | 312.0 |
| C | 15 | 214 | 484296 | 1548.06 | 1344 | 1354 | 312.0 |
| C | 9 | 187 | 48021 | 149.59 | 1344 | 1354 | 312.0 |
| D | 2 | 249 | 2648034 | 8304.21 | 1315 | 1280 | 318.7 |
| D | 13 | 249 | 681097 | 2132.93 | 1315 | 1280 | 318.7 |
| D | 8 | 195 | 456358 | 1427.81 | 1315 | 1280 | 318.7 |
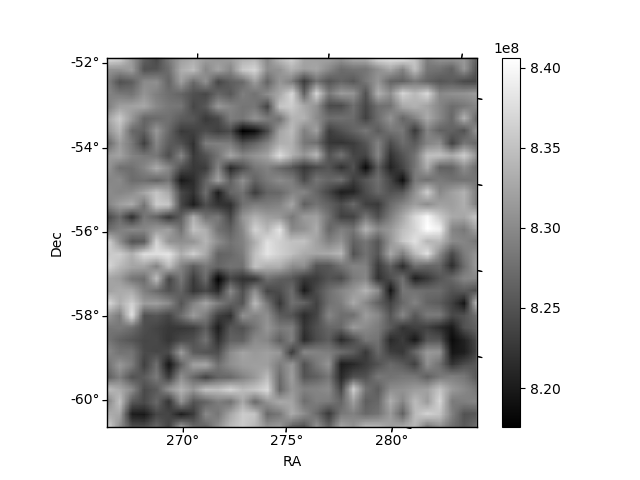
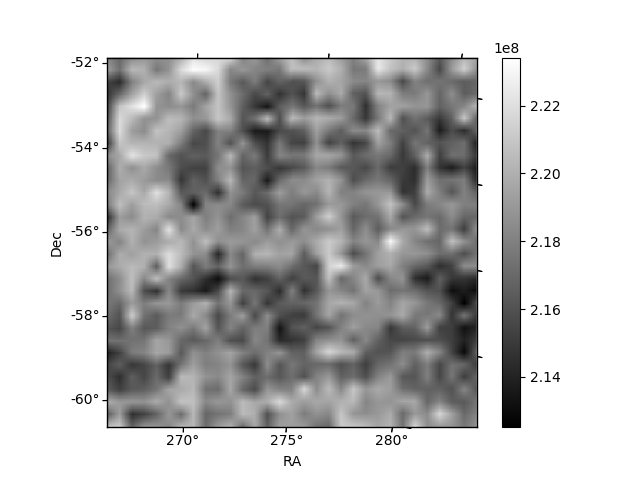
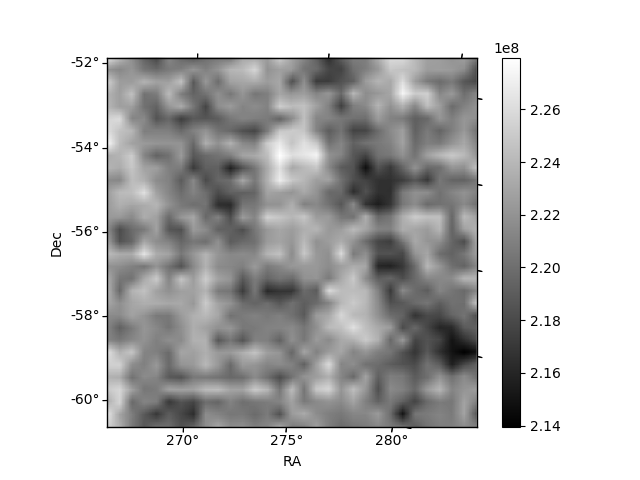
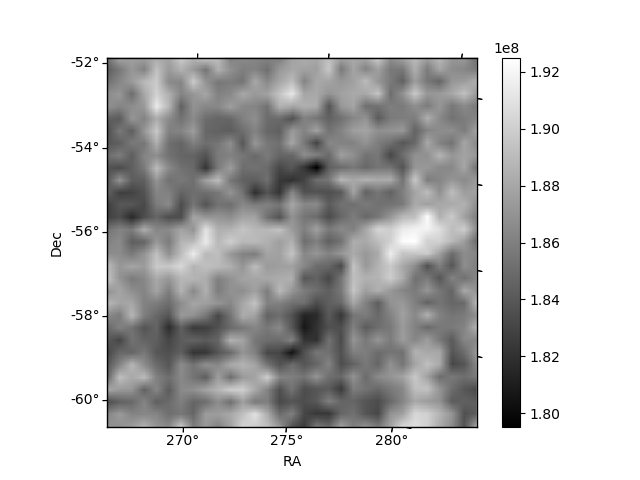
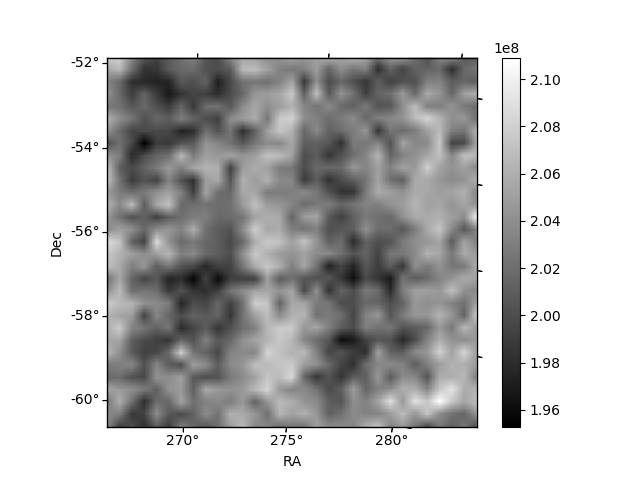
Histogram calculated using DETX and DETY for each event in the final _common_clean file
| Quadrant A | 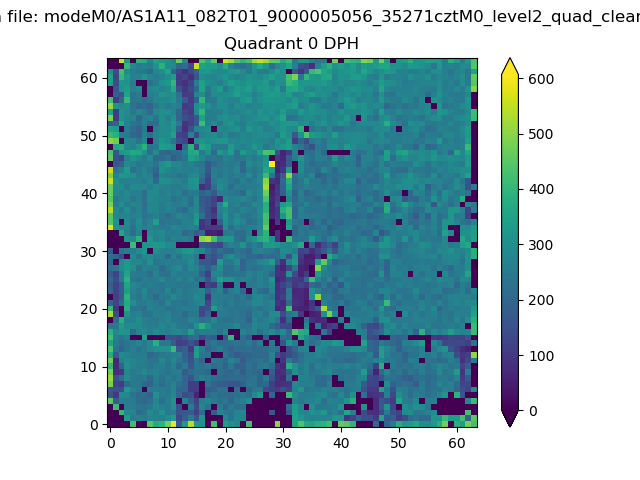 |
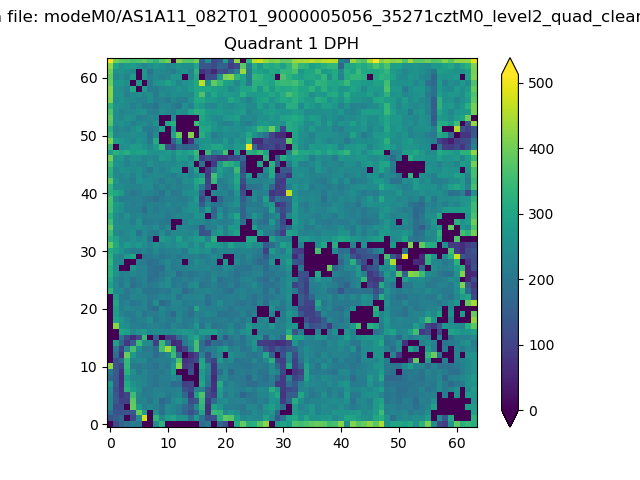 |
Quadrant B |
|---|---|---|---|
| Quadrant D | 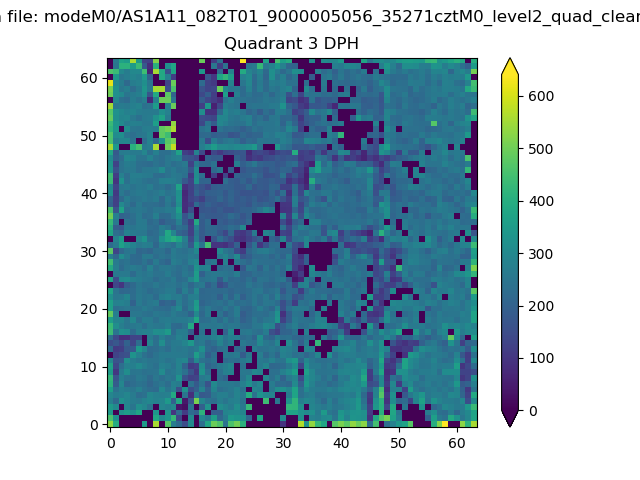 |
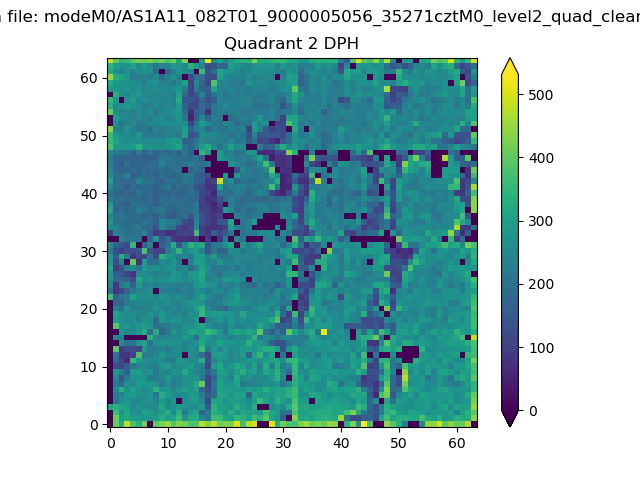 |
Quadrant C |
| Plot type | Count rate plots | Images |
|---|---|---|
| Comparison with Poisson distribution Blue bars denote a histogram of data divided into 1 sec bins. Red curve is a Poisson curve with rate = median count rate of data. |
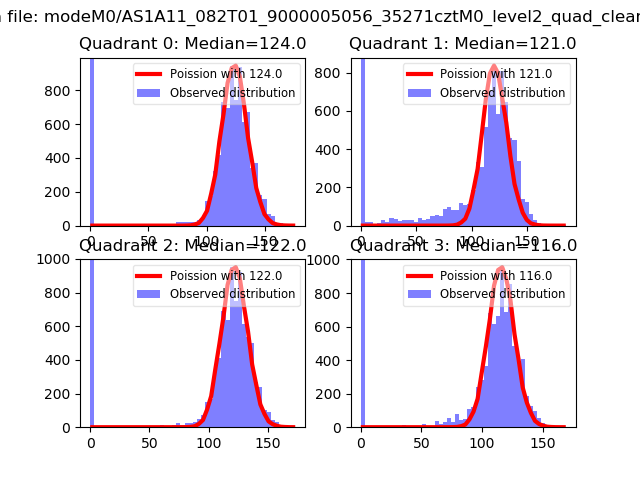 |
 |
| Quadrant-wise count rates Data is divided into 100 sec bins |
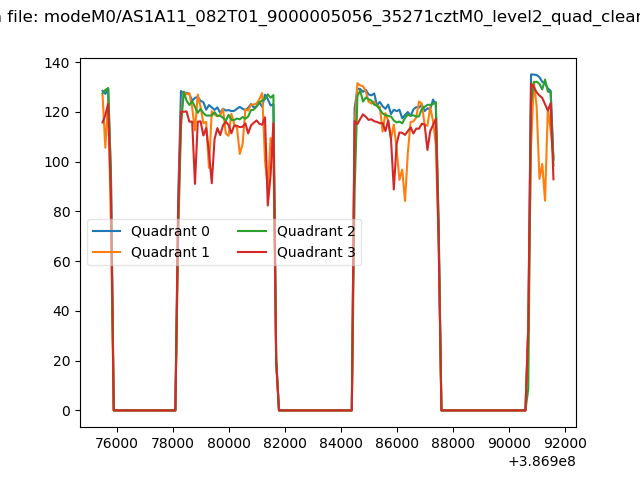 |
|
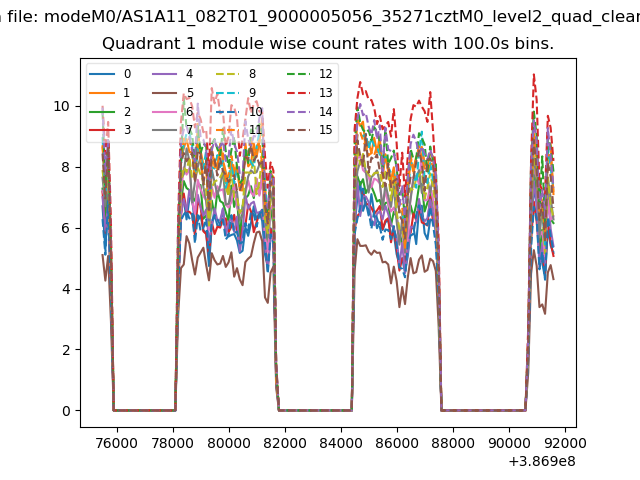
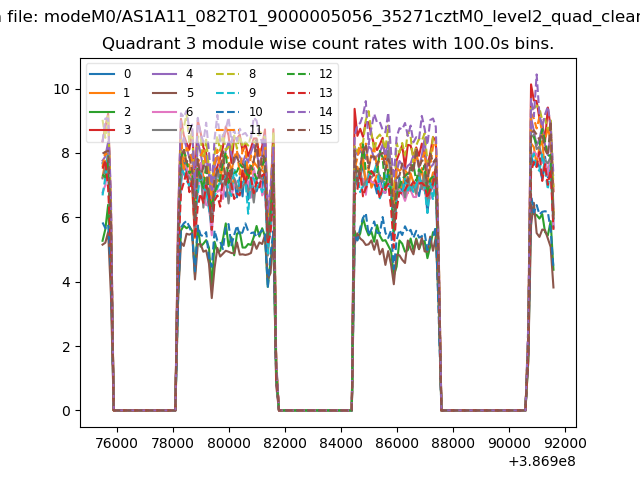
| Module-wise count rates for Quadrant A Data is divided into 100 sec bins |
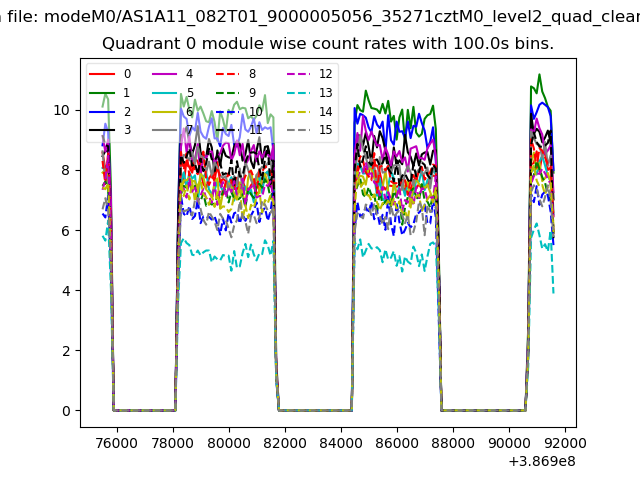 |
 |
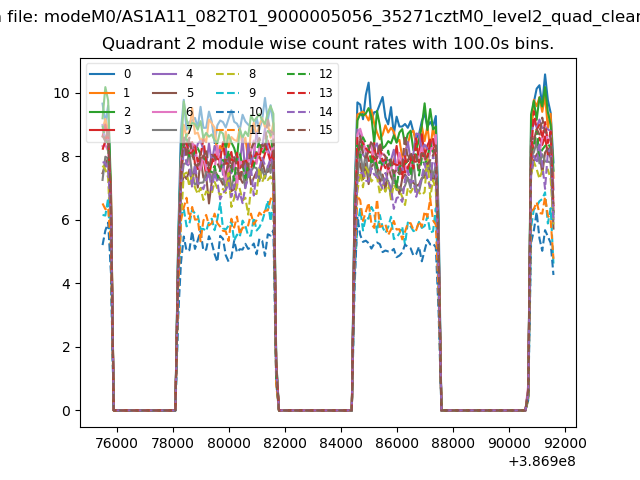
| Module-wise count rates for Quadrant B Data is divided into 100 sec bins |
 |
 |
| Module-wise count rates for Quadrant C Data is divided into 100 sec bins |
 |
 |
| Module-wise count rates for Quadrant D Data is divided into 100 sec bins |
 |
 |
| Parameter | Plot |
|---|---|
| CZT HV Monitor |  |
| D_VDD | 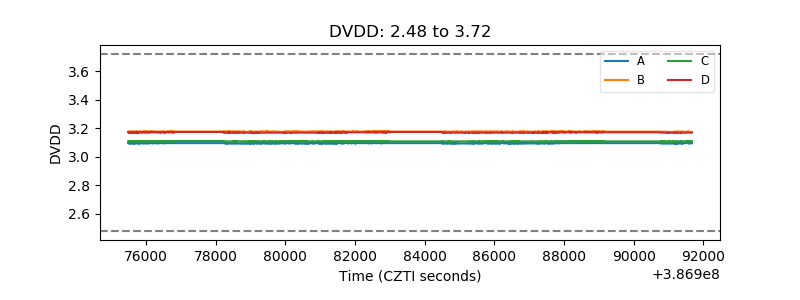 |
| Temperature 1 | 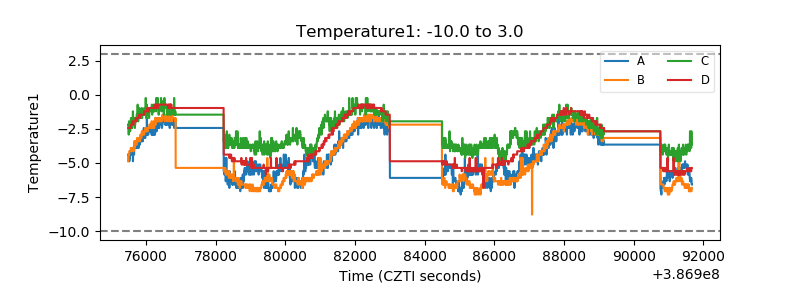 |
| Veto HV Monitor | 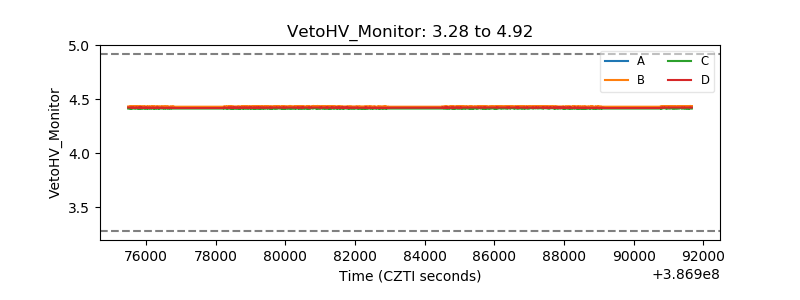 |
| Veto LLD | 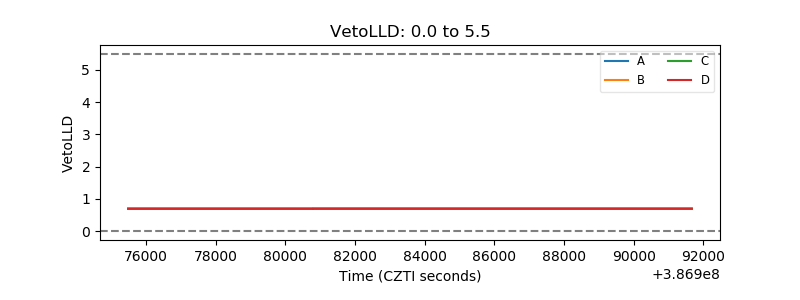 |
| Alpha Counter | 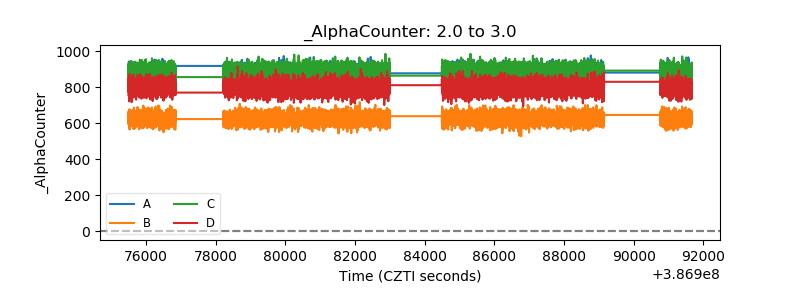 |
| _CPM_Rate |  |
| CZT Counter | 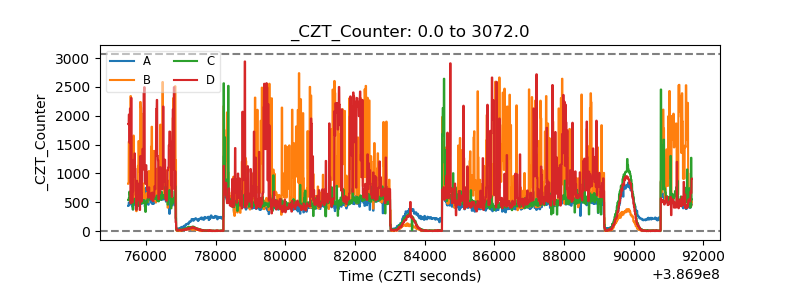 |
| +2.5 Volts monitor |  |
| +5 Volts monitor |  |
| _ROLL_ROT | 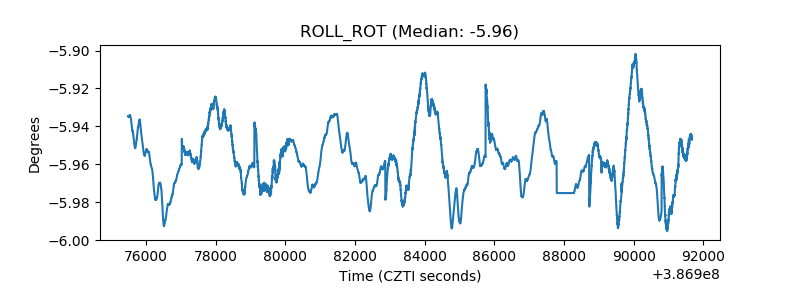 |
| _Roll_DEC | 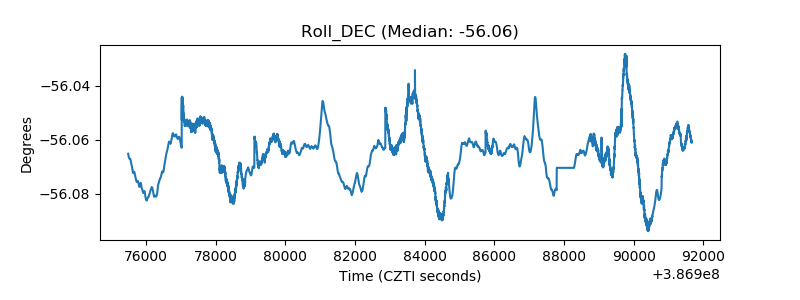 |
| _Roll_RA | 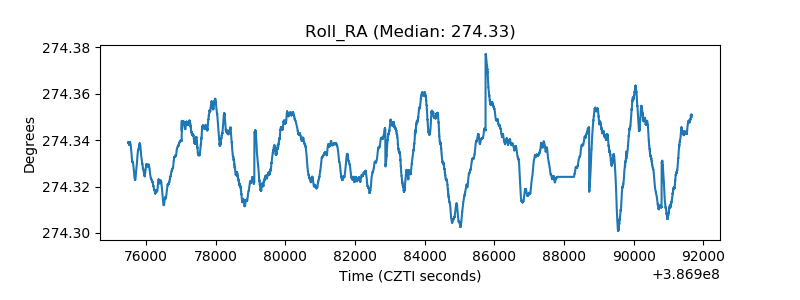 |
| Veto Counter |  |