| Param | Original file | Final file |
|---|---|---|
| Filename | modeM0/AS1A11_082T01_9000005056_35282cztM0_level2.evt | modeM0/AS1A11_082T01_9000005056_35282cztM0_level2_quad_clean.evt |
| Size (bytes) | 628,816,320 | 91,016,640 |
| Size | 599.7 MB | 86.8 MB |
| Events in quadrant A | 2,905,168 | 614,037 |
| Events in quadrant B | 6,859,437 | 549,382 |
| Events in quadrant C | 4,420,149 | 597,996 |
| Events in quadrant D | 4,444,089 | 566,162 |
| Mode M0 | |||
|---|---|---|---|
| Quadrant | BADHDUFLAG | Total packets | Discarded packets |
| A | 0 | 12605 | 3 |
| B | 0 | 24506 | 2 |
| C | 0 | 17274 | 2 |
| D | 0 | 17274 | 2 |
| Mode SS | |||
|---|---|---|---|
| Quadrant | BADHDUFLAG | Total packets | Discarded packets |
| A | 0 | 124 | 0 |
| B | 0 | 124 | 0 |
| C | 0 | 124 | 0 |
| D | 0 | 124 | 0 |
| Mode M9 | |||
|---|---|---|---|
| Quadrant | BADHDUFLAG | Total packets | Discarded packets |
| A | 0 | 26 | 0 |
| B | 0 | 26 | 0 |
| C | 0 | 26 | 0 |
| D | 0 | 26 | 0 |
| Quadrant | Total seconds | Saturated seconds | Saturation percentage |
|---|---|---|---|
| A | 6133 | 16 | 0.260884% |
| B | 6133 | 1515 | 24.702429% |
| C | 6133 | 146 | 2.380564% |
| D | 6133 | 330 | 5.380727% |
Noise dominated data is calculated using 1-second bins in cleaned event files. If a bin has >2000 counts, and if more than 50% of those come from <1% of pixels, then it is considered to be noise-dominated and hence unusable.
| Quadrant | # 1 sec bins | Bins with >0 counts | Bins with >2000 counts | High rate bins dominated by noise | Noise dominated (total time) | Noise dominated (detector-on time) | Marked lightcurve |
|---|---|---|---|---|---|---|---|
| A | 8759 | 6135 | 1 | 1 | 0.01% | 0.02% | 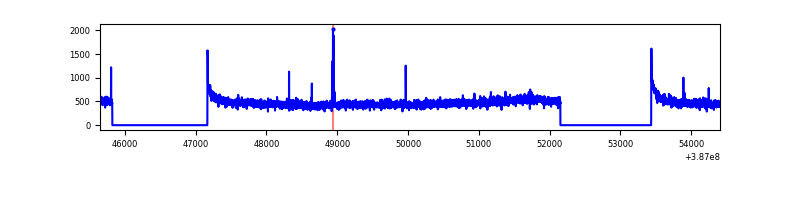 |
| B | 8759 | 6135 | 1151 | 1151 | 13.14% | 18.76% | 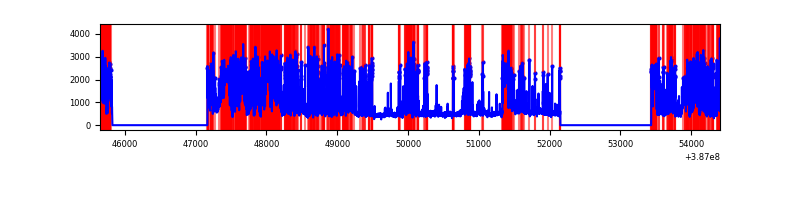 |
| C | 8759 | 6135 | 121 | 121 | 1.38% | 1.97% | 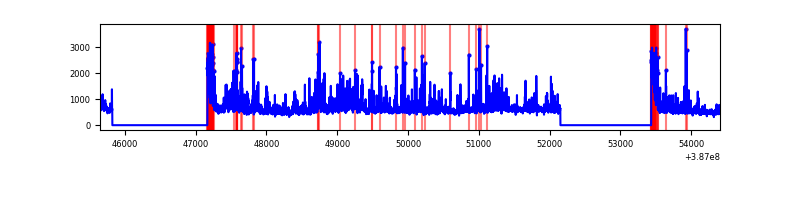 |
| D | 8759 | 6135 | 274 | 274 | 3.13% | 4.47% | 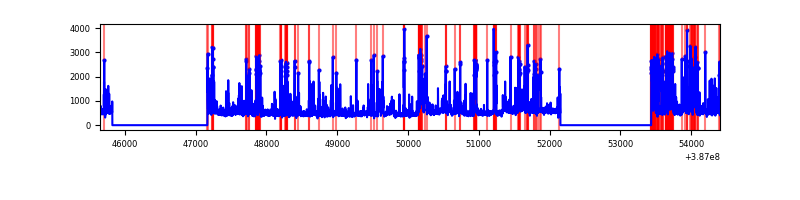 |
Top three noisy pixels from each quadrant. If the there are fewer than three noisy pixels in the level2.evt file, extra rows are filled as -1
| Pixel properties | Quadrant properties | ||||||
|---|---|---|---|---|---|---|---|
| Quadrant | DetID | PixID | Counts | Sigma | Mean | Median | Sigma |
| A | 10 | 83 | 106138 | 735.21 | 709 | 695 | 143.4 |
| A | 15 | 169 | 24709 | 167.44 | 709 | 695 | 143.4 |
| A | 13 | 6 | 21309 | 143.73 | 709 | 695 | 143.4 |
| B | 5 | 236 | 2541506 | 20746.33 | 633 | 616 | 122.5 |
| B | 5 | 172 | 1756993 | 14340.8 | 633 | 616 | 122.5 |
| B | 4 | 232 | 27744 | 221.5 | 633 | 616 | 122.5 |
| C | 4 | 254 | 841868 | 5328.37 | 681 | 687 | 157.9 |
| C | 0 | 10 | 602496 | 3812.09 | 681 | 687 | 157.9 |
| C | 15 | 214 | 251192 | 1586.8 | 681 | 687 | 157.9 |
| D | 10 | 118 | 471217 | 2827.39 | 674 | 656 | 166.4 |
| D | 7 | 80 | 425847 | 2554.78 | 674 | 656 | 166.4 |
| D | 2 | 249 | 268844 | 1611.42 | 674 | 656 | 166.4 |
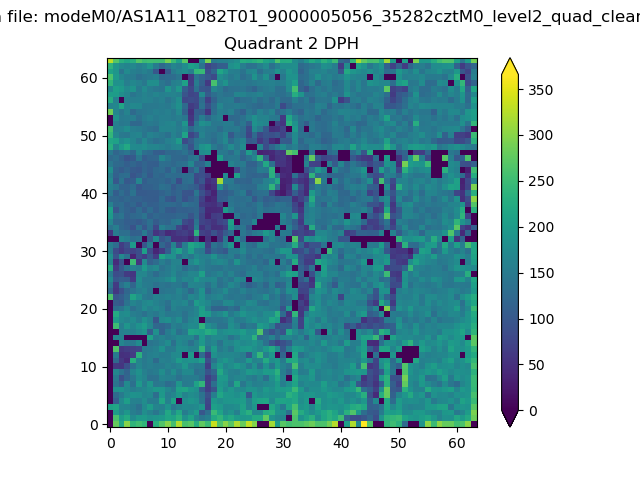
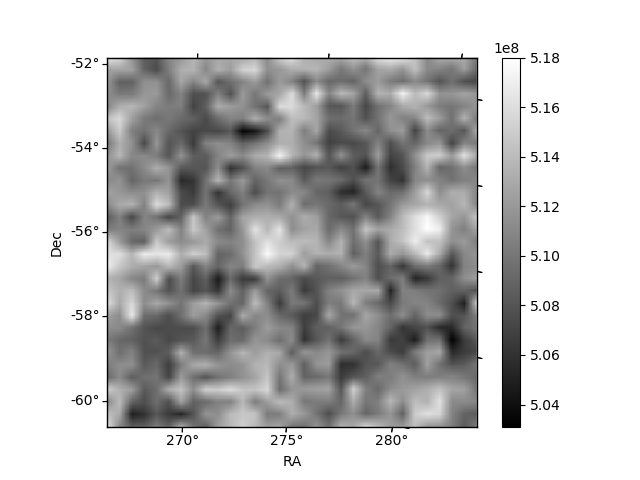
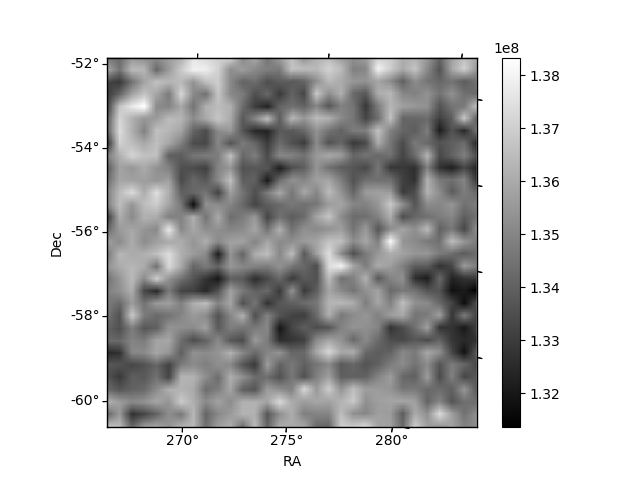
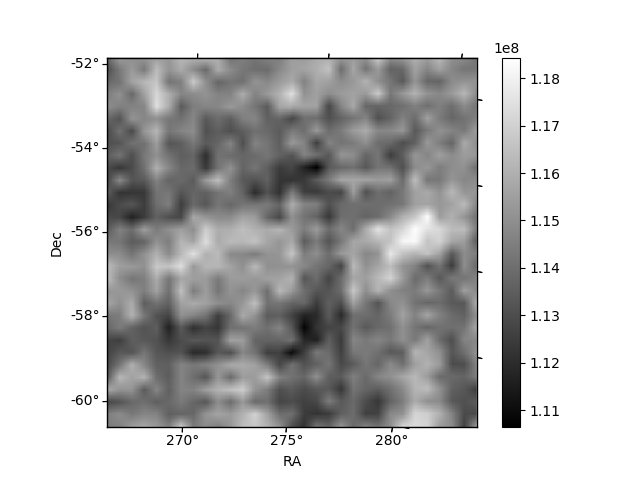
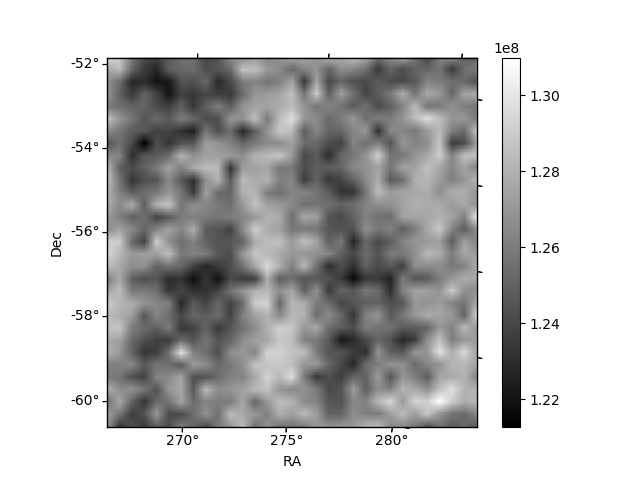
Histogram calculated using DETX and DETY for each event in the final _common_clean file
| Quadrant A | 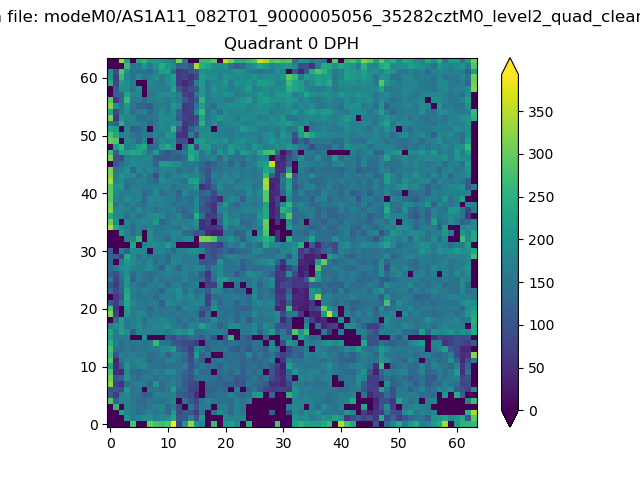 |
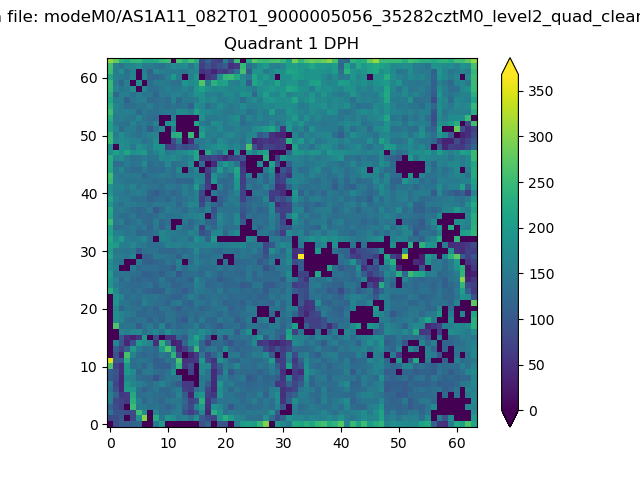 |
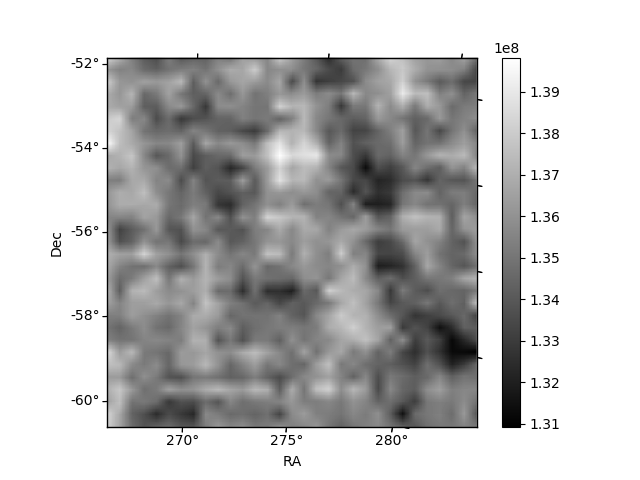
Quadrant B |
|---|---|---|---|
| Quadrant D | 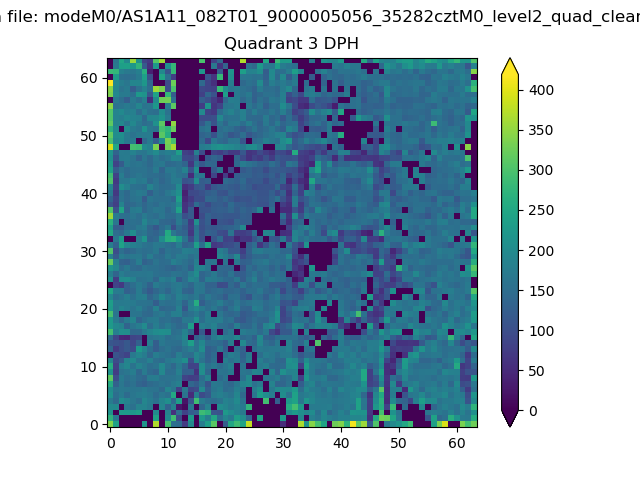 |
 |
Quadrant C |
| Plot type | Count rate plots | Images |
|---|---|---|
| Comparison with Poisson distribution Blue bars denote a histogram of data divided into 1 sec bins. Red curve is a Poisson curve with rate = median count rate of data. |
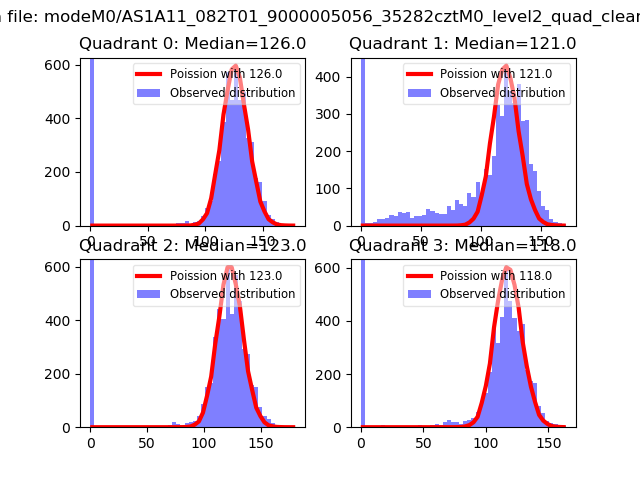 |
 |
| Quadrant-wise count rates Data is divided into 100 sec bins |
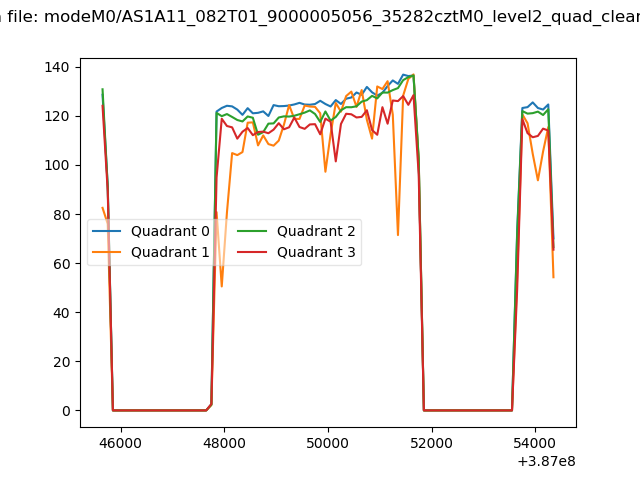 |
|
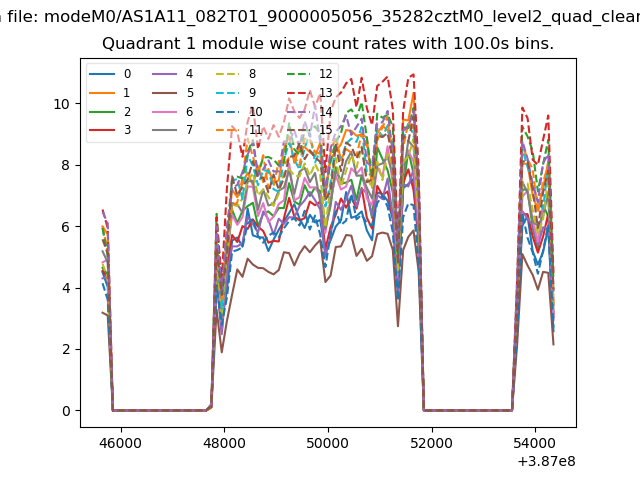
| Module-wise count rates for Quadrant A Data is divided into 100 sec bins |
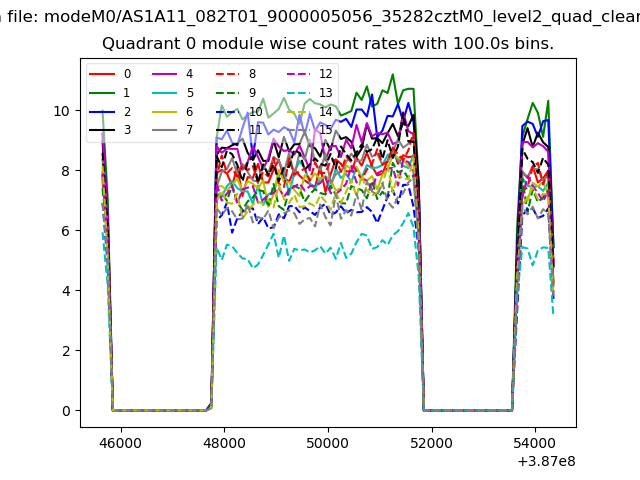 |
 |
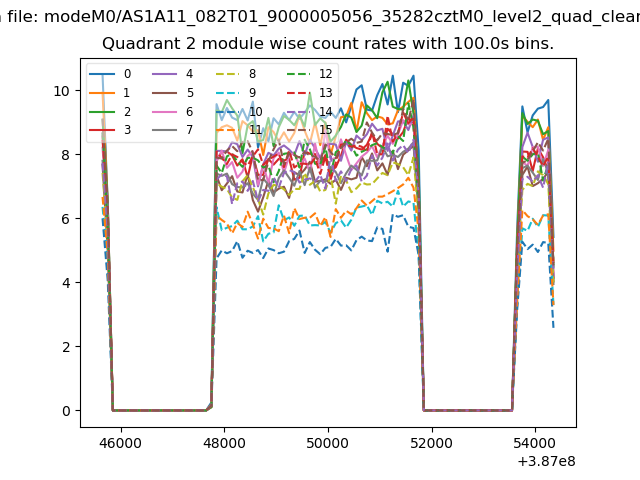
| Module-wise count rates for Quadrant B Data is divided into 100 sec bins |
 |
 |
| Module-wise count rates for Quadrant C Data is divided into 100 sec bins |
 |
 |
| Module-wise count rates for Quadrant D Data is divided into 100 sec bins |
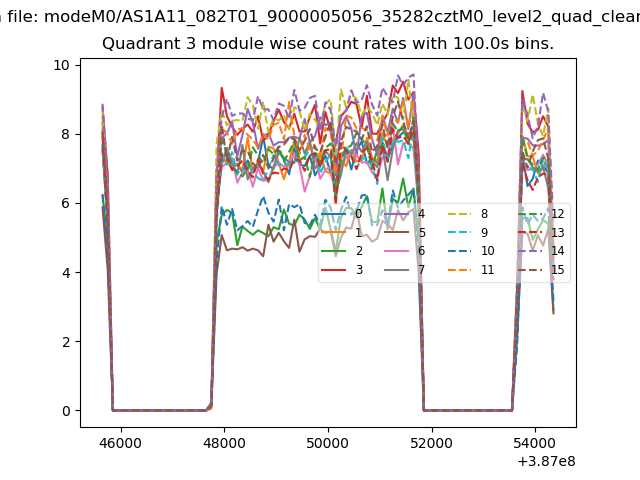 |
 |
| Parameter | Plot |
|---|---|
| CZT HV Monitor | 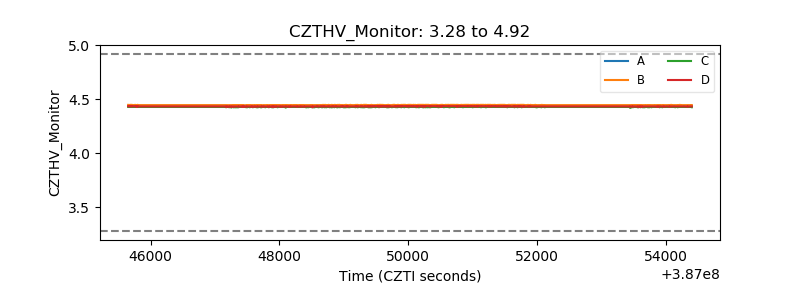 |
| D_VDD | 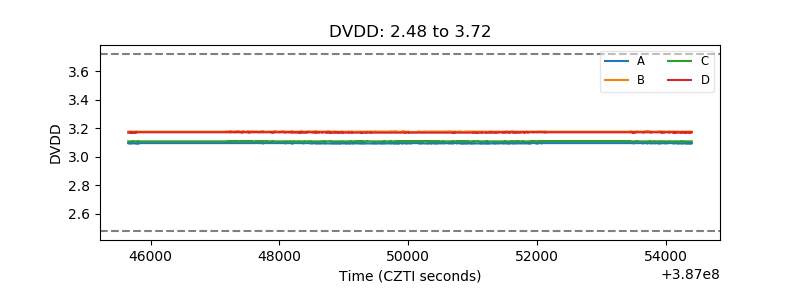 |
| Temperature 1 | 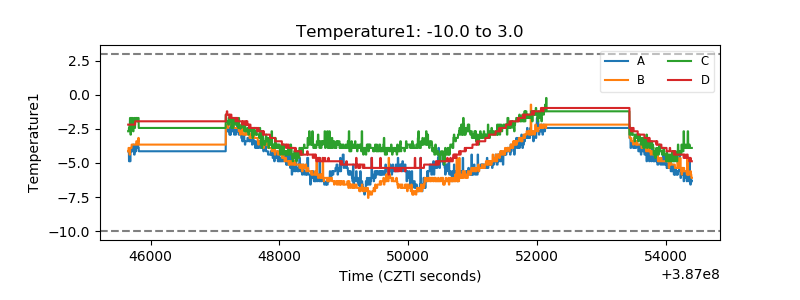 |
| Veto HV Monitor | 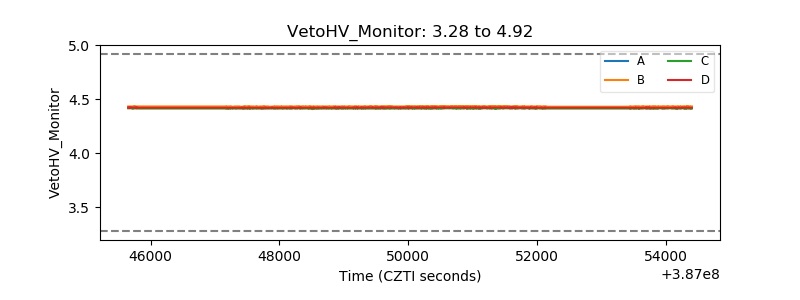 |
| Veto LLD | 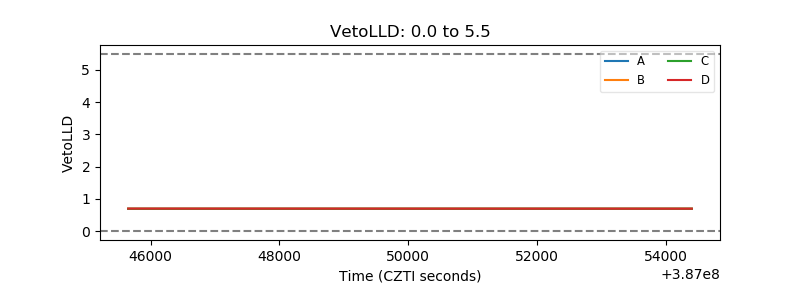 |
| Alpha Counter | 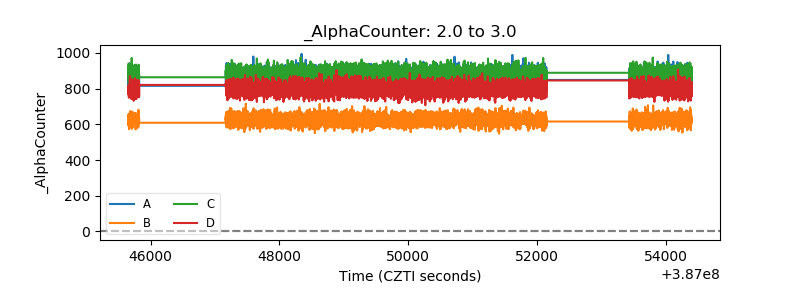 |
| _CPM_Rate | 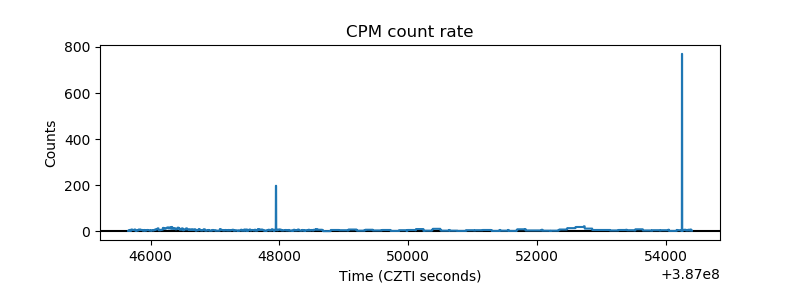 |
| CZT Counter | 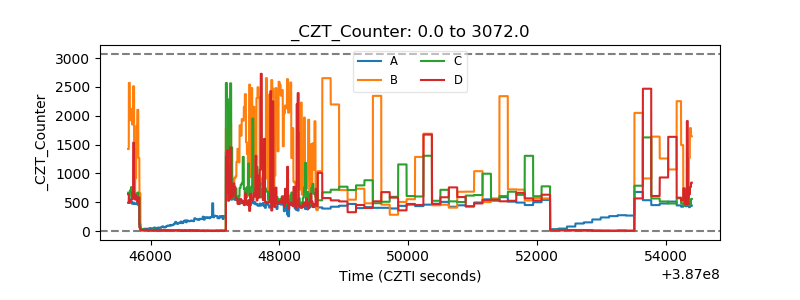 |
| +2.5 Volts monitor |  |
| +5 Volts monitor |  |
| _ROLL_ROT | 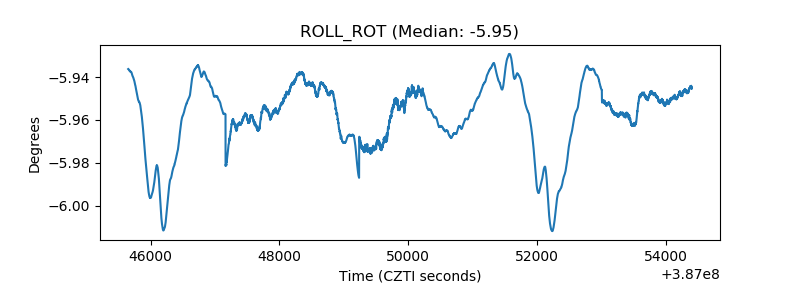 |
| _Roll_DEC | 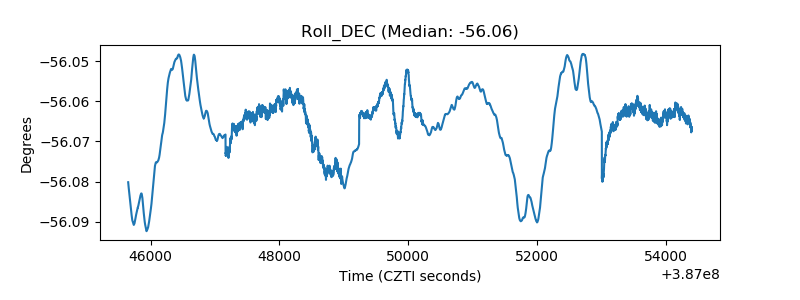 |
| _Roll_RA | 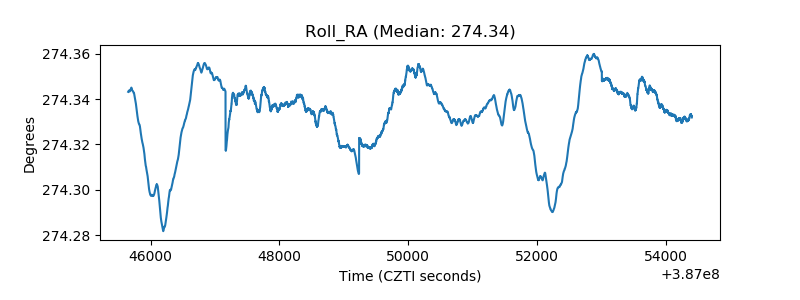 |
| Veto Counter | 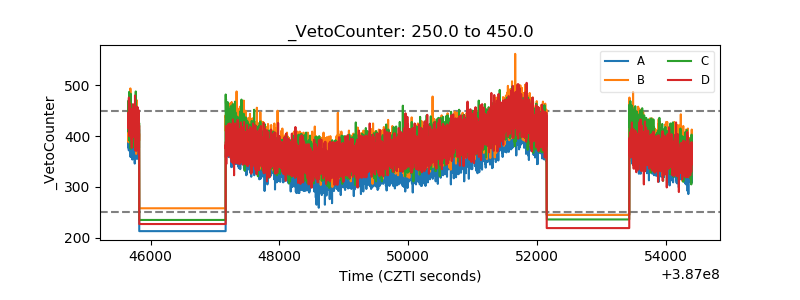 |