| Param | Original file | Final file |
|---|---|---|
| Filename | modeM0/AS1A11_082T01_9000005056_35288cztM0_level2.evt | modeM0/AS1A11_082T01_9000005056_35288cztM0_level2_quad_clean.evt |
| Size (bytes) | 709,663,680 | 67,665,600 |
| Size | 676.8 MB | 64.5 MB |
| Events in quadrant A | 2,706,832 | 459,496 |
| Events in quadrant B | 9,138,121 | 357,502 |
| Events in quadrant C | 3,841,594 | 455,004 |
| Events in quadrant D | 5,444,982 | 401,769 |
| Mode M0 | |||
|---|---|---|---|
| Quadrant | BADHDUFLAG | Total packets | Discarded packets |
| A | 0 | 11388 | 3 |
| B | 0 | 30846 | 2 |
| C | 0 | 15021 | 2 |
| D | 0 | 19792 | 2 |
| Mode SS | |||
|---|---|---|---|
| Quadrant | BADHDUFLAG | Total packets | Discarded packets |
| A | 0 | 110 | 0 |
| B | 0 | 110 | 0 |
| C | 0 | 110 | 0 |
| D | 0 | 110 | 0 |
| Mode M9 | |||
|---|---|---|---|
| Quadrant | BADHDUFLAG | Total packets | Discarded packets |
| A | 0 | 21 | 0 |
| B | 0 | 21 | 0 |
| C | 0 | 21 | 0 |
| D | 0 | 22 | 0 |
| Quadrant | Total seconds | Saturated seconds | Saturation percentage |
|---|---|---|---|
| A | 5336 | 7 | 0.131184% |
| B | 5336 | 2794 | 52.361319% |
| C | 5336 | 132 | 2.473763% |
| D | 5336 | 696 | 13.043478% |
Noise dominated data is calculated using 1-second bins in cleaned event files. If a bin has >2000 counts, and if more than 50% of those come from <1% of pixels, then it is considered to be noise-dominated and hence unusable.
| Quadrant | # 1 sec bins | Bins with >0 counts | Bins with >2000 counts | High rate bins dominated by noise | Noise dominated (total time) | Noise dominated (detector-on time) | Marked lightcurve |
|---|---|---|---|---|---|---|---|
| A | 7129 | 5337 | 1 | 1 | 0.01% | 0.02% | 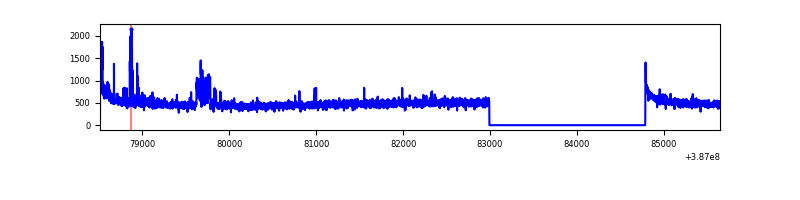 |
| B | 7128 | 5336 | 2327 | 2327 | 32.65% | 43.61% | 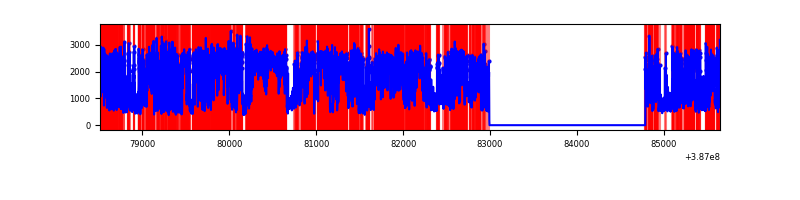 |
| C | 7129 | 5337 | 110 | 110 | 1.54% | 2.06% | 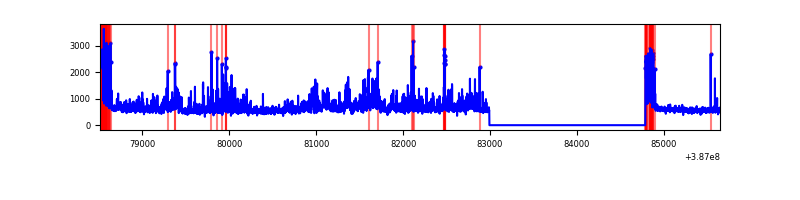 |
| D | 7129 | 5337 | 700 | 700 | 9.82% | 13.12% | 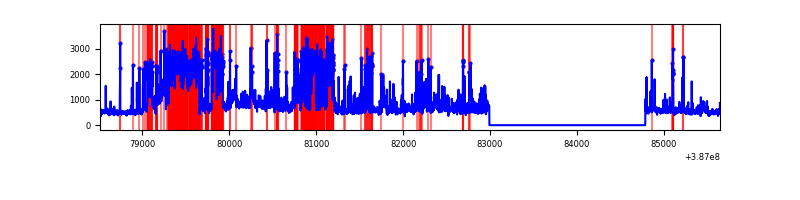 |
Top three noisy pixels from each quadrant. If the there are fewer than three noisy pixels in the level2.evt file, extra rows are filled as -1
| Pixel properties | Quadrant properties | ||||||
|---|---|---|---|---|---|---|---|
| Quadrant | DetID | PixID | Counts | Sigma | Mean | Median | Sigma |
| A | 15 | 169 | 135787 | 1072.9 | 634 | 621 | 126.0 |
| A | 10 | 83 | 95669 | 754.45 | 634 | 621 | 126.0 |
| A | 10 | 255 | 11196 | 83.94 | 634 | 621 | 126.0 |
| B | 5 | 172 | 5027614 | 54258.19 | 485 | 472 | 92.7 |
| B | 5 | 236 | 2047076 | 22089.1 | 485 | 472 | 92.7 |
| B | 5 | 200 | 116312 | 1250.27 | 485 | 472 | 92.7 |
| C | 0 | 10 | 645167 | 4486.22 | 621 | 627 | 143.7 |
| C | 4 | 254 | 525794 | 3655.35 | 621 | 627 | 143.7 |
| C | 15 | 214 | 220540 | 1530.67 | 621 | 627 | 143.7 |
| D | 7 | 80 | 2438114 | 16750.94 | 593 | 577 | 145.5 |
| D | 8 | 195 | 209953 | 1438.85 | 593 | 577 | 145.5 |
| D | 13 | 249 | 138907 | 950.61 | 593 | 577 | 145.5 |
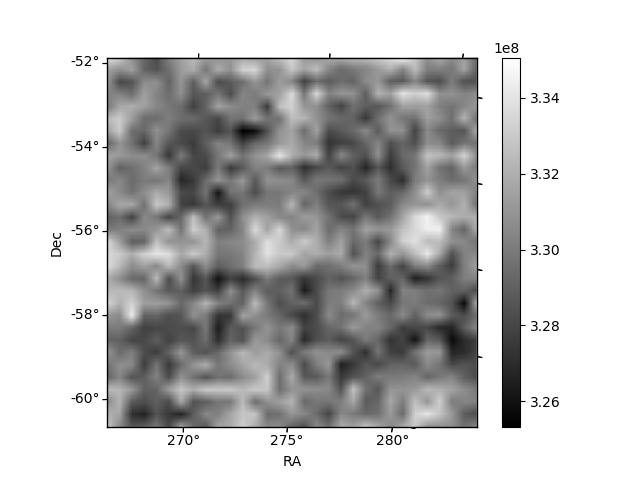
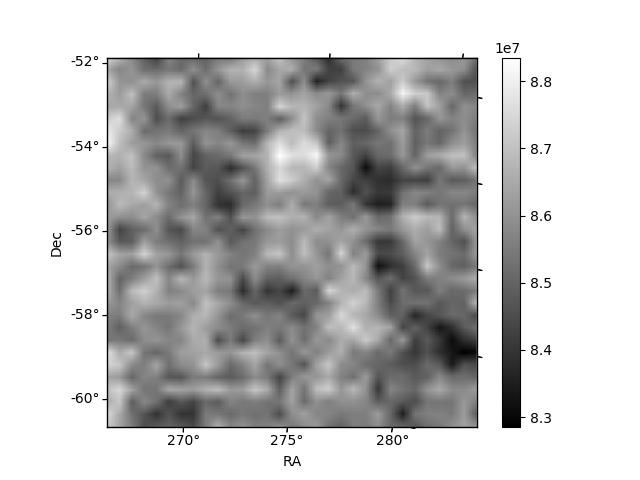
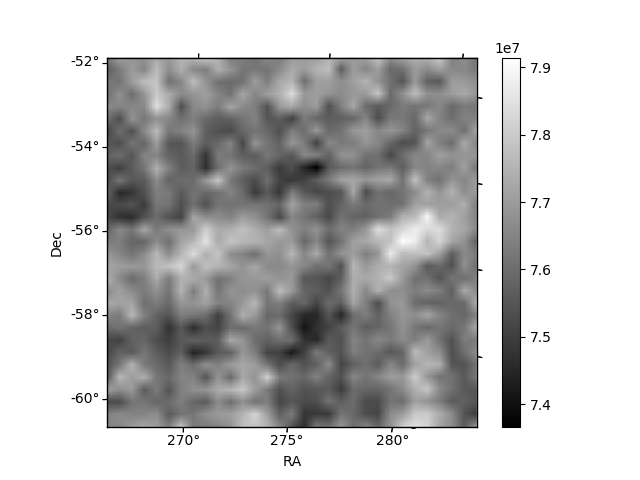
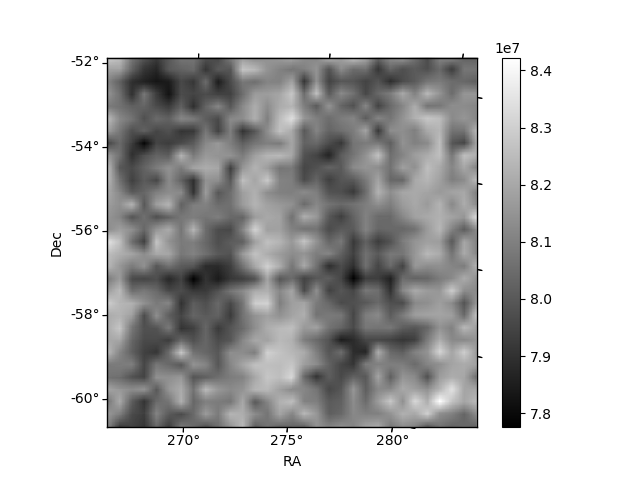
Histogram calculated using DETX and DETY for each event in the final _common_clean file
| Quadrant A | 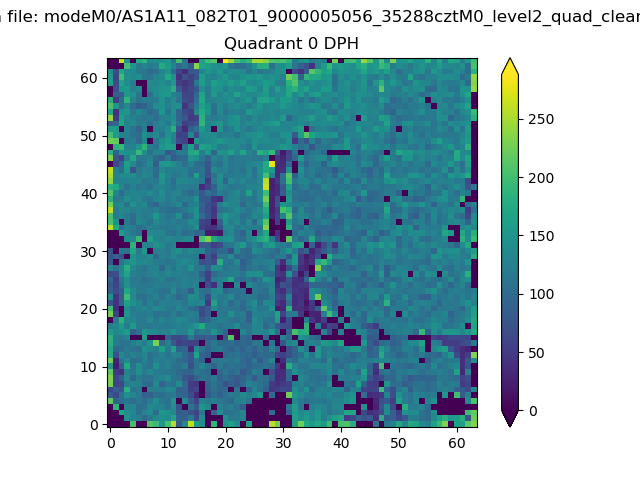 |
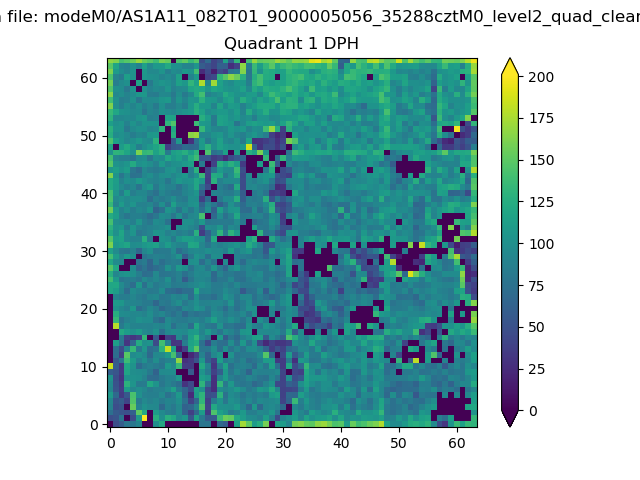 |
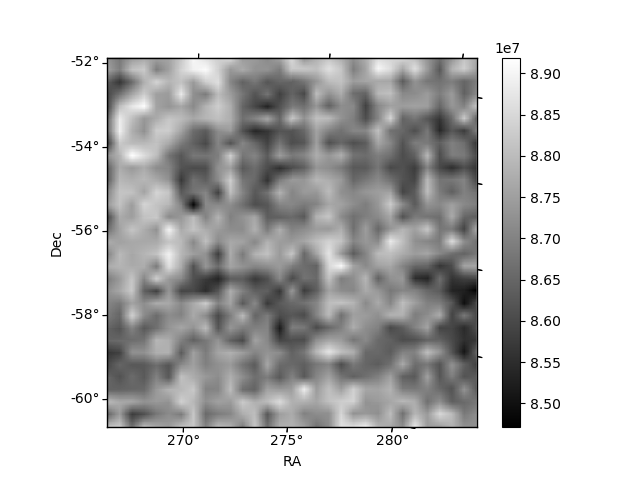
Quadrant B |
|---|---|---|---|
| Quadrant D | 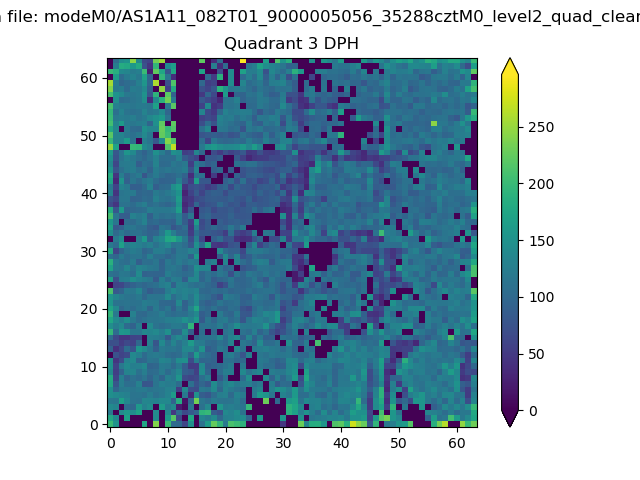 |
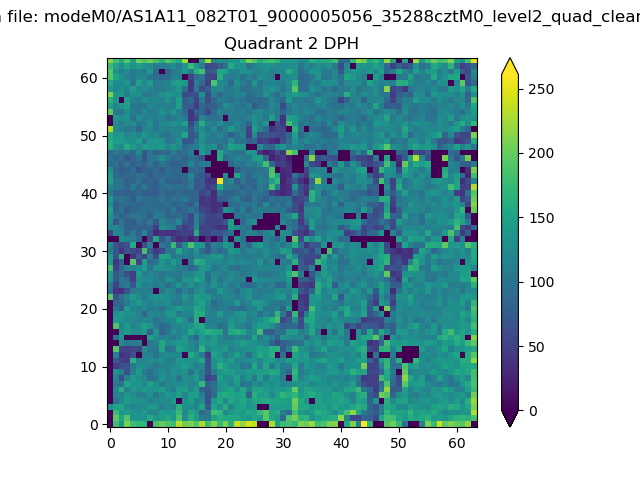 |
Quadrant C |
| Plot type | Count rate plots | Images |
|---|---|---|
| Comparison with Poisson distribution Blue bars denote a histogram of data divided into 1 sec bins. Red curve is a Poisson curve with rate = median count rate of data. |
 |
 |
| Quadrant-wise count rates Data is divided into 100 sec bins |
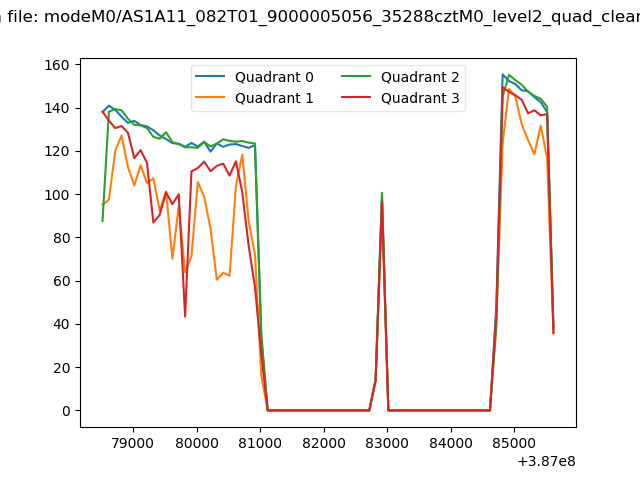 |
|
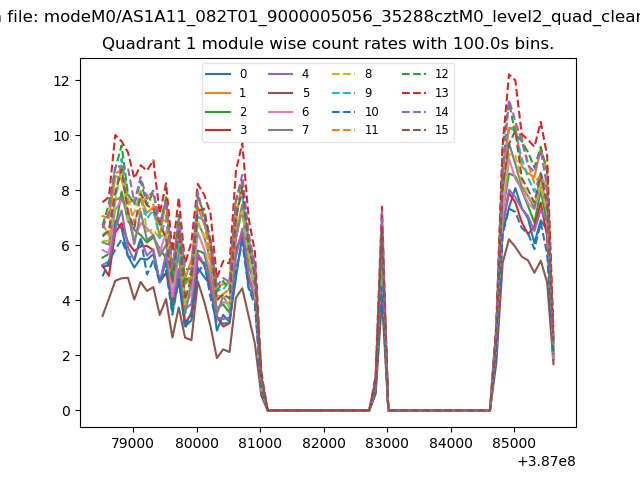
| Module-wise count rates for Quadrant A Data is divided into 100 sec bins |
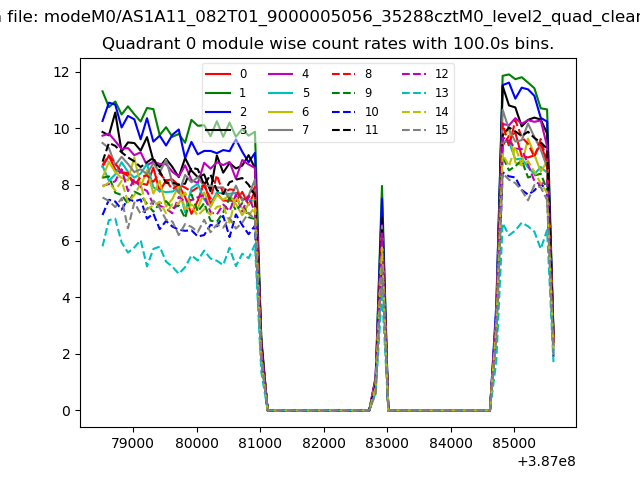 |
 |
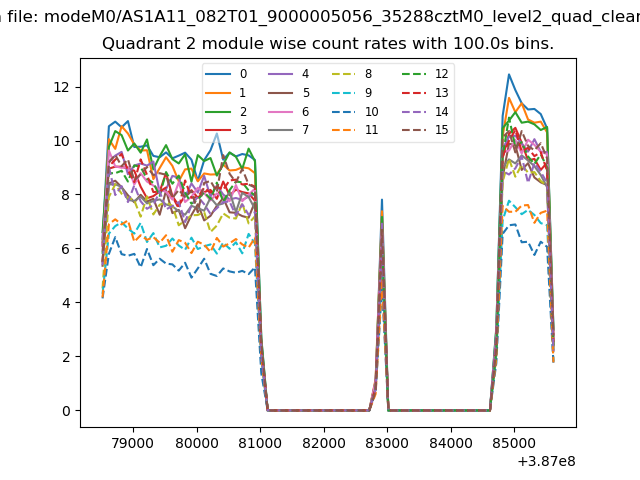
| Module-wise count rates for Quadrant B Data is divided into 100 sec bins |
 |
 |
| Module-wise count rates for Quadrant C Data is divided into 100 sec bins |
 |
 |
| Module-wise count rates for Quadrant D Data is divided into 100 sec bins |
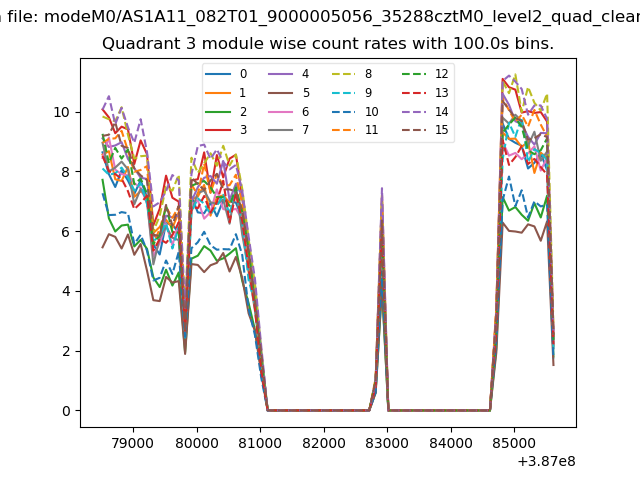 |
 |
| Parameter | Plot |
|---|---|
| CZT HV Monitor | 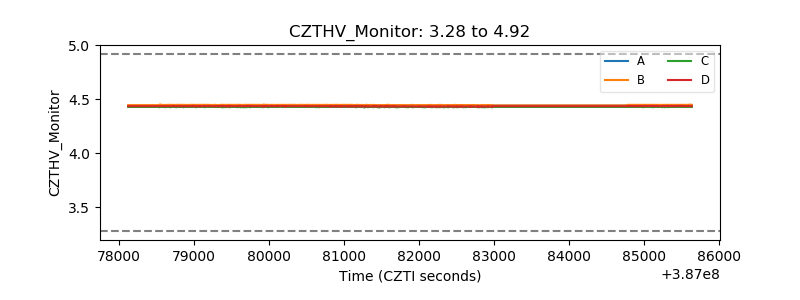 |
| D_VDD | 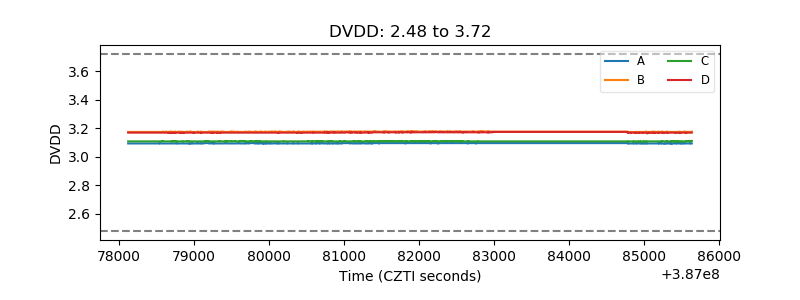 |
| Temperature 1 | 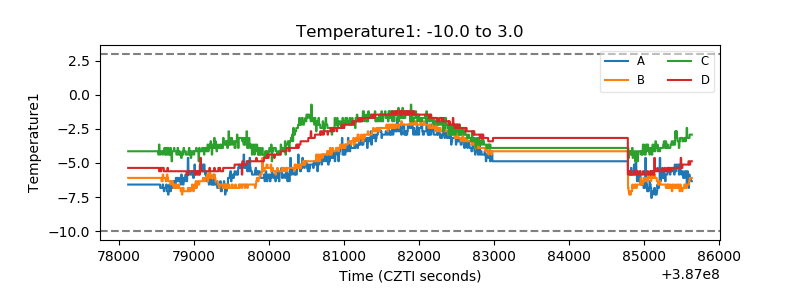 |
| Veto HV Monitor | 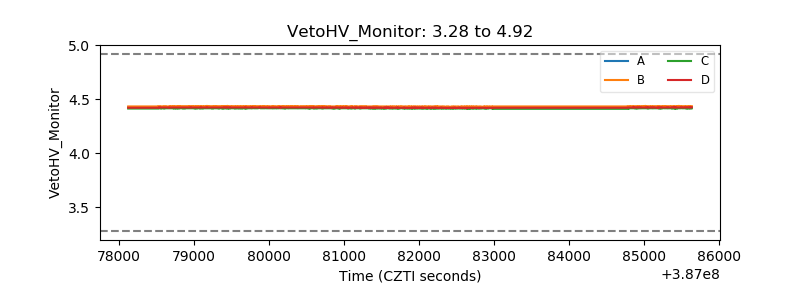 |
| Veto LLD | 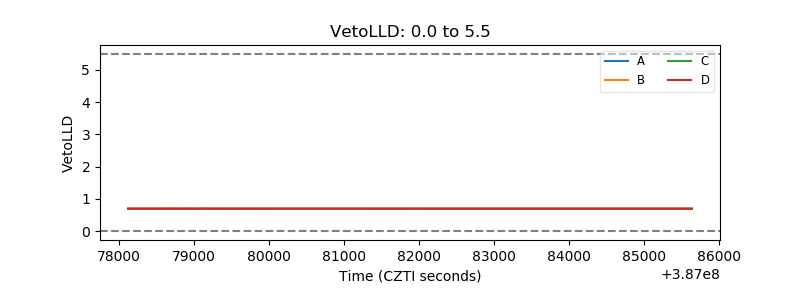 |
| Alpha Counter |  |
| _CPM_Rate | 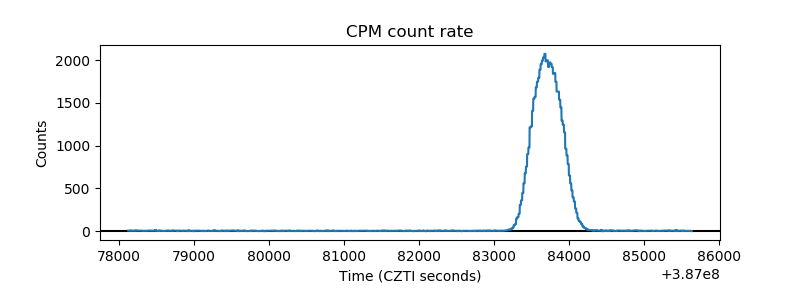 |
| CZT Counter | 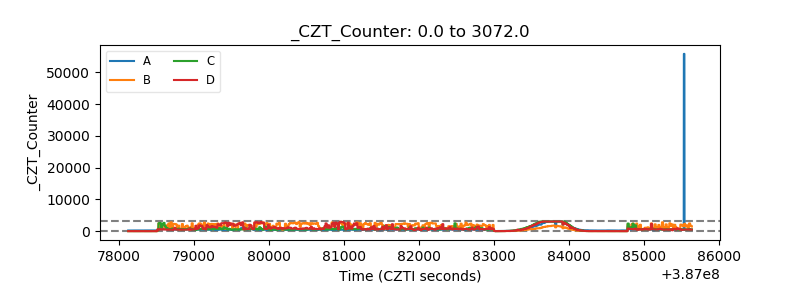 |
| +2.5 Volts monitor |  |
| +5 Volts monitor |  |
| _ROLL_ROT | 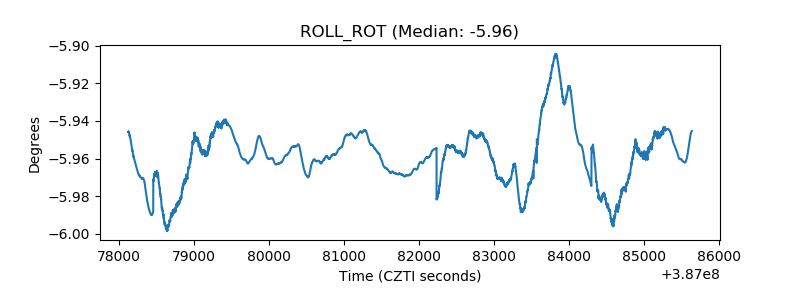 |
| _Roll_DEC | 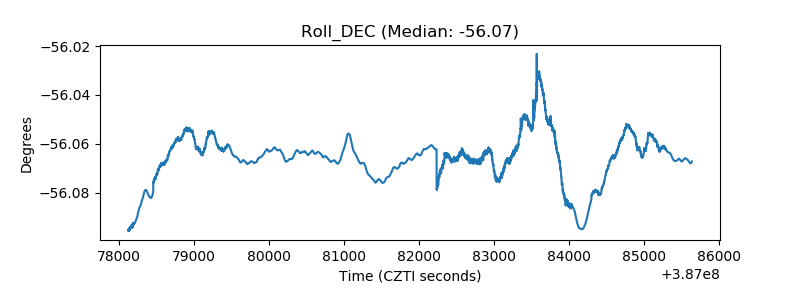 |
| _Roll_RA |  |
| Veto Counter | 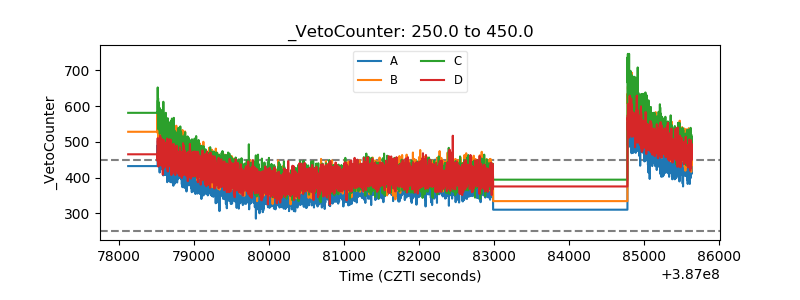 |