| Param | Original file | Final file |
|---|---|---|
| Filename | modeM0/AS1T05_023T01_9000005058cztM0_level2.fits | modeM0/AS1T05_023T01_9000005058cztM0_level2_quad_clean.evt |
| Size (bytes) | 705,216,960 | 665,930,880 |
| Size | 672.5 MB | 635.1 MB |
| Events in quadrant A | 4,487,880 | 4,317,145 |
| Events in quadrant B | 3,697,422 | 3,125,535 |
| Events in quadrant C | 4,357,854 | 4,146,719 |
| Events in quadrant D | 3,579,038 | 3,353,612 |
| Mode M0 | |||
|---|---|---|---|
| Quadrant | BADHDUFLAG | Total packets | Discarded packets |
| A | 0 | 185454 | 0 |
| B | 0 | 340062 | 0 |
| C | 0 | 172599 | 0 |
| D | 0 | 250567 | 0 |
| Mode M9 | |||
|---|---|---|---|
| Quadrant | BADHDUFLAG | Total packets | Discarded packets |
| A | 0 | 297 | 0 |
| B | 0 | 297 | 0 |
| C | 0 | 297 | 0 |
| D | 0 | 297 | 0 |
| Mode SS | |||
|---|---|---|---|
| Quadrant | BADHDUFLAG | Total packets | Discarded packets |
| A | 0 | 1554 | 0 |
| B | 0 | 1554 | 0 |
| C | 0 | 1554 | 0 |
| D | 0 | 1554 | 0 |
| Quadrant | Total seconds | Saturated seconds | Saturation percentage |
|---|---|---|---|
| A | 76157 | 740 | 0.971677% |
| B | 76158 | 22407 | 29.421729% |
| C | 76158 | 983 | 1.290738% |
| D | 76158 | 7079 | 9.295150% |
Noise dominated data is calculated using 1-second bins in cleaned event files. If a bin has >2000 counts, and if more than 50% of those come from <1% of pixels, then it is considered to be noise-dominated and hence unusable.
| Quadrant | # 1 sec bins | Bins with >0 counts | Bins with >2000 counts | High rate bins dominated by noise | Noise dominated (total time) | Noise dominated (detector-on time) | Marked lightcurve |
|---|---|---|---|---|---|---|---|
| A | 104215 | 76156 | 0 | 0 | 0.00% | 0.00% |  |
| B | 104215 | 75852 | 0 | 0 | 0.00% | 0.00% | 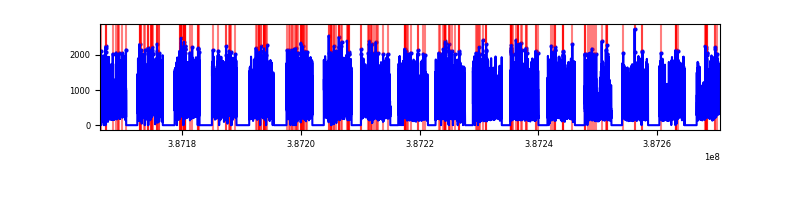 |
| C | 104215 | 76130 | 0 | 0 | 0.00% | 0.00% |  |
| D | 104215 | 75443 | 0 | 0 | 0.00% | 0.00% |  |
Top three noisy pixels from each quadrant. If the there are fewer than three noisy pixels in the level2.evt file, extra rows are filled as -1
| Pixel properties | Quadrant properties | ||||||
|---|---|---|---|---|---|---|---|
| Quadrant | DetID | PixID | Counts | Sigma | Mean | Median | Sigma |
| A | 9 | 19 | 3644 | 9.03 | 1172 | 1109 | 280.6 |
| A | 7 | 110 | 3609 | 8.91 | 1172 | 1109 | 280.6 |
| A | 0 | 29 | 3600 | 8.88 | 1172 | 1109 | 280.6 |
| B | 2 | 9 | 3261 | 12.18 | 977 | 933 | 191.1 |
| B | 3 | 80 | 2800 | 9.77 | 977 | 933 | 191.1 |
| B | 2 | 8 | 2615 | 8.8 | 977 | 933 | 191.1 |
| C | 1 | 81 | 3687 | 8.86 | 1150 | 1079 | 294.5 |
| C | 1 | 80 | 3576 | 8.48 | 1150 | 1079 | 294.5 |
| C | 3 | 203 | 3465 | 8.1 | 1150 | 1079 | 294.5 |
| D | 10 | 189 | 2669 | 6.44 | 1025 | 940 | 268.3 |
| D | 4 | 160 | 2612 | 6.23 | 1025 | 940 | 268.3 |
| D | 6 | 67 | 2550 | 6.0 | 1025 | 940 | 268.3 |
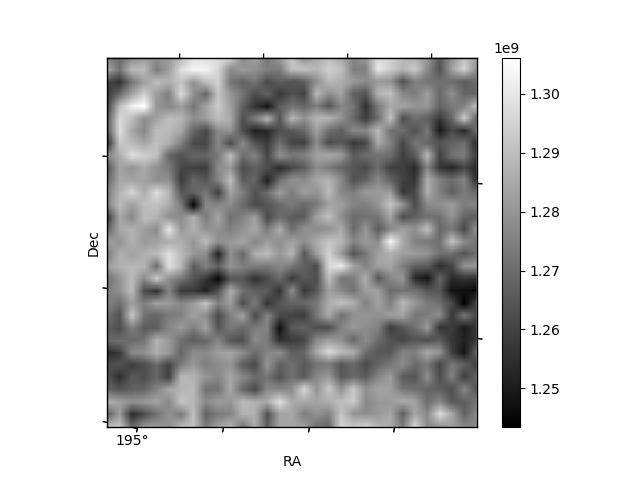
Histogram calculated using DETX and DETY for each event in the final _common_clean file
| Quadrant A | 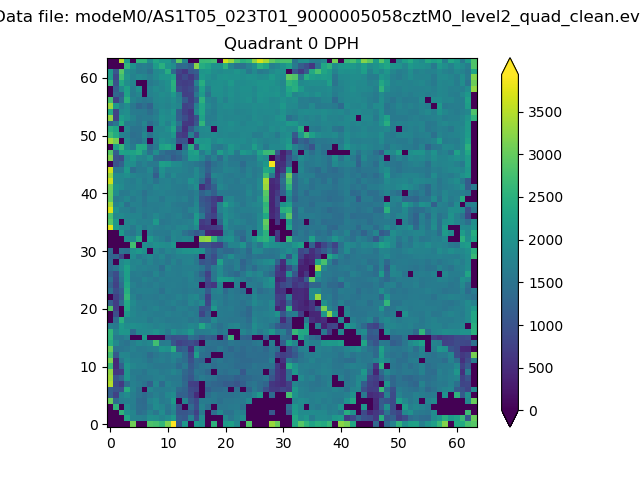 |
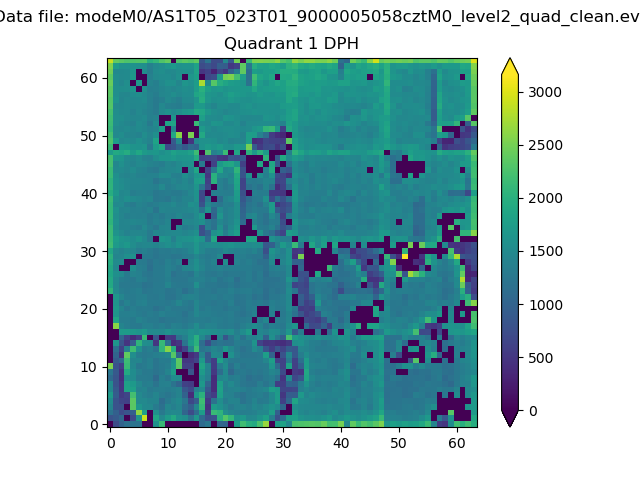 |
Quadrant B |
|---|---|---|---|
| Quadrant D | 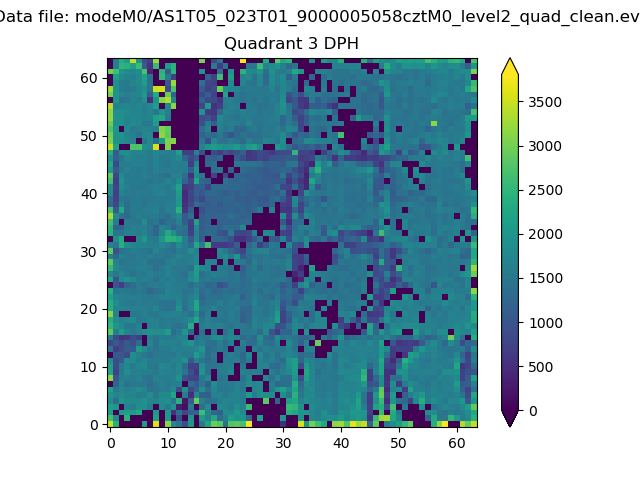 |
 |
Quadrant C |
| Plot type | Count rate plots | Images |
|---|---|---|
| Comparison with Poisson distribution Blue bars denote a histogram of data divided into 1 sec bins. Red curve is a Poisson curve with rate = median count rate of data. |
 |
 |
| Quadrant-wise count rates Data is divided into 100 sec bins |
 |
|
| Module-wise count rates for Quadrant A Data is divided into 100 sec bins |
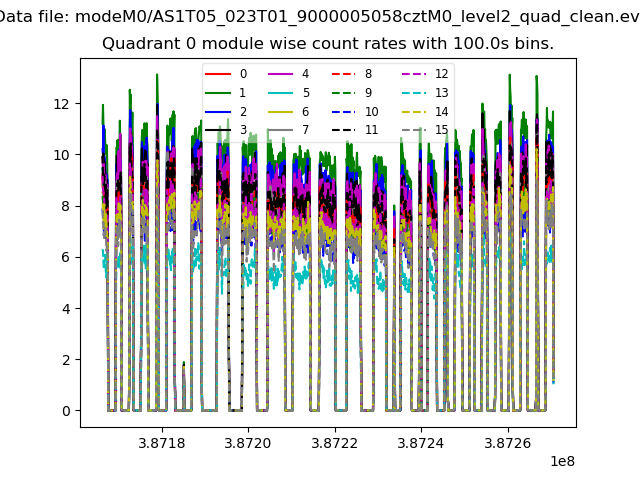 |
 |
| Module-wise count rates for Quadrant B Data is divided into 100 sec bins |
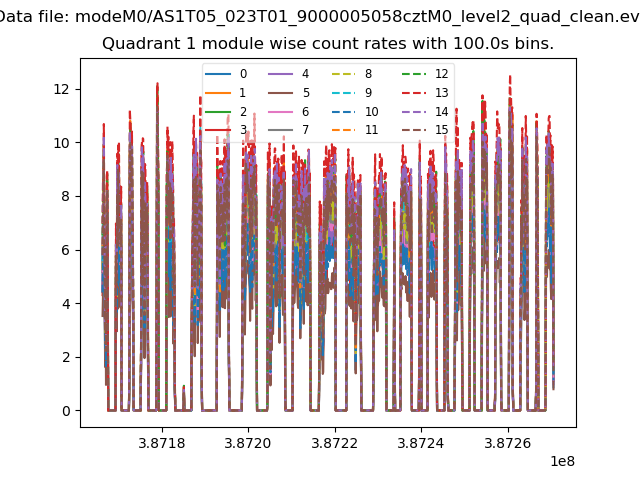 |
 |
| Module-wise count rates for Quadrant C Data is divided into 100 sec bins |
 |
 |
| Module-wise count rates for Quadrant D Data is divided into 100 sec bins |
 |
 |
| Parameter | Plot |
|---|---|
| CZT HV Monitor |  |
| D_VDD |  |
| Temperature 1 |  |
| Veto HV Monitor |  |
| Veto LLD |  |
| Alpha Counter |  |
| _CPM_Rate | 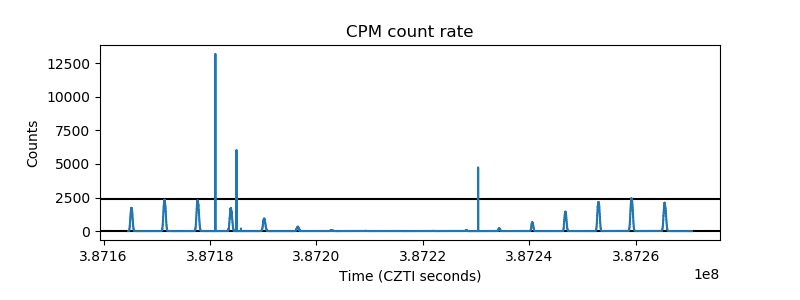 |
| CZT Counter |  |
| +2.5 Volts monitor |  |
| +5 Volts monitor |  |
| _ROLL_ROT |  |
| _Roll_DEC | 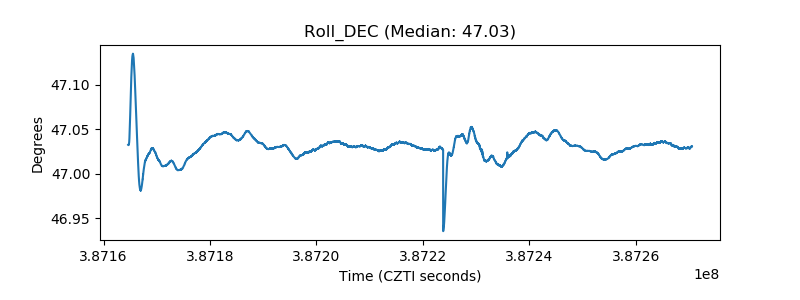 |
| _Roll_RA | 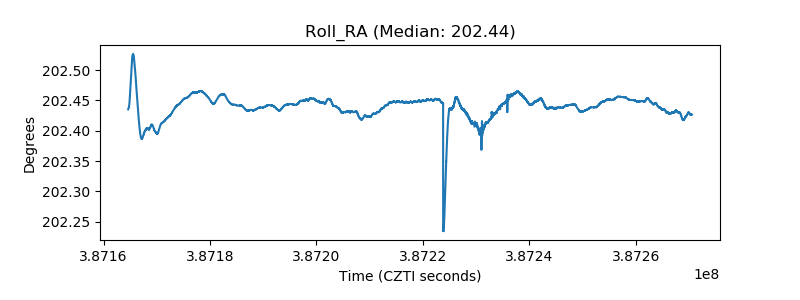 |
| Veto Counter |  |