| Param | Original file | Final file |
|---|---|---|
| Filename | modeM0/AS1T05_023T01_9000005058_35304cztM0_level2.evt | modeM0/AS1T05_023T01_9000005058_35304cztM0_level2_quad_clean.evt |
| Size (bytes) | 582,649,920 | 62,792,640 |
| Size | 555.7 MB | 59.9 MB |
| Events in quadrant A | 3,384,894 | 410,070 |
| Events in quadrant B | 7,707,189 | 329,688 |
| Events in quadrant C | 3,032,528 | 399,239 |
| Events in quadrant D | 3,157,121 | 385,457 |
| Mode M0 | |||
|---|---|---|---|
| Quadrant | BADHDUFLAG | Total packets | Discarded packets |
| A | 0 | 13513 | 3 |
| B | 0 | 26597 | 2 |
| C | 0 | 12010 | 2 |
| D | 0 | 12775 | 2 |
| Mode M9 | |||
|---|---|---|---|
| Quadrant | BADHDUFLAG | Total packets | Discarded packets |
| A | 0 | 30 | 0 |
| B | 0 | 30 | 0 |
| C | 0 | 30 | 0 |
| D | 0 | 31 | 0 |
| Mode SS | |||
|---|---|---|---|
| Quadrant | BADHDUFLAG | Total packets | Discarded packets |
| A | 0 | 110 | 0 |
| B | 0 | 110 | 0 |
| C | 0 | 110 | 0 |
| D | 0 | 110 | 0 |
| Quadrant | Total seconds | Saturated seconds | Saturation percentage |
|---|---|---|---|
| A | 5370 | 20 | 0.372439% |
| B | 5370 | 2049 | 38.156425% |
| C | 5370 | 85 | 1.582868% |
| D | 5370 | 58 | 1.080074% |
Noise dominated data is calculated using 1-second bins in cleaned event files. If a bin has >2000 counts, and if more than 50% of those come from <1% of pixels, then it is considered to be noise-dominated and hence unusable.
| Quadrant | # 1 sec bins | Bins with >0 counts | Bins with >2000 counts | High rate bins dominated by noise | Noise dominated (total time) | Noise dominated (detector-on time) | Marked lightcurve |
|---|---|---|---|---|---|---|---|
| A | 7373 | 5371 | 13 | 13 | 0.18% | 0.24% | 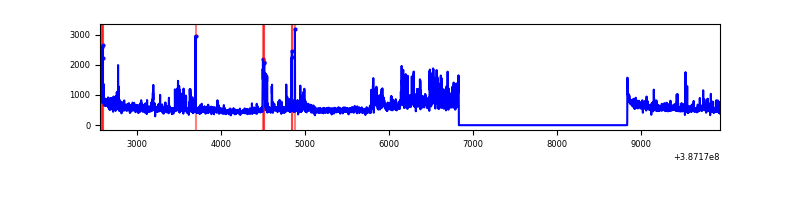 |
| B | 7372 | 5369 | 1541 | 1541 | 20.90% | 28.70% | 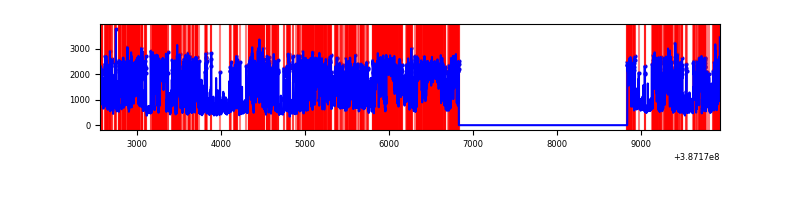 |
| C | 7373 | 5371 | 77 | 77 | 1.04% | 1.43% | 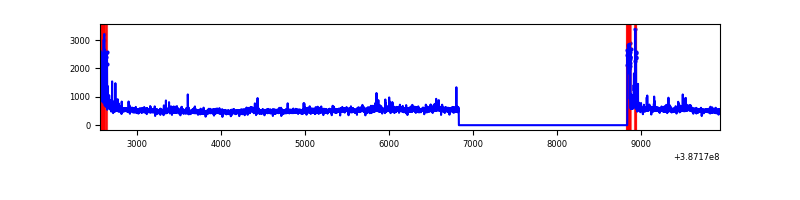 |
| D | 7373 | 5371 | 47 | 47 | 0.64% | 0.88% | 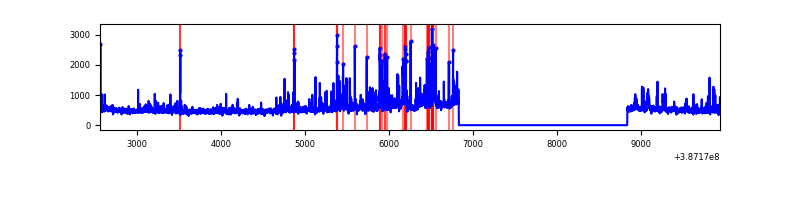 |
Top three noisy pixels from each quadrant. If the there are fewer than three noisy pixels in the level2.evt file, extra rows are filled as -1
| Pixel properties | Quadrant properties | ||||||
|---|---|---|---|---|---|---|---|
| Quadrant | DetID | PixID | Counts | Sigma | Mean | Median | Sigma |
| A | 15 | 169 | 650130 | 4887.86 | 665 | 654 | 132.9 |
| A | 10 | 83 | 97731 | 730.59 | 665 | 654 | 132.9 |
| A | 7 | 3 | 36246 | 267.86 | 665 | 654 | 132.9 |
| B | 5 | 236 | 4185021 | 39400.25 | 560 | 546 | 106.2 |
| B | 5 | 172 | 1307176 | 12302.98 | 560 | 546 | 106.2 |
| B | 12 | 111 | 12791 | 115.29 | 560 | 546 | 106.2 |
| C | 0 | 10 | 289323 | 1995.49 | 632 | 636 | 144.7 |
| C | 15 | 214 | 225640 | 1555.3 | 632 | 636 | 144.7 |
| C | 0 | 207 | 38715 | 263.21 | 632 | 636 | 144.7 |
| D | 8 | 195 | 267222 | 1746.91 | 636 | 620 | 152.6 |
| D | 13 | 249 | 155558 | 1015.23 | 636 | 620 | 152.6 |
| D | 1 | 239 | 57766 | 374.45 | 636 | 620 | 152.6 |
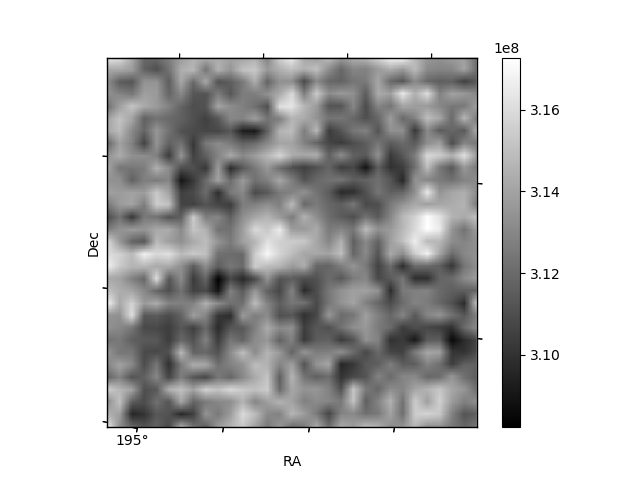
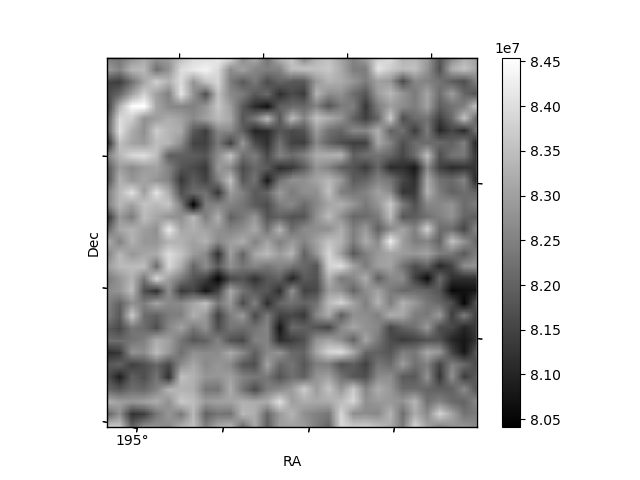
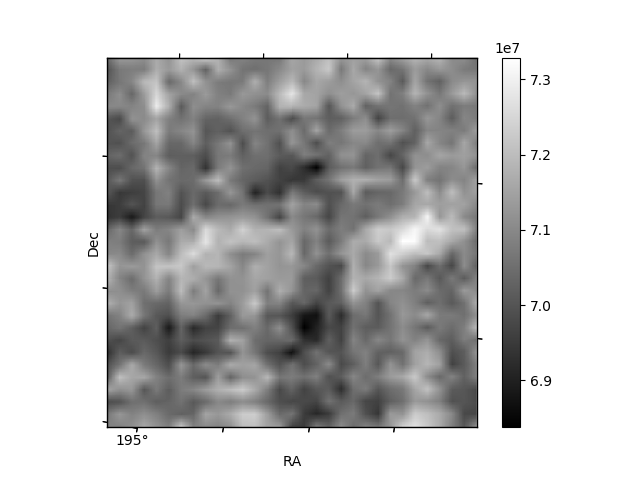
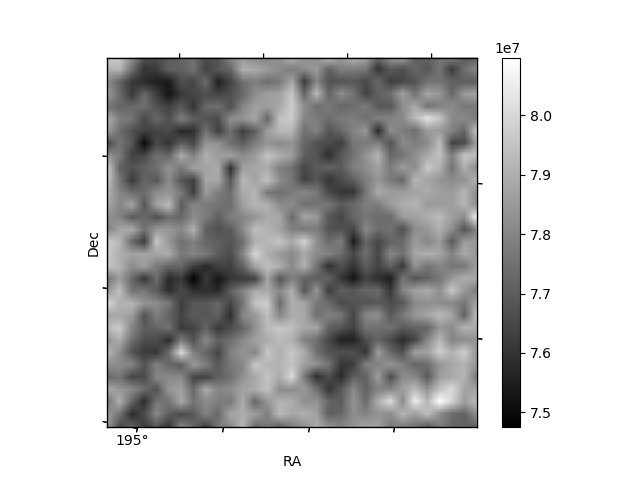
Histogram calculated using DETX and DETY for each event in the final _common_clean file
| Quadrant A | 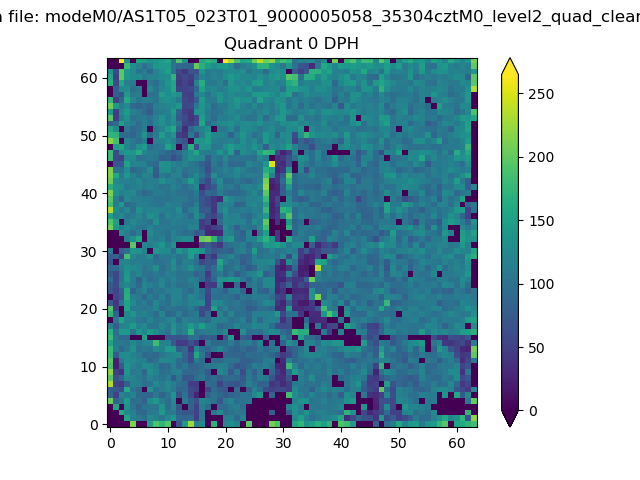 |
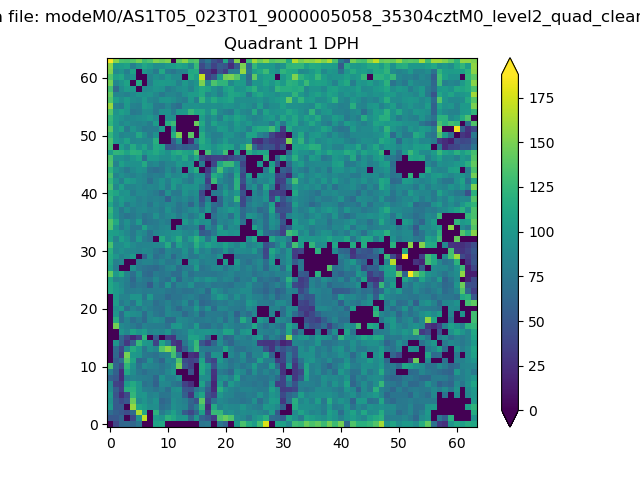 |
Quadrant B |
|---|---|---|---|
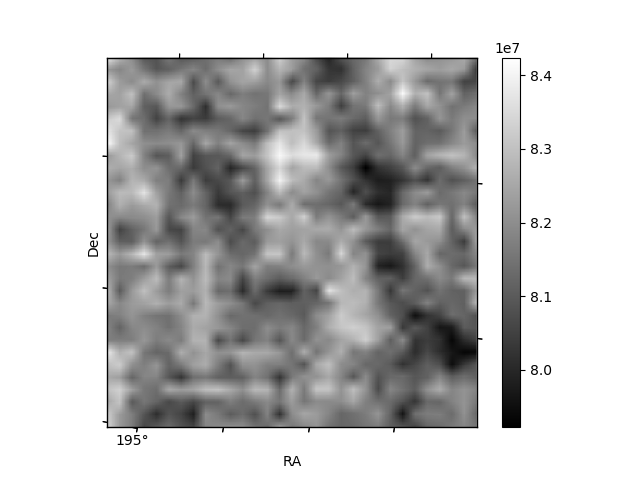
| Quadrant D | 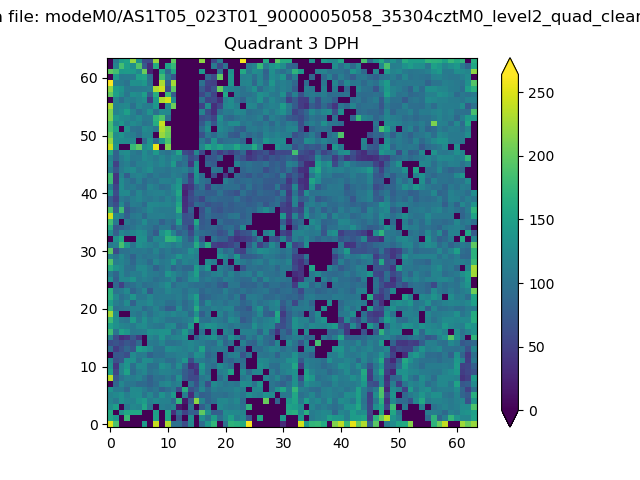 |
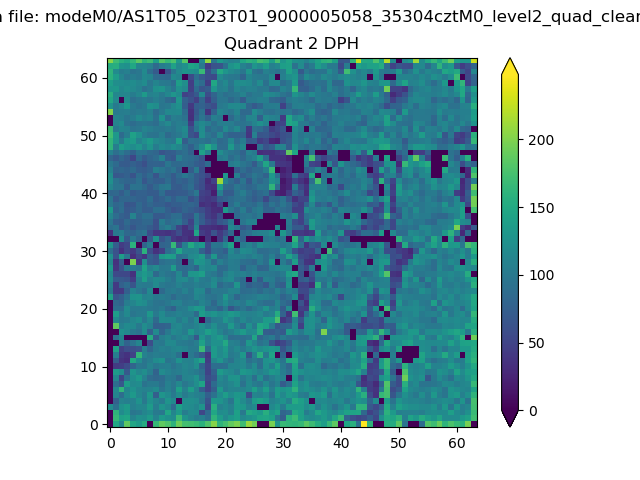 |
Quadrant C |
| Plot type | Count rate plots | Images |
|---|---|---|
| Comparison with Poisson distribution Blue bars denote a histogram of data divided into 1 sec bins. Red curve is a Poisson curve with rate = median count rate of data. |
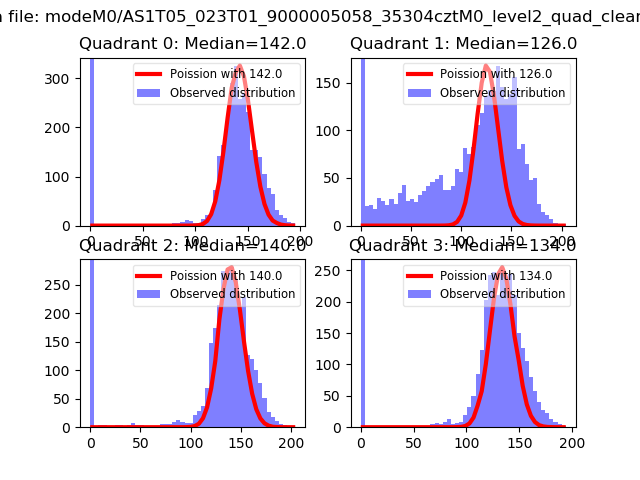 |
 |
| Quadrant-wise count rates Data is divided into 100 sec bins |
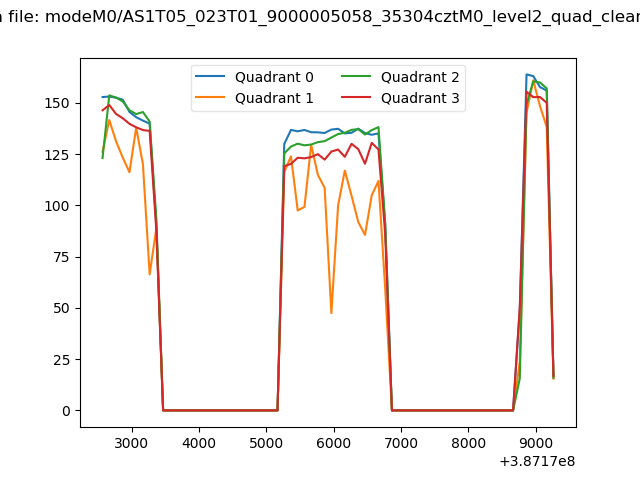 |
|
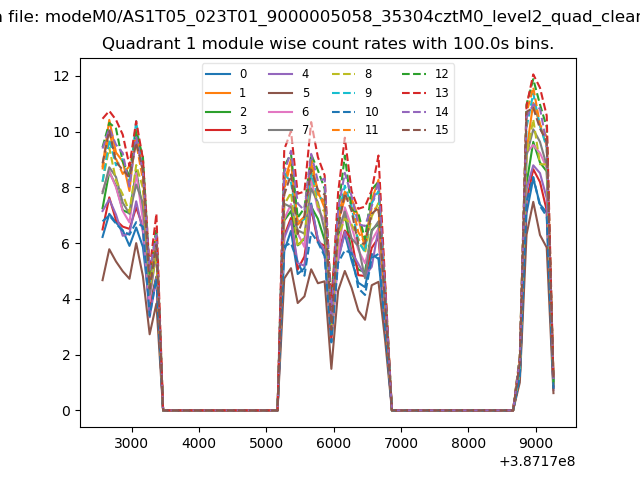
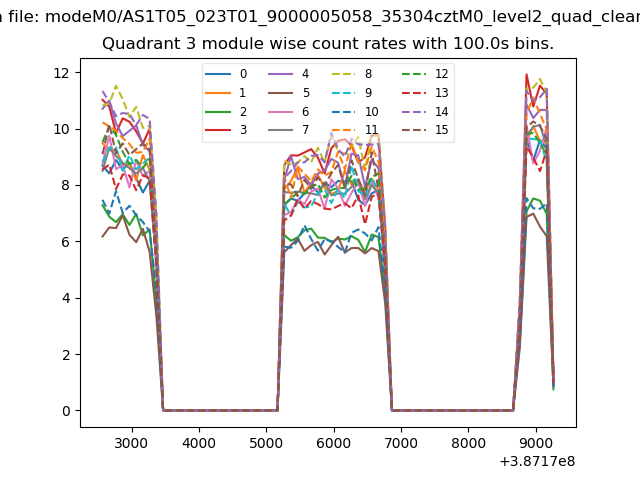
| Module-wise count rates for Quadrant A Data is divided into 100 sec bins |
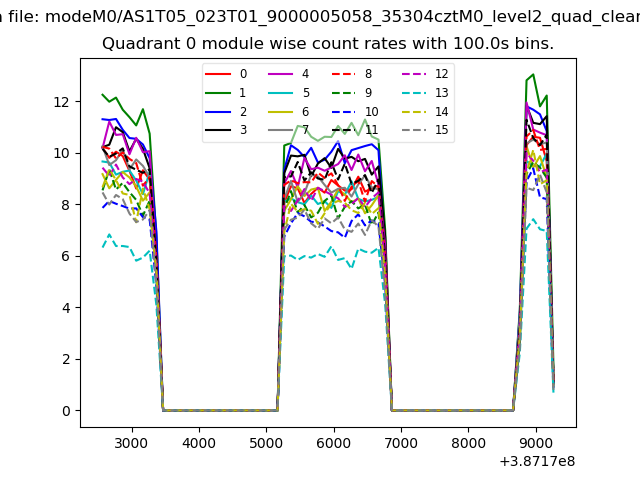 |
 |
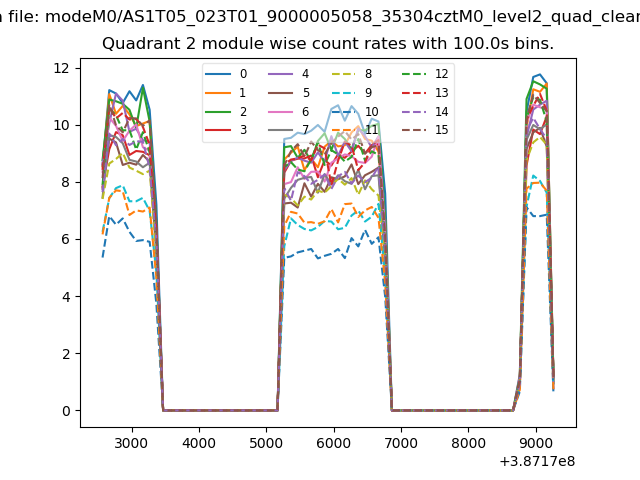
| Module-wise count rates for Quadrant B Data is divided into 100 sec bins |
 |
 |
| Module-wise count rates for Quadrant C Data is divided into 100 sec bins |
 |
 |
| Module-wise count rates for Quadrant D Data is divided into 100 sec bins |
 |
 |
| Parameter | Plot |
|---|---|
| CZT HV Monitor |  |
| D_VDD | 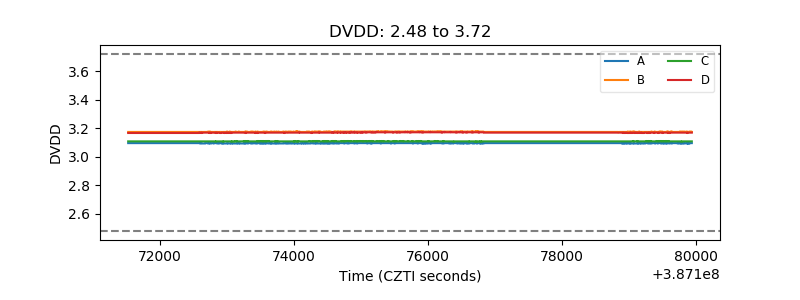 |
| Temperature 1 | 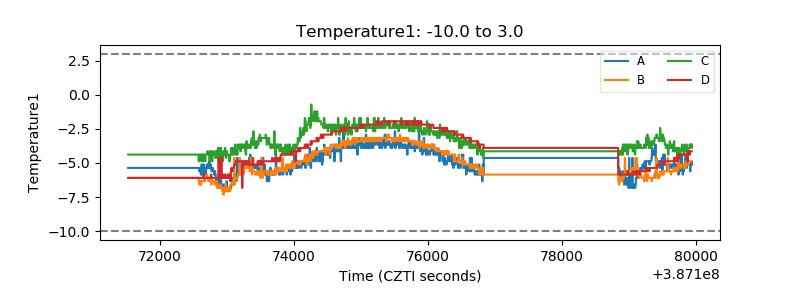 |
| Veto HV Monitor | 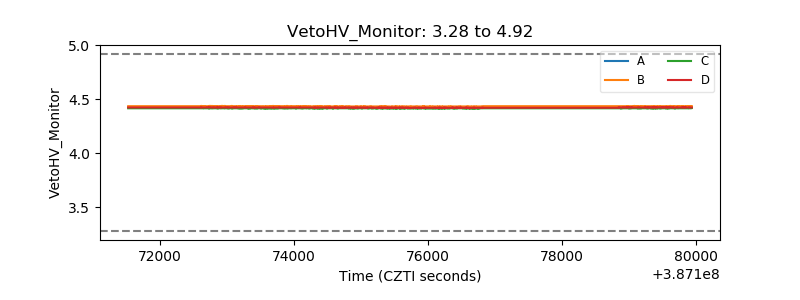 |
| Veto LLD | 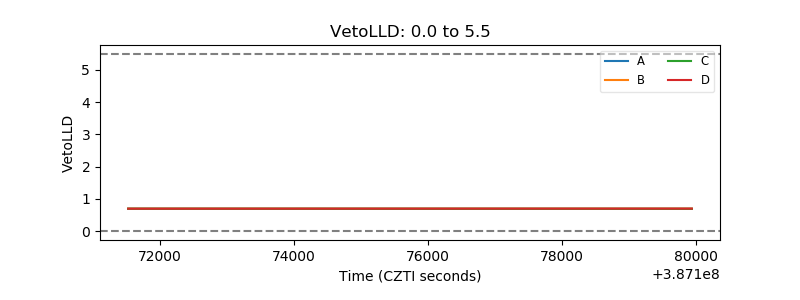 |
| Alpha Counter |  |
| _CPM_Rate |  |
| CZT Counter | 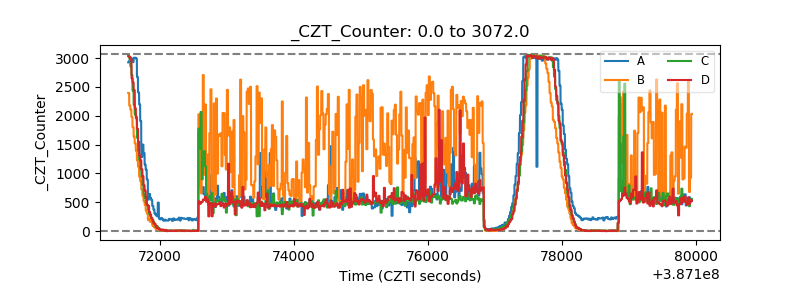 |
| +2.5 Volts monitor |  |
| +5 Volts monitor |  |
| _ROLL_ROT | 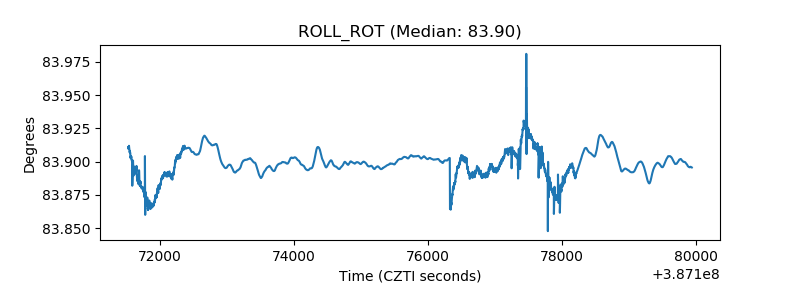 |
| _Roll_DEC | 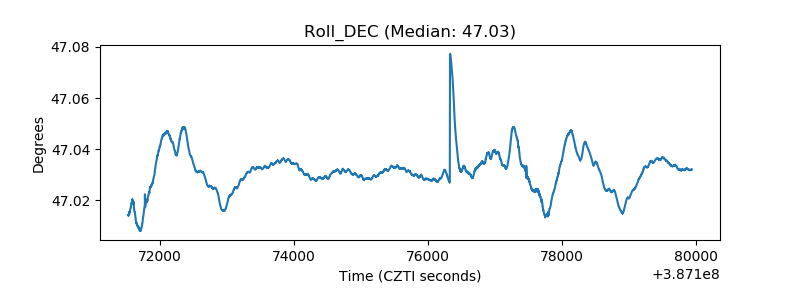 |
| _Roll_RA | 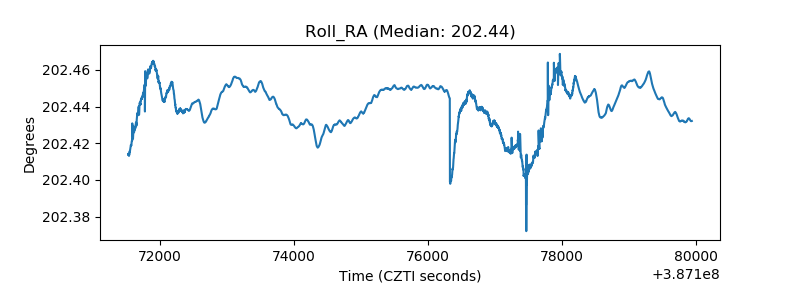 |
| Veto Counter | 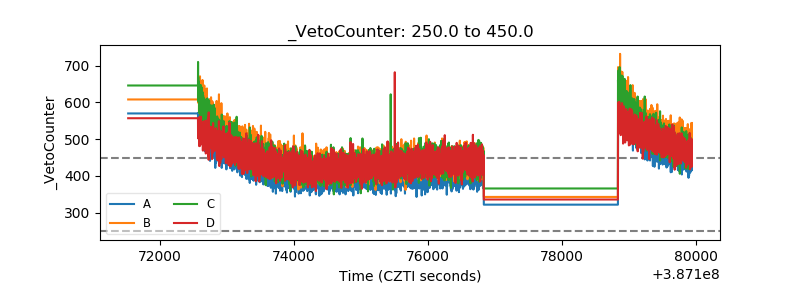 |