| Param | Original file | Final file |
|---|---|---|
| Filename | modeM0/AS1A11_046T08_9000005062cztM0_level2.fits | modeM0/AS1A11_046T08_9000005062cztM0_level2_quad_clean.evt |
| Size (bytes) | 162,262,080 | 225,823,680 |
| Size | 154.7 MB | 215.4 MB |
| Events in quadrant A | 575,222 | 338,068 |
| Events in quadrant B | 859,436 | 1,341,933 |
| Events in quadrant C | 1,107,604 | 1,960,438 |
| Events in quadrant D | 960,502 | 1,798,804 |
| Mode SS | |||
|---|---|---|---|
| Quadrant | BADHDUFLAG | Total packets | Discarded packets |
| A | 0 | 412 | 0 |
| B | 0 | 412 | 0 |
| C | 0 | 412 | 0 |
| D | 0 | 412 | 0 |
| Mode M0 | |||
|---|---|---|---|
| Quadrant | BADHDUFLAG | Total packets | Discarded packets |
| A | 0 | 155948 | 0 |
| B | 0 | 104612 | 0 |
| C | 0 | 52298 | 0 |
| D | 0 | 54228 | 0 |
| Mode M9 | |||
|---|---|---|---|
| Quadrant | BADHDUFLAG | Total packets | Discarded packets |
| A | 0 | 67 | 0 |
| B | 0 | 67 | 0 |
| C | 0 | 67 | 0 |
| D | 0 | 68 | 0 |
| Quadrant | Total seconds | Saturated seconds | Saturation percentage |
|---|---|---|---|
| A | 20315 | 17342 | 85.365493% |
| B | 20315 | 8278 | 40.748216% |
| C | 20315 | 584 | 2.874723% |
| D | 20315 | 755 | 3.716466% |
Noise dominated data is calculated using 1-second bins in cleaned event files. If a bin has >2000 counts, and if more than 50% of those come from <1% of pixels, then it is considered to be noise-dominated and hence unusable.
| Quadrant | # 1 sec bins | Bins with >0 counts | Bins with >2000 counts | High rate bins dominated by noise | Noise dominated (total time) | Noise dominated (detector-on time) | Marked lightcurve |
|---|---|---|---|---|---|---|---|
| A | 26854 | 20225 | 0 | 0 | 0.00% | 0.00% | 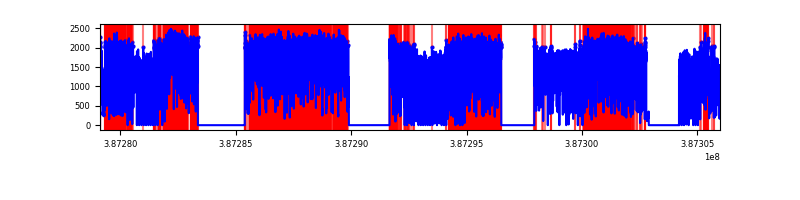 |
| B | 26853 | 20183 | 0 | 0 | 0.00% | 0.00% |  |
| C | 26854 | 20306 | 0 | 0 | 0.00% | 0.00% |  |
| D | 26853 | 20279 | 0 | 0 | 0.00% | 0.00% | 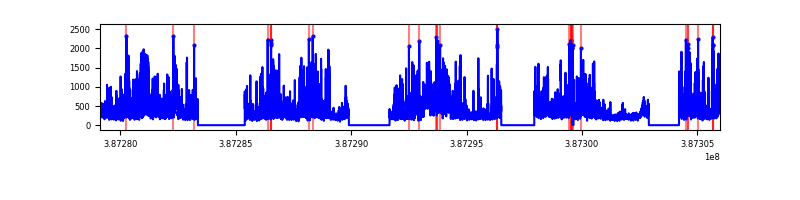 |
Top three noisy pixels from each quadrant. If the there are fewer than three noisy pixels in the level2.evt file, extra rows are filled as -1
| Pixel properties | Quadrant properties | ||||||
|---|---|---|---|---|---|---|---|
| Quadrant | DetID | PixID | Counts | Sigma | Mean | Median | Sigma |
| A | 7 | 110 | 467 | 8.55 | 150 | 142 | 38.0 |
| A | 0 | 29 | 466 | 8.52 | 150 | 142 | 38.0 |
| A | 14 | 95 | 448 | 8.05 | 150 | 142 | 38.0 |
| B | 2 | 9 | 707 | 10.56 | 227 | 217 | 46.4 |
| B | 3 | 80 | 680 | 9.97 | 227 | 217 | 46.4 |
| B | 2 | 8 | 612 | 8.51 | 227 | 217 | 46.4 |
| C | 1 | 81 | 947 | 8.82 | 292 | 275 | 76.2 |
| C | 1 | 80 | 915 | 8.4 | 292 | 275 | 76.2 |
| C | 3 | 203 | 877 | 7.9 | 292 | 275 | 76.2 |
| D | 7 | 3 | 727 | 6.53 | 274 | 251 | 72.9 |
| D | 6 | 62 | 704 | 6.21 | 274 | 251 | 72.9 |
| D | 10 | 113 | 703 | 6.2 | 274 | 251 | 72.9 |
Histogram calculated using DETX and DETY for each event in the final _common_clean file
| Quadrant A |  |
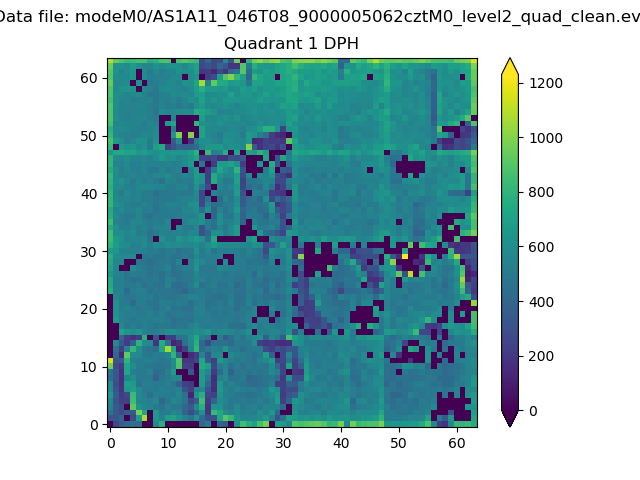 |
Quadrant B |
|---|---|---|---|
| Quadrant D |  |
 |
Quadrant C |
| Plot type | Count rate plots | Images |
|---|---|---|
| Comparison with Poisson distribution Blue bars denote a histogram of data divided into 1 sec bins. Red curve is a Poisson curve with rate = median count rate of data. |
 |
 |
| Quadrant-wise count rates Data is divided into 100 sec bins |
 |
|
| Module-wise count rates for Quadrant A Data is divided into 100 sec bins |
 |
 |
| Module-wise count rates for Quadrant B Data is divided into 100 sec bins |
 |
 |
| Module-wise count rates for Quadrant C Data is divided into 100 sec bins |
 |
 |
| Module-wise count rates for Quadrant D Data is divided into 100 sec bins |
 |
 |
| Parameter | Plot |
|---|---|
| CZT HV Monitor |  |
| D_VDD | 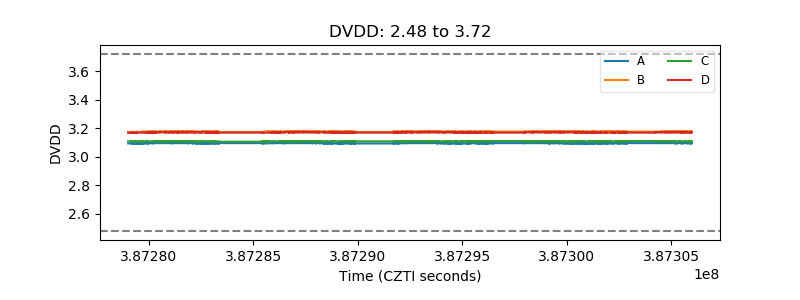 |
| Temperature 1 |  |
| Veto HV Monitor |  |
| Veto LLD |  |
| Alpha Counter |  |
| _CPM_Rate | 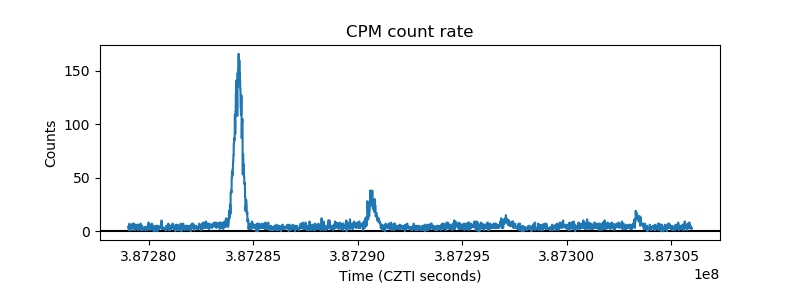 |
| CZT Counter |  |
| +2.5 Volts monitor |  |
| +5 Volts monitor |  |
| _ROLL_ROT |  |
| _Roll_DEC | 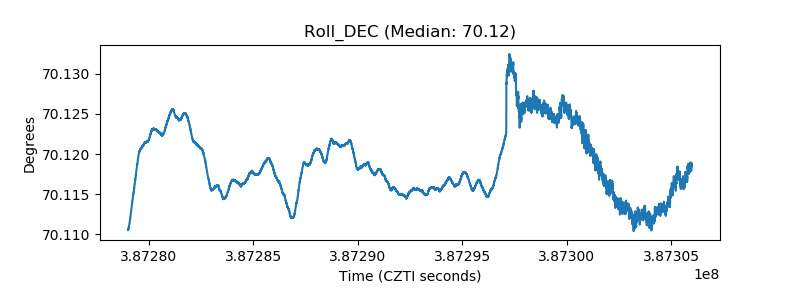 |
| _Roll_RA |  |
| Veto Counter |  |