| Param | Original file | Final file |
|---|---|---|
| Filename | modeM0/AS1A11_046T08_9000005062_35328cztM0_level2.evt | modeM0/AS1A11_046T08_9000005062_35328cztM0_level2_quad_clean.evt |
| Size (bytes) | 315,797,760 | 27,020,160 |
| Size | 301.2 MB | 25.8 MB |
| Events in quadrant A | 3,538,820 | 126,918 |
| Events in quadrant B | 3,044,760 | 158,233 |
| Events in quadrant C | 1,396,386 | 201,823 |
| Events in quadrant D | 1,462,296 | 199,548 |
| Mode SS | |||
|---|---|---|---|
| Quadrant | BADHDUFLAG | Total packets | Discarded packets |
| A | 0 | 36 | 0 |
| B | 0 | 36 | 0 |
| C | 0 | 36 | 0 |
| D | 0 | 36 | 0 |
| Mode M0 | |||
|---|---|---|---|
| Quadrant | BADHDUFLAG | Total packets | Discarded packets |
| A | 0 | 11756 | 1 |
| B | 0 | 10261 | 1 |
| C | 0 | 5248 | 1 |
| D | 0 | 5521 | 1 |
| Quadrant | Total seconds | Saturated seconds | Saturation percentage |
|---|---|---|---|
| A | 1775 | 988 | 55.661972% |
| B | 1775 | 959 | 54.028169% |
| C | 1775 | 169 | 9.521127% |
| D | 1776 | 128 | 7.207207% |
Noise dominated data is calculated using 1-second bins in cleaned event files. If a bin has >2000 counts, and if more than 50% of those come from <1% of pixels, then it is considered to be noise-dominated and hence unusable.
| Quadrant | # 1 sec bins | Bins with >0 counts | Bins with >2000 counts | High rate bins dominated by noise | Noise dominated (total time) | Noise dominated (detector-on time) | Marked lightcurve |
|---|---|---|---|---|---|---|---|
| A | 1775 | 1775 | 1002 | 1002 | 56.45% | 56.45% | 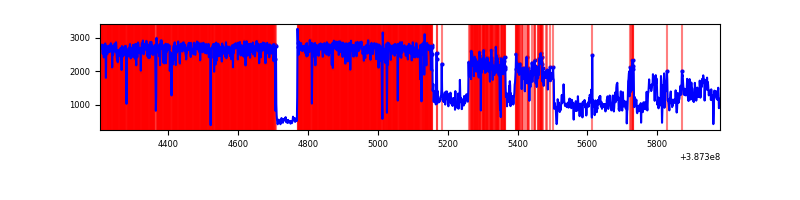 |
| B | 1775 | 1775 | 823 | 823 | 46.37% | 46.37% | 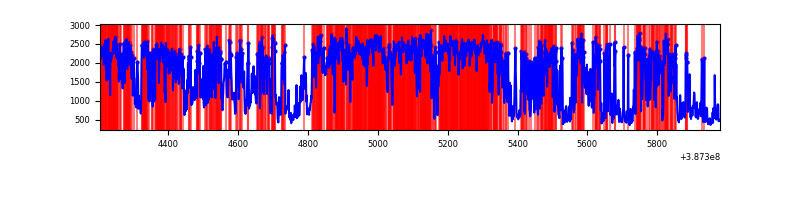 |
| C | 1775 | 1775 | 155 | 155 | 8.73% | 8.73% | 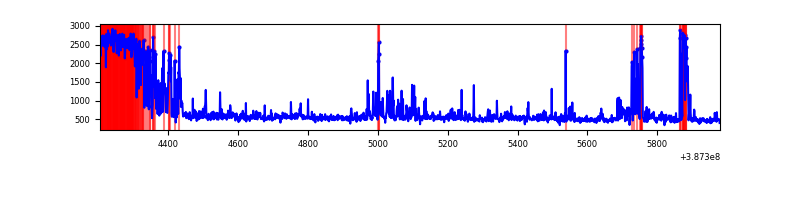 |
| D | 1775 | 1775 | 112 | 112 | 6.31% | 6.31% | 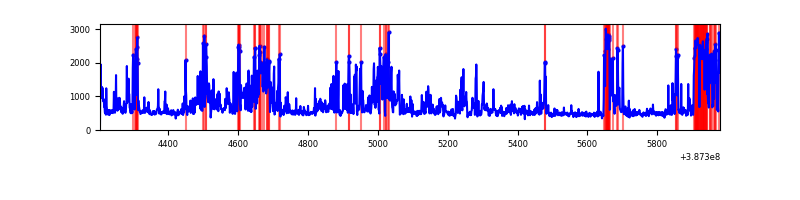 |
Top three noisy pixels from each quadrant. If the there are fewer than three noisy pixels in the level2.evt file, extra rows are filled as -1
| Pixel properties | Quadrant properties | ||||||
|---|---|---|---|---|---|---|---|
| Quadrant | DetID | PixID | Counts | Sigma | Mean | Median | Sigma |
| A | 15 | 169 | 2979071 | 106516.19 | 129 | 127 | 28.0 |
| A | 10 | 83 | 21660 | 769.94 | 129 | 127 | 28.0 |
| A | 9 | 143 | 16262 | 576.93 | 129 | 127 | 28.0 |
| B | 5 | 172 | 1202372 | 38424.12 | 154 | 149 | 31.3 |
| B | 5 | 236 | 1176285 | 37590.35 | 154 | 149 | 31.3 |
| B | 5 | 255 | 21528 | 683.29 | 154 | 149 | 31.3 |
| C | 0 | 10 | 551028 | 11958.18 | 192 | 192 | 46.1 |
| C | 15 | 214 | 72728 | 1574.69 | 192 | 192 | 46.1 |
| C | 10 | 49 | 7258 | 153.4 | 192 | 192 | 46.1 |
| D | 12 | 233 | 217598 | 4325.07 | 198 | 191 | 50.3 |
| D | 12 | 235 | 126249 | 2507.78 | 198 | 191 | 50.3 |
| D | 10 | 118 | 108478 | 2154.25 | 198 | 191 | 50.3 |
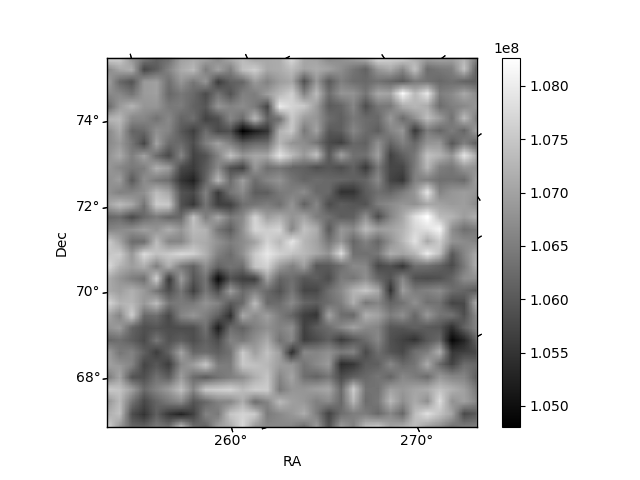
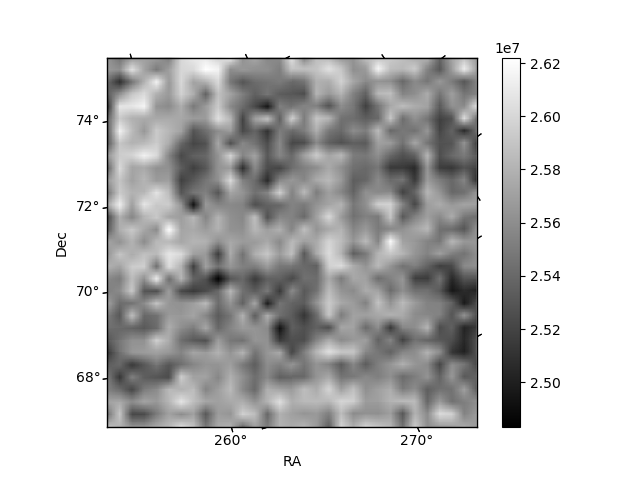
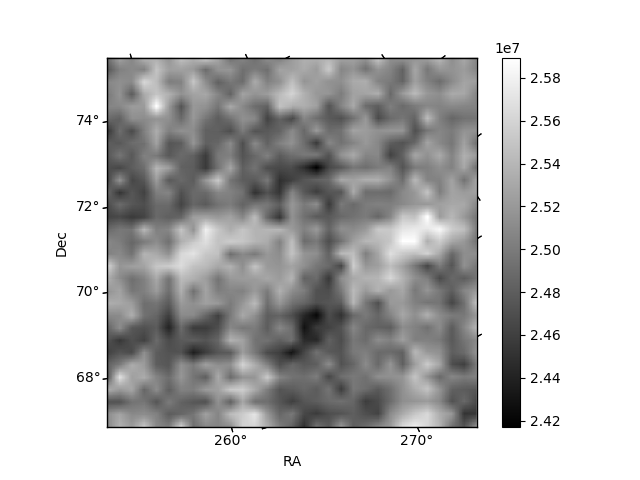
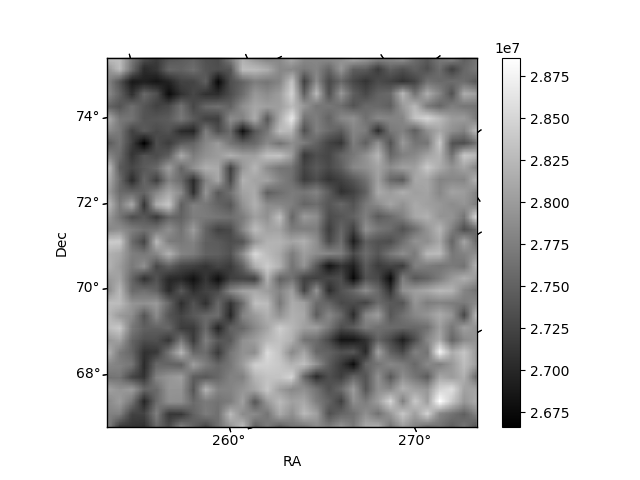
Histogram calculated using DETX and DETY for each event in the final _common_clean file
| Quadrant A | 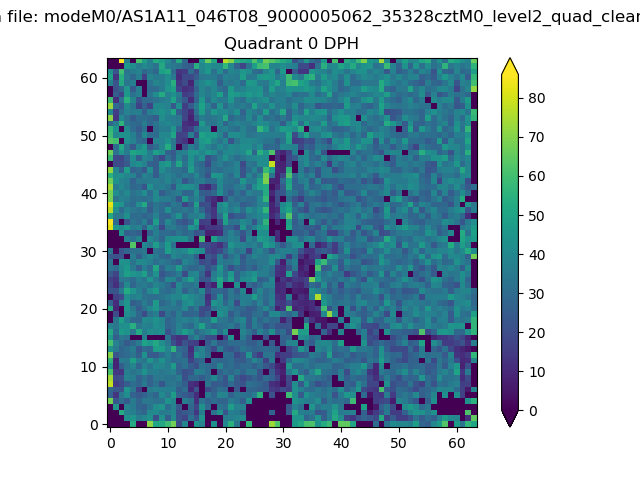 |
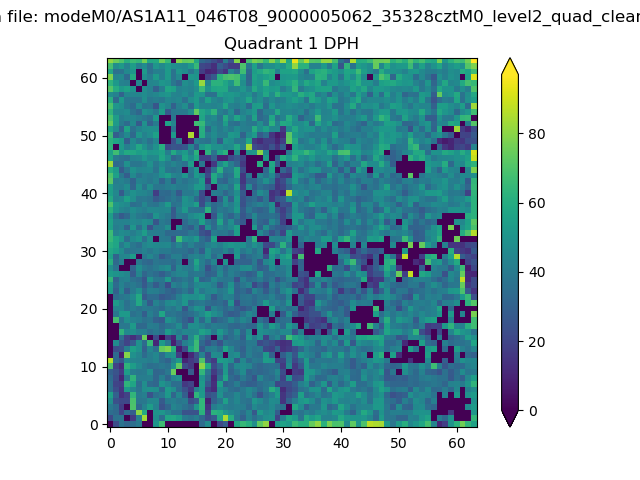 |
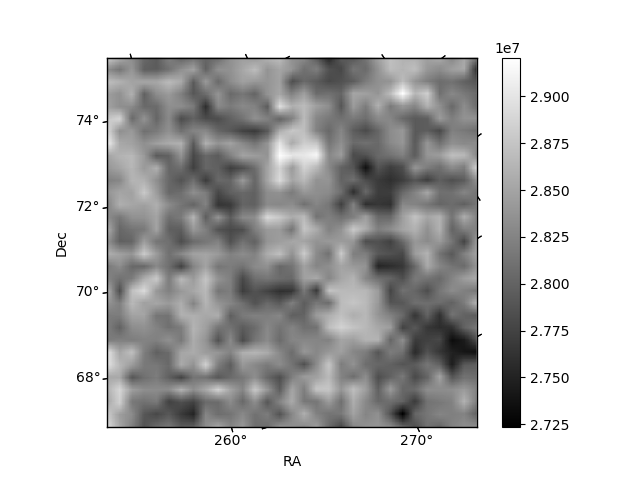
Quadrant B |
|---|---|---|---|
| Quadrant D | 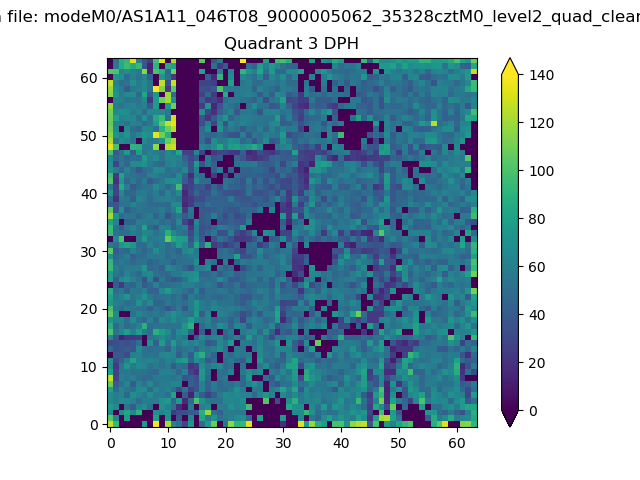 |
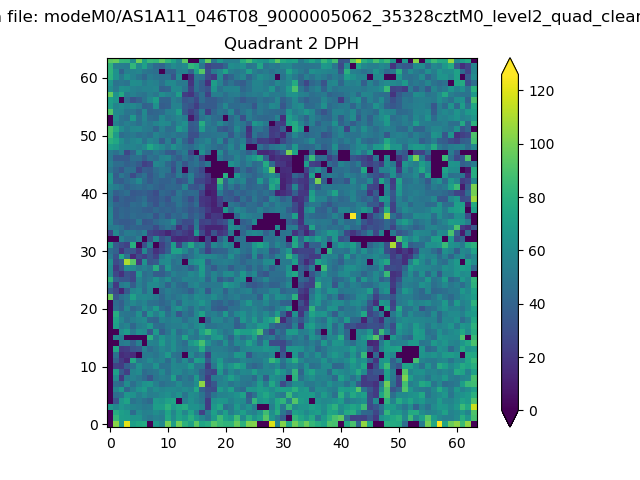 |
Quadrant C |
| Plot type | Count rate plots | Images |
|---|---|---|
| Comparison with Poisson distribution Blue bars denote a histogram of data divided into 1 sec bins. Red curve is a Poisson curve with rate = median count rate of data. |
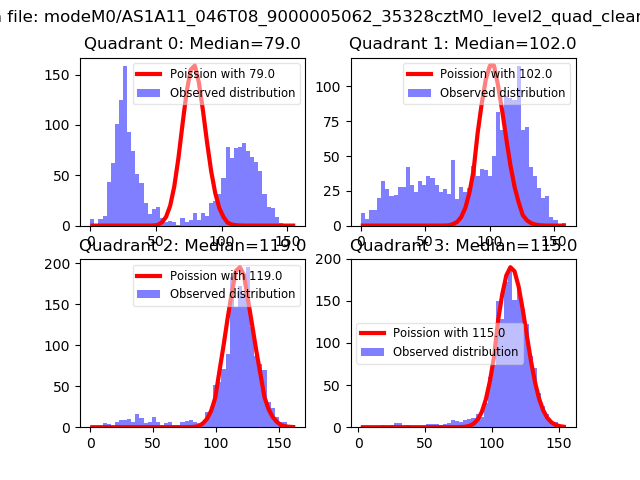 |
 |
| Quadrant-wise count rates Data is divided into 100 sec bins |
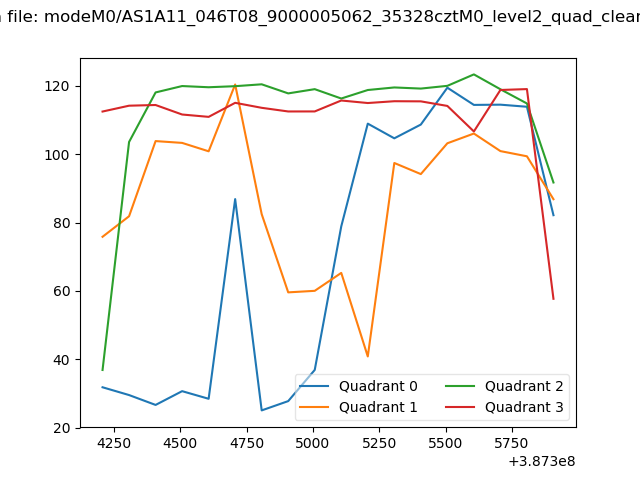 |
|
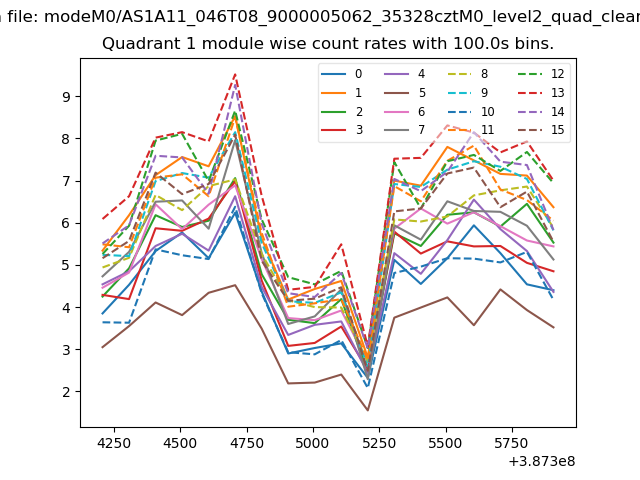
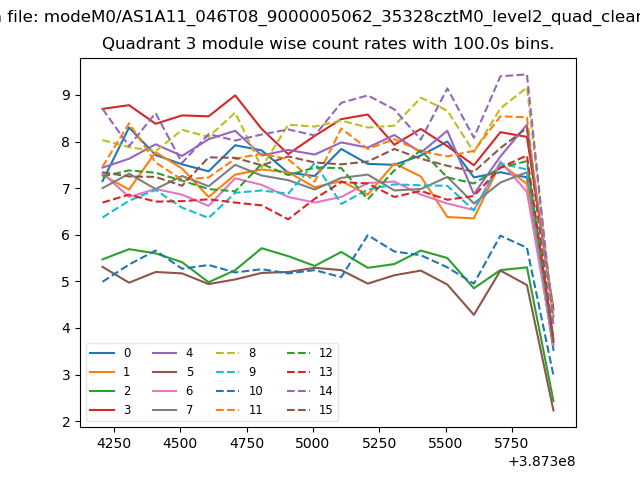
| Module-wise count rates for Quadrant A Data is divided into 100 sec bins |
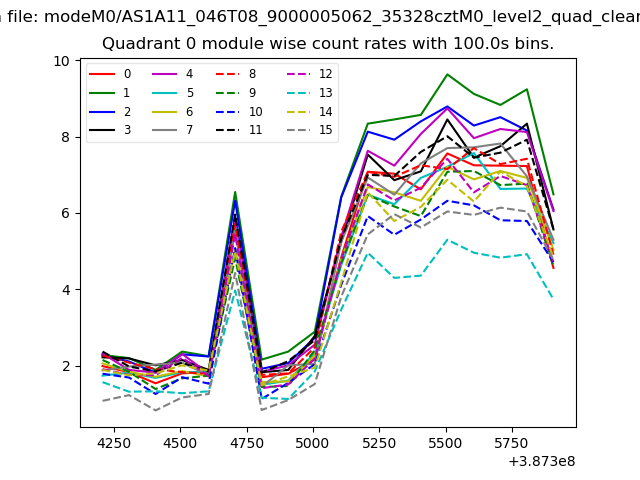 |
 |
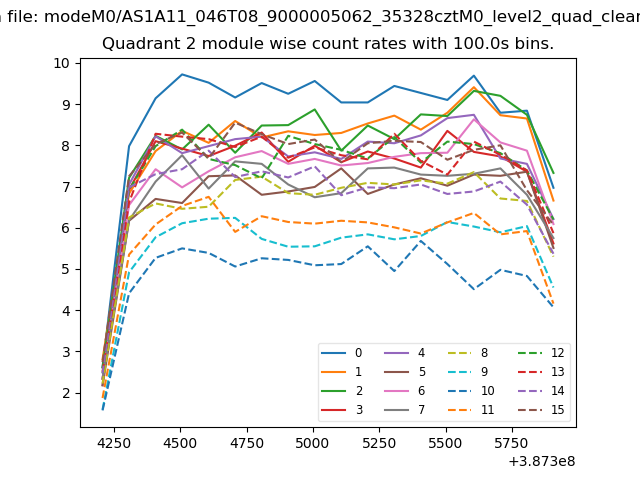
| Module-wise count rates for Quadrant B Data is divided into 100 sec bins |
 |
 |
| Module-wise count rates for Quadrant C Data is divided into 100 sec bins |
 |
 |
| Module-wise count rates for Quadrant D Data is divided into 100 sec bins |
 |
 |
| Parameter | Plot |
|---|---|
| CZT HV Monitor | 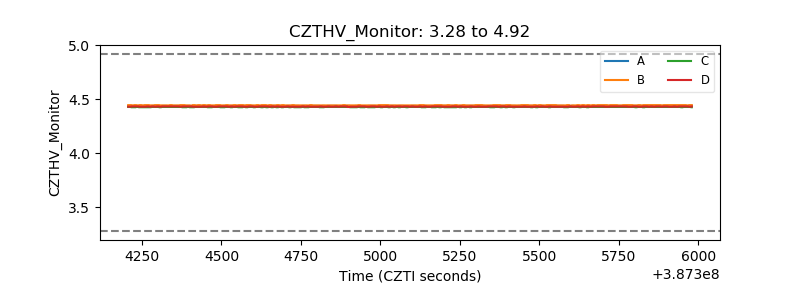 |
| D_VDD | 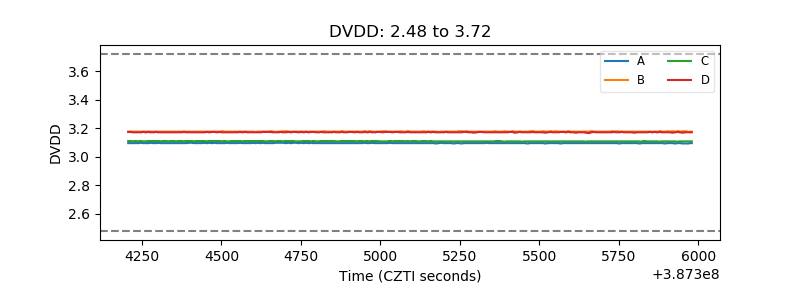 |
| Temperature 1 | 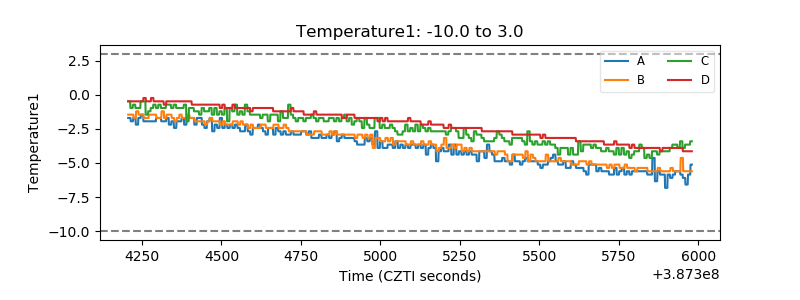 |
| Veto HV Monitor | 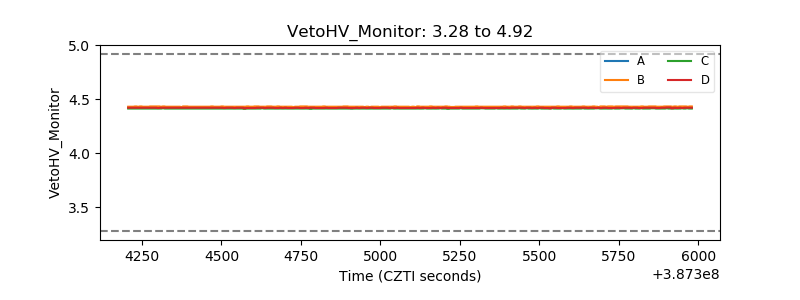 |
| Veto LLD | 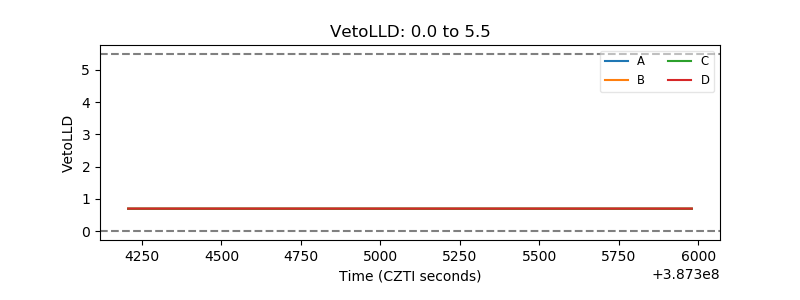 |
| Alpha Counter | 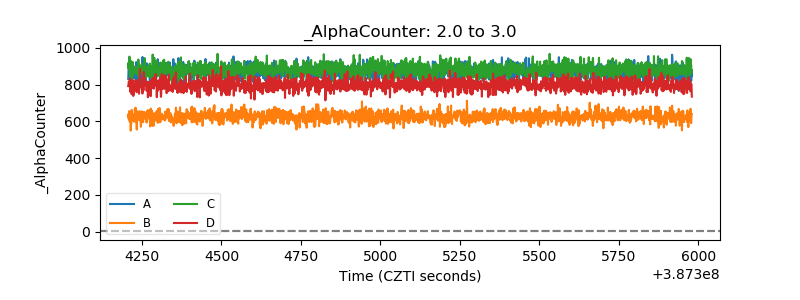 |
| _CPM_Rate | 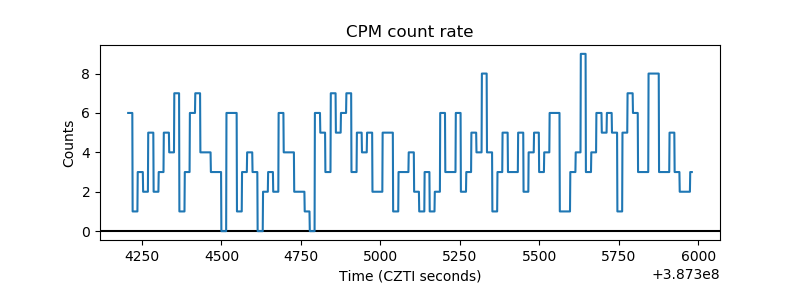 |
| CZT Counter | 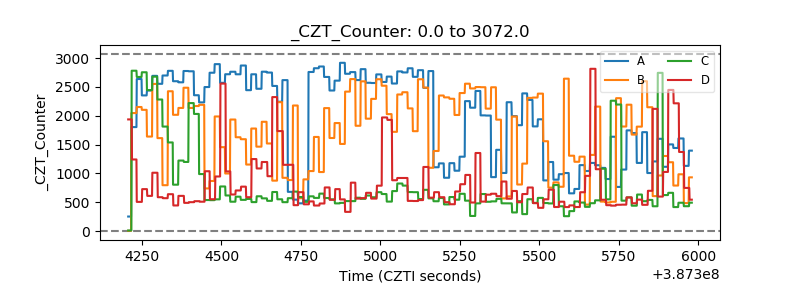 |
| +2.5 Volts monitor | 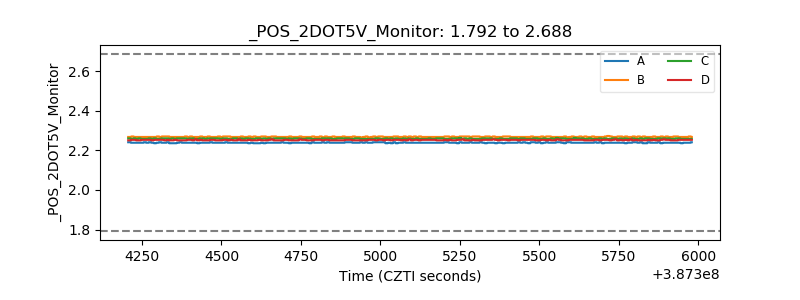 |
| +5 Volts monitor | 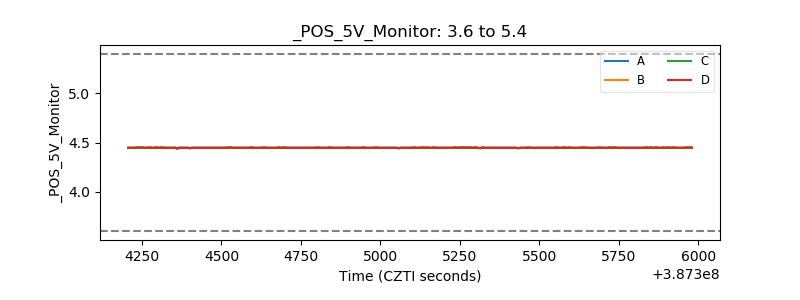 |
| _ROLL_ROT | 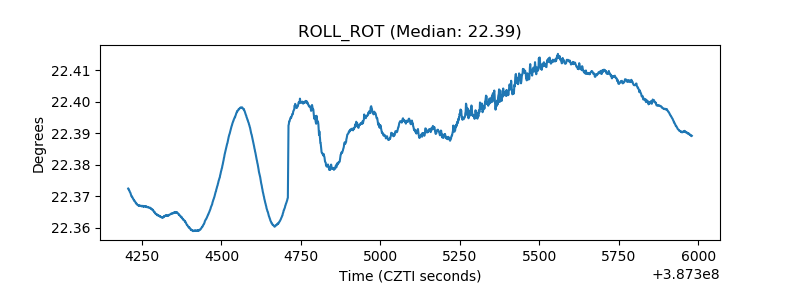 |
| _Roll_DEC | 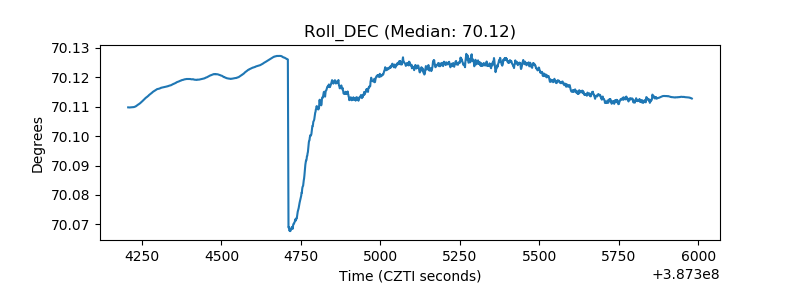 |
| _Roll_RA | 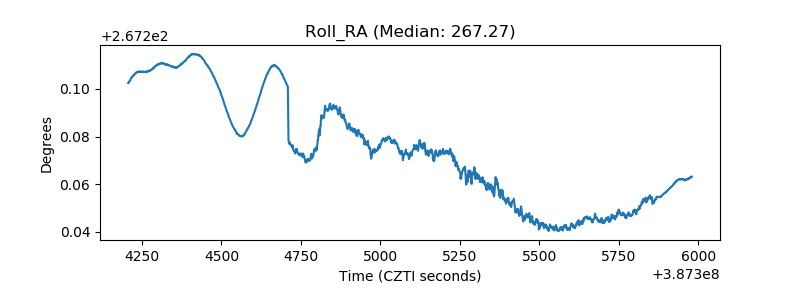 |
| Veto Counter | 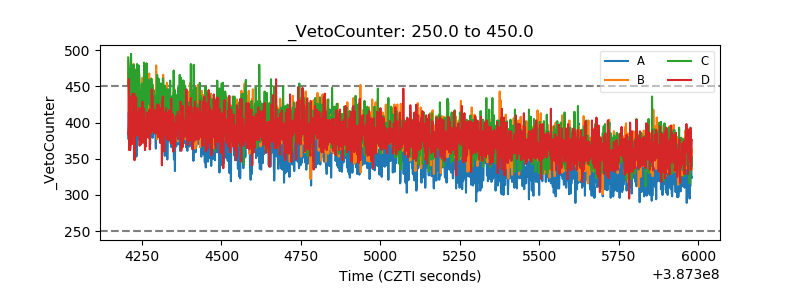 |