| Param | Original file | Final file |
|---|---|---|
| Filename | modeM0/AS1A11_093T01_9000005064cztM0_level2.fits | modeM0/AS1A11_093T01_9000005064cztM0_level2_quad_clean.evt |
| Size (bytes) | 1,045,742,400 | 1,113,837,120 |
| Size | 997.3 MB | 1.0 GB |
| Events in quadrant A | 6,475,122 | 6,937,562 |
| Events in quadrant B | 5,646,120 | 6,021,024 |
| Events in quadrant C | 6,341,828 | 6,914,842 |
| Events in quadrant D | 5,409,008 | 6,072,415 |
| Mode M0 | |||
|---|---|---|---|
| Quadrant | BADHDUFLAG | Total packets | Discarded packets |
| A | 0 | 244228 | 0 |
| B | 0 | 410896 | 0 |
| C | 0 | 253811 | 0 |
| D | 0 | 309128 | 0 |
| Mode SS | |||
|---|---|---|---|
| Quadrant | BADHDUFLAG | Total packets | Discarded packets |
| A | 0 | 2318 | 0 |
| B | 0 | 2318 | 0 |
| C | 0 | 2318 | 0 |
| D | 0 | 2318 | 0 |
| Mode M9 | |||
|---|---|---|---|
| Quadrant | BADHDUFLAG | Total packets | Discarded packets |
| A | 0 | 437 | 0 |
| B | 0 | 437 | 0 |
| C | 0 | 437 | 0 |
| D | 0 | 437 | 0 |
| Quadrant | Total seconds | Saturated seconds | Saturation percentage |
|---|---|---|---|
| A | 113629 | 1042 | 0.917019% |
| B | 113629 | 21473 | 18.897465% |
| C | 113629 | 1443 | 1.269922% |
| D | 113628 | 4394 | 3.867005% |
Noise dominated data is calculated using 1-second bins in cleaned event files. If a bin has >2000 counts, and if more than 50% of those come from <1% of pixels, then it is considered to be noise-dominated and hence unusable.
| Quadrant | # 1 sec bins | Bins with >0 counts | Bins with >2000 counts | High rate bins dominated by noise | Noise dominated (total time) | Noise dominated (detector-on time) | Marked lightcurve |
|---|---|---|---|---|---|---|---|
| A | 157307 | 113614 | 0 | 0 | 0.00% | 0.00% |  |
| B | 157307 | 113272 | 0 | 0 | 0.00% | 0.00% |  |
| C | 157307 | 113592 | 0 | 0 | 0.00% | 0.00% |  |
| D | 157307 | 113463 | 0 | 0 | 0.00% | 0.00% |  |
Top three noisy pixels from each quadrant. If the there are fewer than three noisy pixels in the level2.evt file, extra rows are filled as -1
| Pixel properties | Quadrant properties | ||||||
|---|---|---|---|---|---|---|---|
| Quadrant | DetID | PixID | Counts | Sigma | Mean | Median | Sigma |
| A | 9 | 19 | 5241 | 8.82 | 1695 | 1600 | 412.8 |
| A | 7 | 110 | 5213 | 8.75 | 1695 | 1600 | 412.8 |
| A | 0 | 29 | 5183 | 8.68 | 1695 | 1600 | 412.8 |
| B | 2 | 9 | 4952 | 12.21 | 1494 | 1431 | 288.2 |
| B | 3 | 80 | 4215 | 9.66 | 1494 | 1431 | 288.2 |
| B | 2 | 8 | 3963 | 8.78 | 1494 | 1431 | 288.2 |
| C | 1 | 81 | 5413 | 8.89 | 1677 | 1577 | 431.3 |
| C | 1 | 80 | 5251 | 8.52 | 1677 | 1577 | 431.3 |
| C | 3 | 202 | 4959 | 7.84 | 1677 | 1577 | 431.3 |
| D | 10 | 189 | 3965 | 6.2 | 1548 | 1413 | 411.6 |
| D | 7 | 3 | 3953 | 6.17 | 1548 | 1413 | 411.6 |
| D | 4 | 160 | 3951 | 6.17 | 1548 | 1413 | 411.6 |
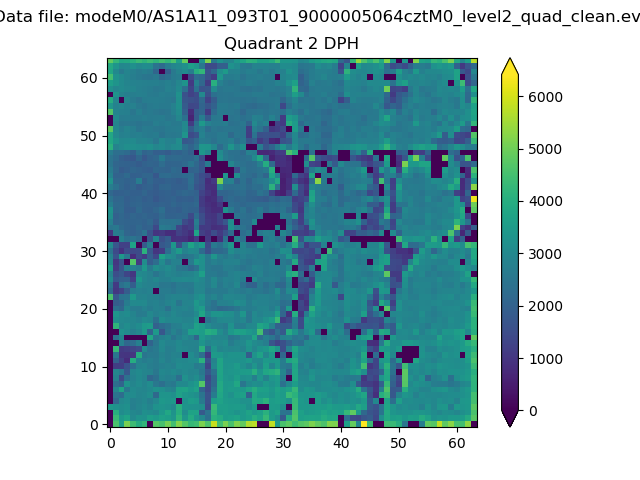
Histogram calculated using DETX and DETY for each event in the final _common_clean file
| Quadrant A |  |
 |
Quadrant B |
|---|---|---|---|
| Quadrant D | 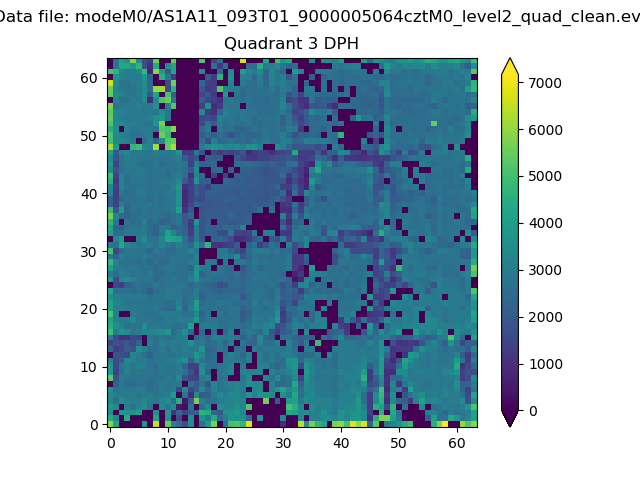 |
 |
Quadrant C |
| Plot type | Count rate plots | Images |
|---|---|---|
| Comparison with Poisson distribution Blue bars denote a histogram of data divided into 1 sec bins. Red curve is a Poisson curve with rate = median count rate of data. |
 |
 |
| Quadrant-wise count rates Data is divided into 100 sec bins |
 |
|
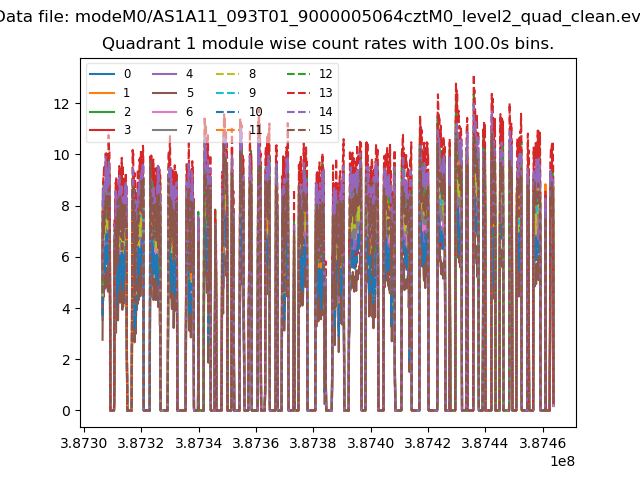
| Module-wise count rates for Quadrant A Data is divided into 100 sec bins |
 |
 |
| Module-wise count rates for Quadrant B Data is divided into 100 sec bins |
 |
 |
| Module-wise count rates for Quadrant C Data is divided into 100 sec bins |
 |
 |
| Module-wise count rates for Quadrant D Data is divided into 100 sec bins |
 |
 |
| Parameter | Plot |
|---|---|
| CZT HV Monitor |  |
| D_VDD |  |
| Temperature 1 |  |
| Veto HV Monitor |  |
| Veto LLD |  |
| Alpha Counter |  |
| _CPM_Rate |  |
| CZT Counter |  |
| +2.5 Volts monitor |  |
| +5 Volts monitor |  |
| _ROLL_ROT |  |
| _Roll_DEC |  |
| _Roll_RA | 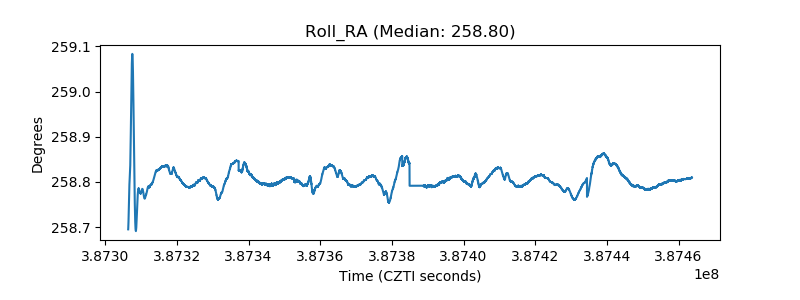 |
| Veto Counter | 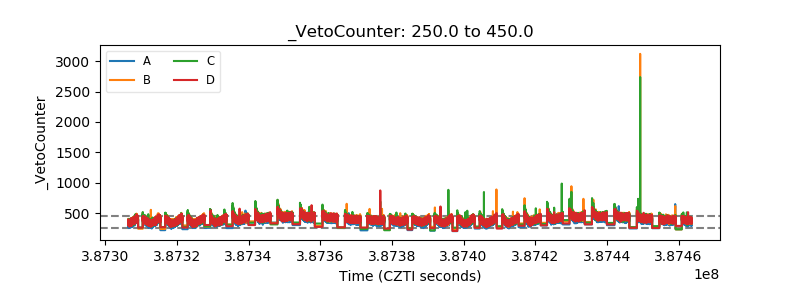 |