| Param | Original file | Final file |
|---|---|---|
| Filename | modeM0/AS1A11_093T01_9000005064_35328cztM0_level2.evt | modeM0/AS1A11_093T01_9000005064_35328cztM0_level2_quad_clean.evt |
| Size (bytes) | 1,357,871,040 | 221,515,200 |
| Size | 1.3 GB | 211.3 MB |
| Events in quadrant A | 9,445,796 | 1,449,586 |
| Events in quadrant B | 14,830,565 | 1,363,074 |
| Events in quadrant C | 7,361,840 | 1,534,078 |
| Events in quadrant D | 8,573,681 | 1,426,957 |
| Mode M0 | |||
|---|---|---|---|
| Quadrant | BADHDUFLAG | Total packets | Discarded packets |
| A | 0 | 37381 | 4 |
| B | 0 | 53324 | 3 |
| C | 0 | 30095 | 3 |
| D | 0 | 34764 | 3 |
| Mode SS | |||
|---|---|---|---|
| Quadrant | BADHDUFLAG | Total packets | Discarded packets |
| A | 0 | 276 | 0 |
| B | 0 | 276 | 0 |
| C | 0 | 276 | 0 |
| D | 0 | 276 | 0 |
| Mode M9 | |||
|---|---|---|---|
| Quadrant | BADHDUFLAG | Total packets | Discarded packets |
| A | 0 | 41 | 0 |
| B | 0 | 41 | 0 |
| C | 0 | 41 | 0 |
| D | 0 | 41 | 0 |
| Quadrant | Total seconds | Saturated seconds | Saturation percentage |
|---|---|---|---|
| A | 13522 | 683 | 5.051028% |
| B | 13522 | 2908 | 21.505694% |
| C | 13522 | 173 | 1.279397% |
| D | 13522 | 489 | 3.616329% |
Noise dominated data is calculated using 1-second bins in cleaned event files. If a bin has >2000 counts, and if more than 50% of those come from <1% of pixels, then it is considered to be noise-dominated and hence unusable.
| Quadrant | # 1 sec bins | Bins with >0 counts | Bins with >2000 counts | High rate bins dominated by noise | Noise dominated (total time) | Noise dominated (detector-on time) | Marked lightcurve |
|---|---|---|---|---|---|---|---|
| A | 17701 | 13525 | 743 | 743 | 4.20% | 5.49% | 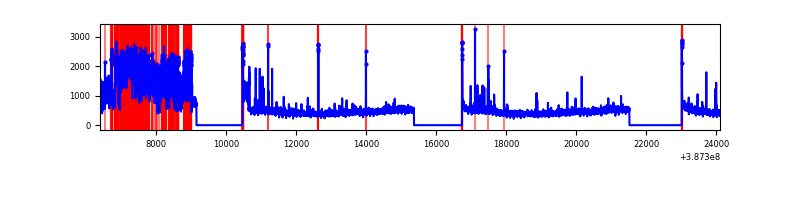 |
| B | 17701 | 13523 | 2116 | 2116 | 11.95% | 15.65% | 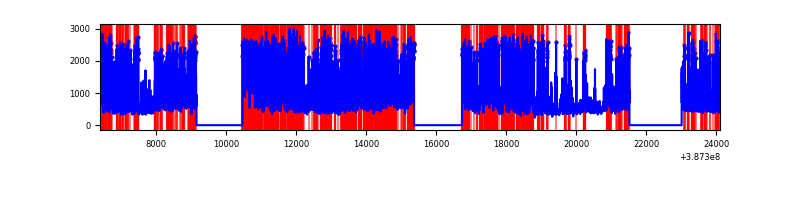 |
| C | 17701 | 13525 | 137 | 137 | 0.77% | 1.01% | 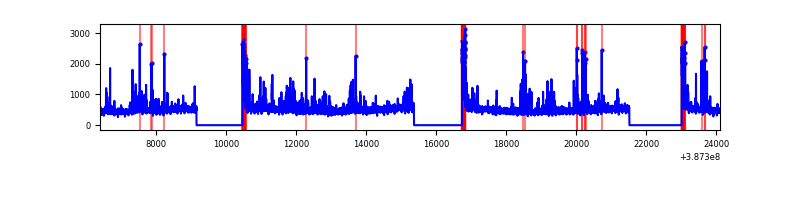 |
| D | 17701 | 13525 | 441 | 441 | 2.49% | 3.26% | 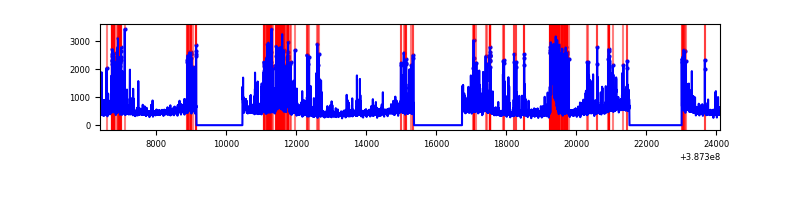 |
Top three noisy pixels from each quadrant. If the there are fewer than three noisy pixels in the level2.evt file, extra rows are filled as -1
| Pixel properties | Quadrant properties | ||||||
|---|---|---|---|---|---|---|---|
| Quadrant | DetID | PixID | Counts | Sigma | Mean | Median | Sigma |
| A | 15 | 169 | 3121904 | 10355.79 | 1511 | 1481 | 301.3 |
| A | 10 | 83 | 185395 | 610.36 | 1511 | 1481 | 301.3 |
| A | 7 | 3 | 58219 | 188.3 | 1511 | 1481 | 301.3 |
| B | 5 | 236 | 5751099 | 21562.74 | 1401 | 1362 | 266.7 |
| B | 5 | 172 | 3195280 | 11977.87 | 1401 | 1362 | 266.7 |
| B | 5 | 200 | 146548 | 544.48 | 1401 | 1362 | 266.7 |
| C | 0 | 10 | 839051 | 2440.91 | 1495 | 1509 | 343.1 |
| C | 15 | 214 | 547710 | 1591.83 | 1495 | 1509 | 343.1 |
| C | 3 | 233 | 58382 | 165.75 | 1495 | 1509 | 343.1 |
| D | 1 | 47 | 694512 | 1961.48 | 1468 | 1428 | 353.3 |
| D | 8 | 195 | 526525 | 1486.06 | 1468 | 1428 | 353.3 |
| D | 2 | 153 | 454206 | 1281.4 | 1468 | 1428 | 353.3 |
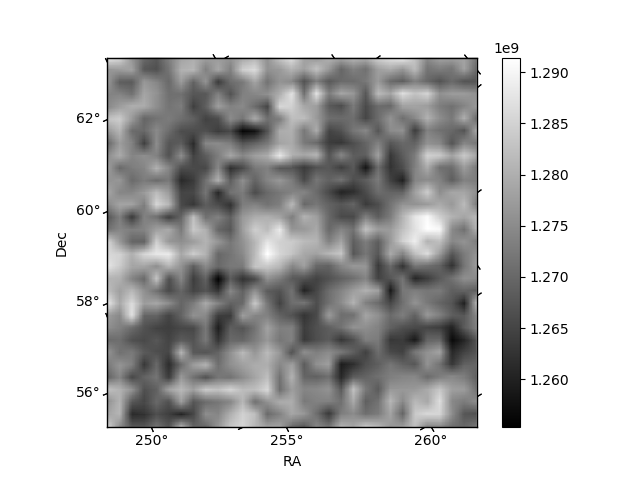
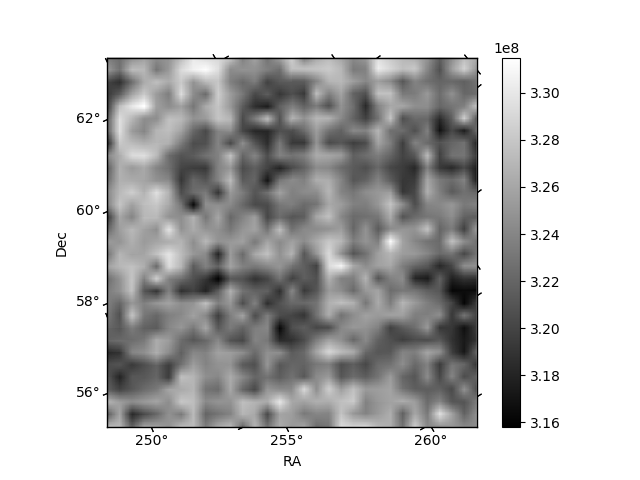
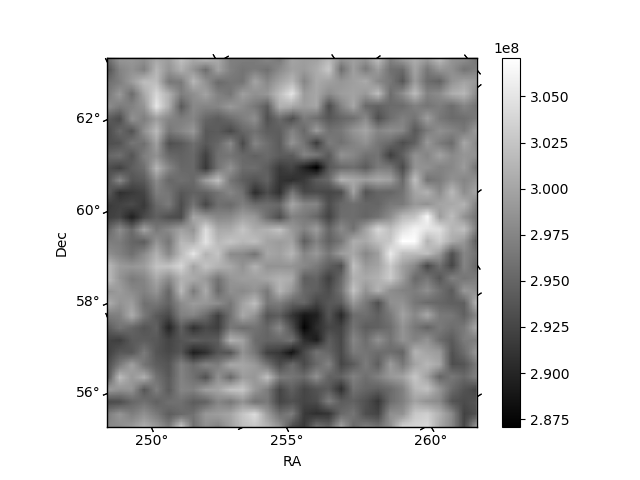
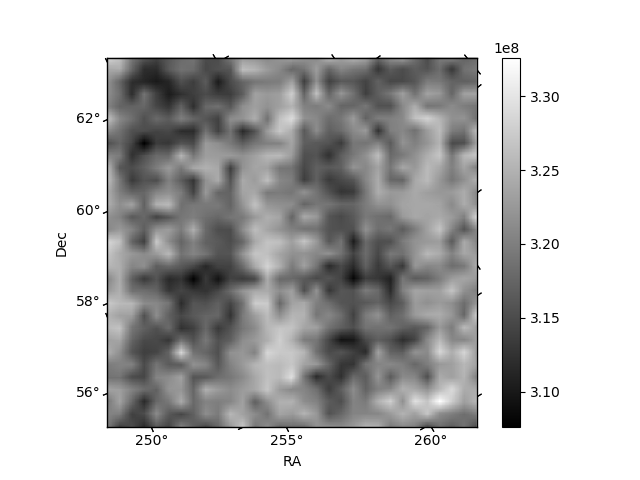
Histogram calculated using DETX and DETY for each event in the final _common_clean file
| Quadrant A | 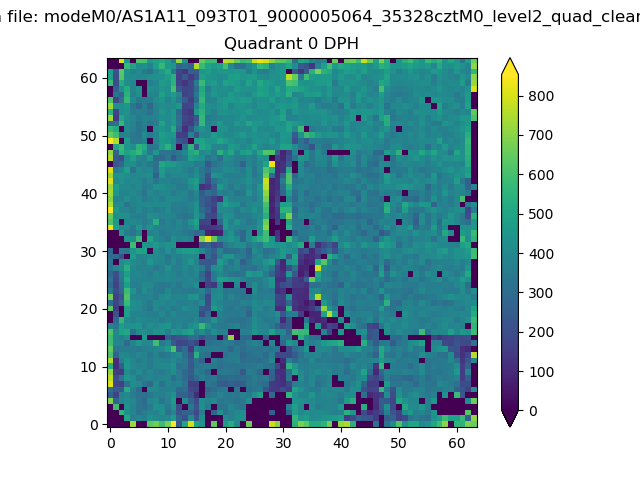 |
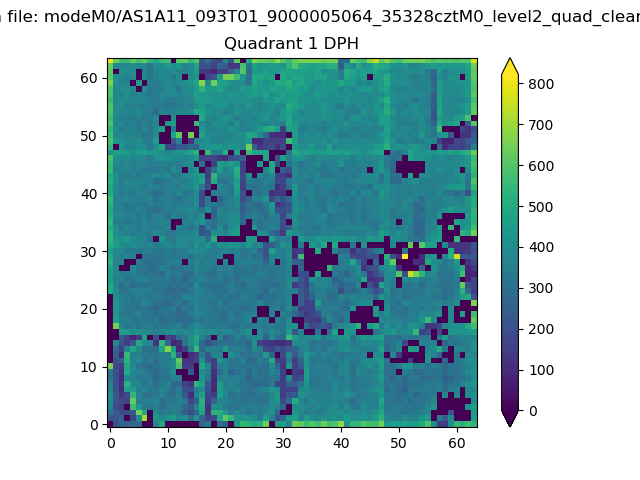 |
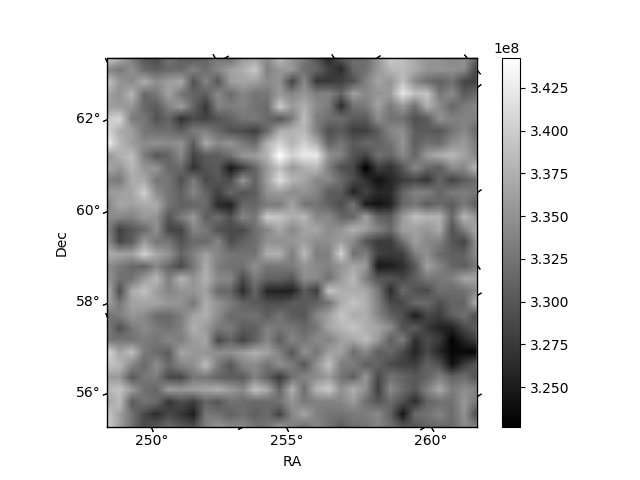
Quadrant B |
|---|---|---|---|
| Quadrant D | 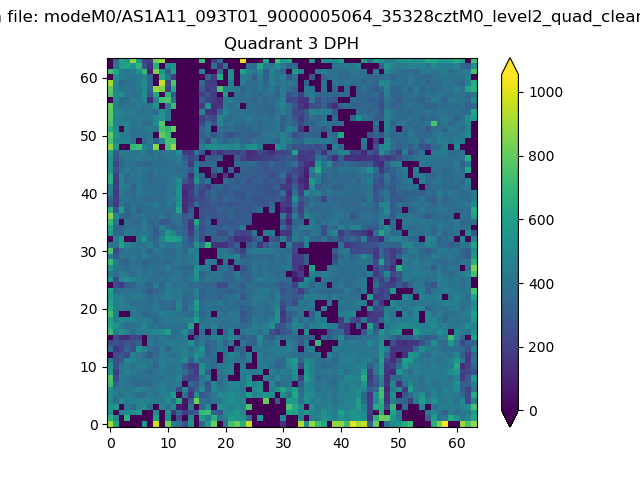 |
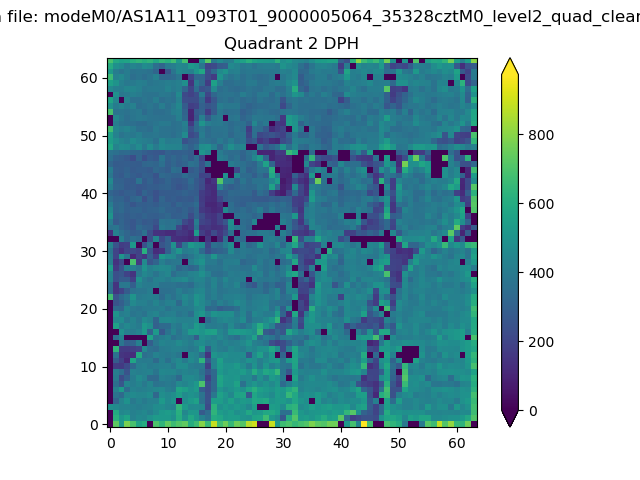 |
Quadrant C |
| Plot type | Count rate plots | Images |
|---|---|---|
| Comparison with Poisson distribution Blue bars denote a histogram of data divided into 1 sec bins. Red curve is a Poisson curve with rate = median count rate of data. |
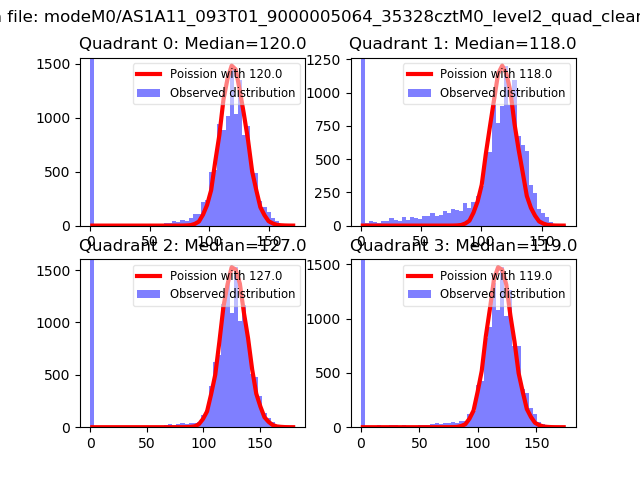 |
 |
| Quadrant-wise count rates Data is divided into 100 sec bins |
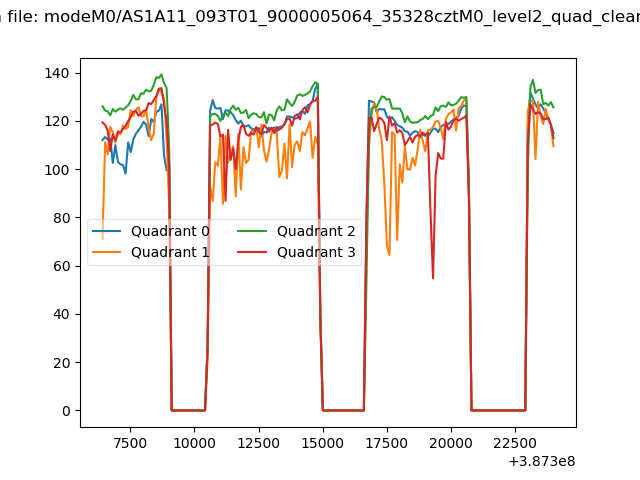 |
|
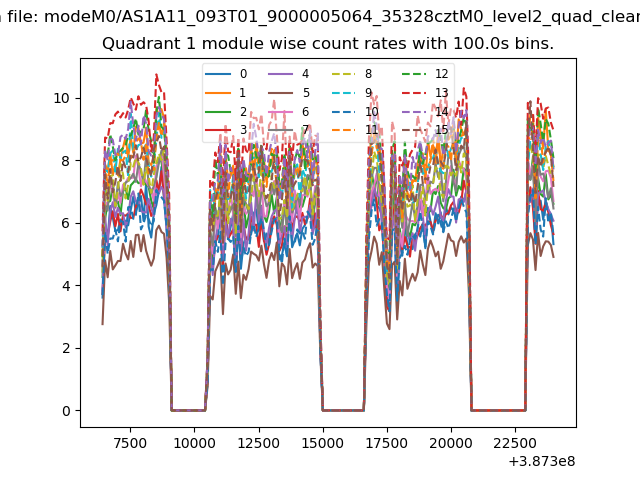
| Module-wise count rates for Quadrant A Data is divided into 100 sec bins |
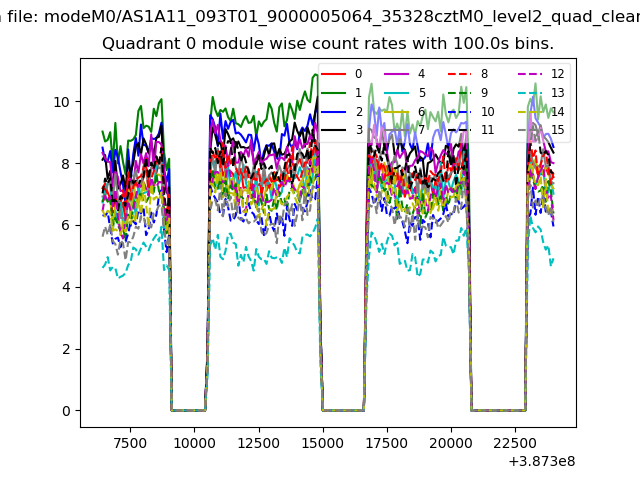 |
 |
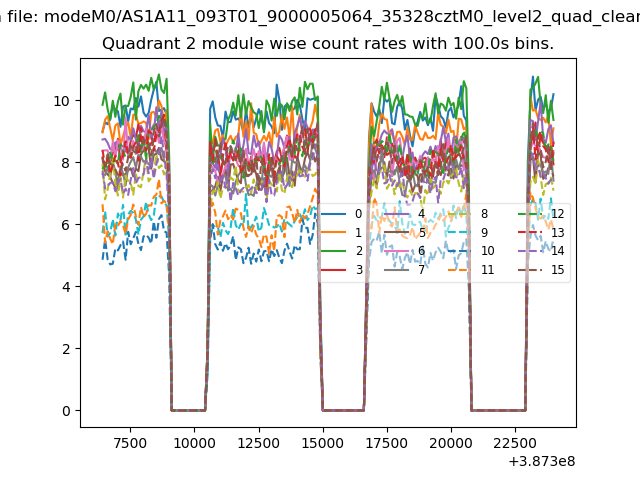
| Module-wise count rates for Quadrant B Data is divided into 100 sec bins |
 |
 |
| Module-wise count rates for Quadrant C Data is divided into 100 sec bins |
 |
 |
| Module-wise count rates for Quadrant D Data is divided into 100 sec bins |
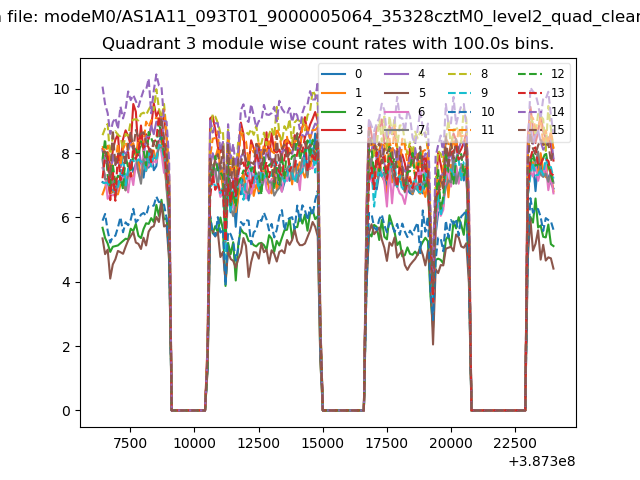 |
 |
| Parameter | Plot |
|---|---|
| CZT HV Monitor | 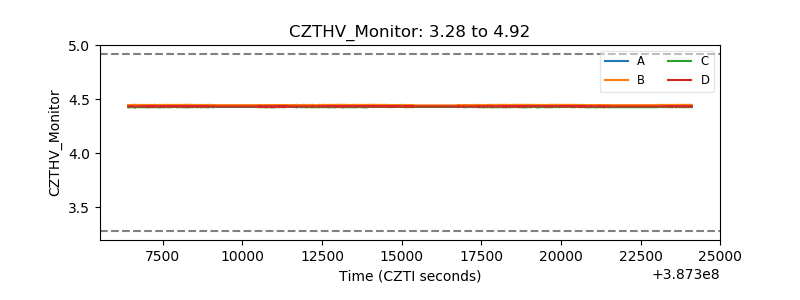 |
| D_VDD | 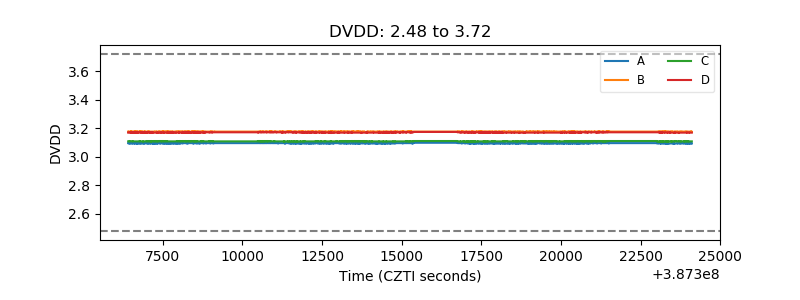 |
| Temperature 1 | 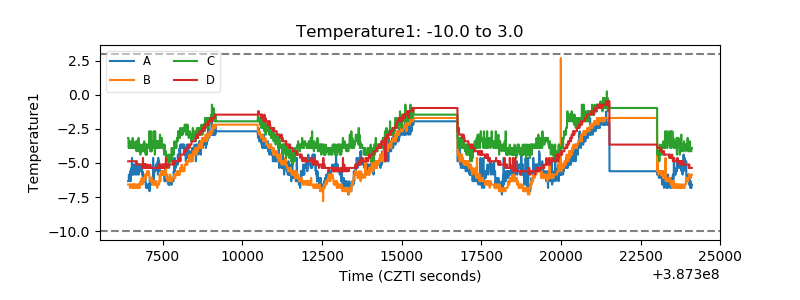 |
| Veto HV Monitor | 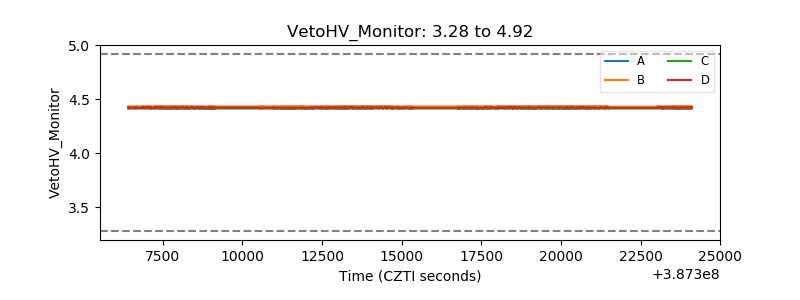 |
| Veto LLD | 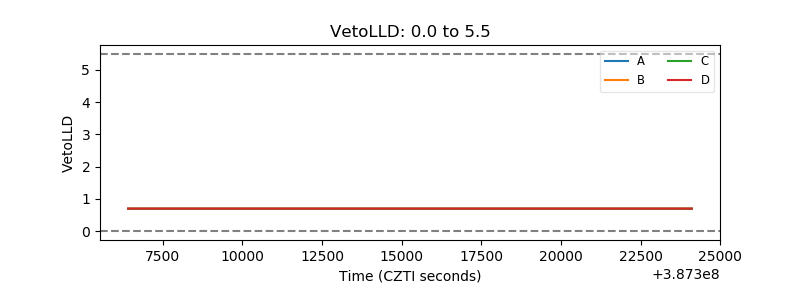 |
| Alpha Counter | 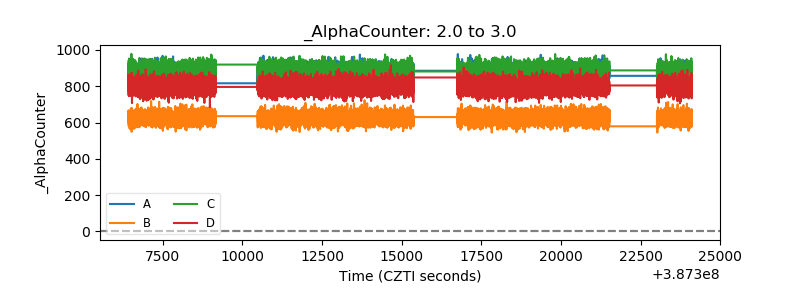 |
| _CPM_Rate |  |
| CZT Counter | 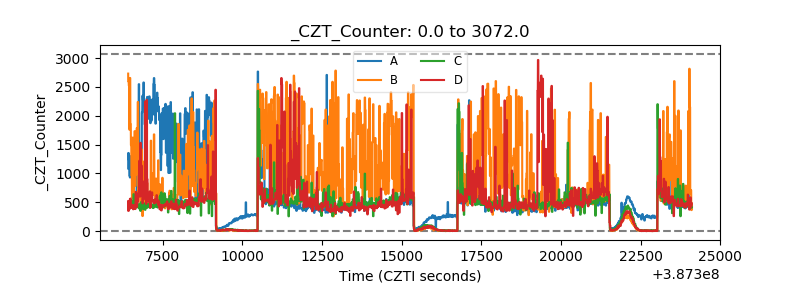 |
| +2.5 Volts monitor | 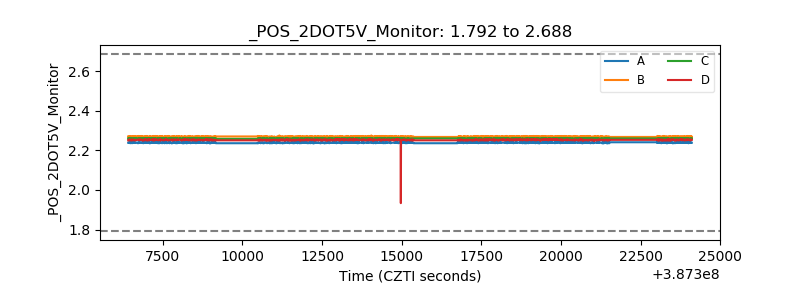 |
| +5 Volts monitor |  |
| _ROLL_ROT | 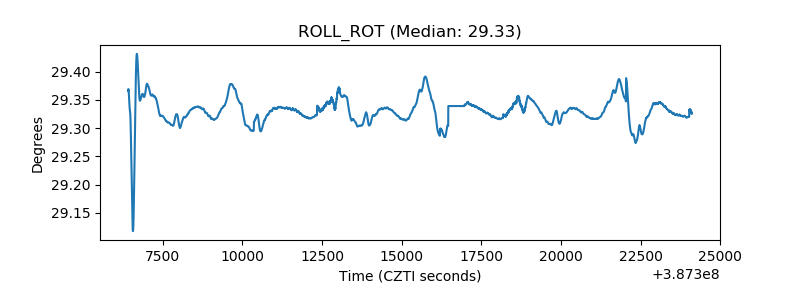 |
| _Roll_DEC | 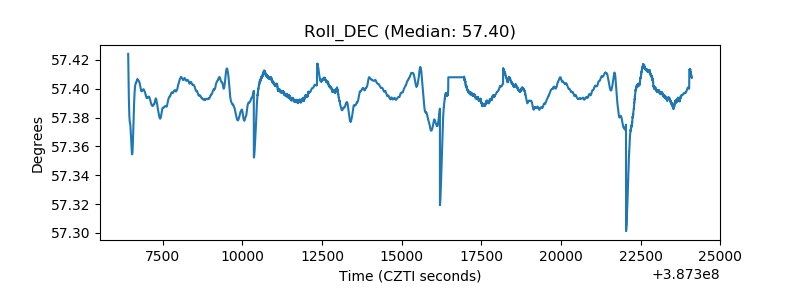 |
| _Roll_RA | 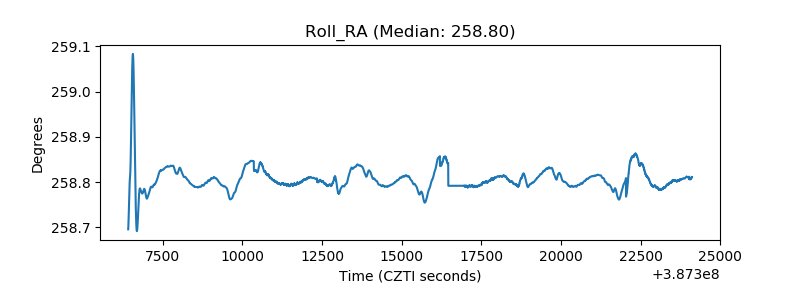 |
| Veto Counter | 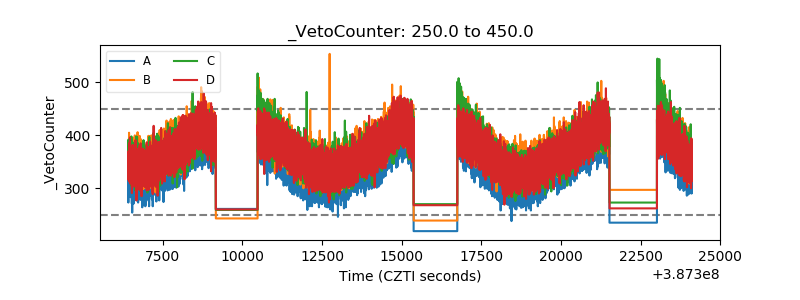 |