| Param | Original file | Final file |
|---|---|---|
| Filename | modeM0/AS1A11_093T01_9000005064_35335cztM0_level2.evt | modeM0/AS1A11_093T01_9000005064_35335cztM0_level2_quad_clean.evt |
| Size (bytes) | 536,126,400 | 72,921,600 |
| Size | 511.3 MB | 69.5 MB |
| Events in quadrant A | 2,520,652 | 489,882 |
| Events in quadrant B | 7,591,562 | 415,108 |
| Events in quadrant C | 2,840,162 | 487,615 |
| Events in quadrant D | 2,945,279 | 464,565 |
| Mode M0 | |||
|---|---|---|---|
| Quadrant | BADHDUFLAG | Total packets | Discarded packets |
| A | 0 | 10391 | 3 |
| B | 0 | 25964 | 2 |
| C | 0 | 11191 | 2 |
| D | 0 | 11877 | 2 |
| Mode SS | |||
|---|---|---|---|
| Quadrant | BADHDUFLAG | Total packets | Discarded packets |
| A | 0 | 100 | 0 |
| B | 0 | 100 | 0 |
| C | 0 | 100 | 0 |
| D | 0 | 100 | 0 |
| Mode M9 | |||
|---|---|---|---|
| Quadrant | BADHDUFLAG | Total packets | Discarded packets |
| A | 0 | 27 | 0 |
| B | 0 | 27 | 0 |
| C | 0 | 27 | 0 |
| D | 0 | 28 | 0 |
| Quadrant | Total seconds | Saturated seconds | Saturation percentage |
|---|---|---|---|
| A | 5003 | 18 | 0.359784% |
| B | 5003 | 2173 | 43.433940% |
| C | 5003 | 91 | 1.818909% |
| D | 5003 | 92 | 1.838897% |
Noise dominated data is calculated using 1-second bins in cleaned event files. If a bin has >2000 counts, and if more than 50% of those come from <1% of pixels, then it is considered to be noise-dominated and hence unusable.
| Quadrant | # 1 sec bins | Bins with >0 counts | Bins with >2000 counts | High rate bins dominated by noise | Noise dominated (total time) | Noise dominated (detector-on time) | Marked lightcurve |
|---|---|---|---|---|---|---|---|
| A | 7156 | 5004 | 13 | 13 | 0.18% | 0.26% | 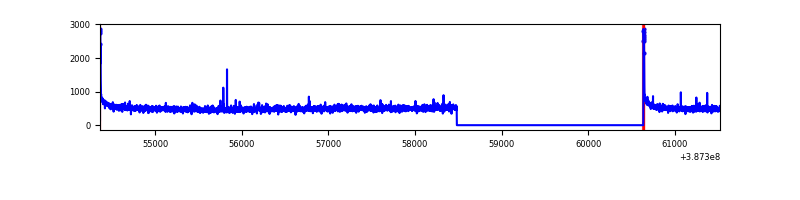 |
| B | 7156 | 5004 | 1826 | 1826 | 25.52% | 36.49% | 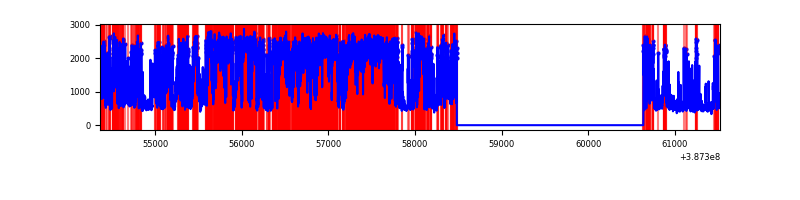 |
| C | 7156 | 5004 | 91 | 91 | 1.27% | 1.82% | 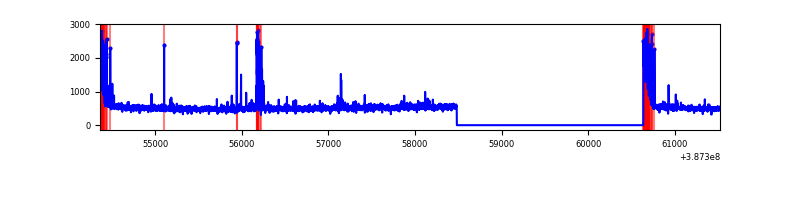 |
| D | 7155 | 5003 | 87 | 87 | 1.22% | 1.74% | 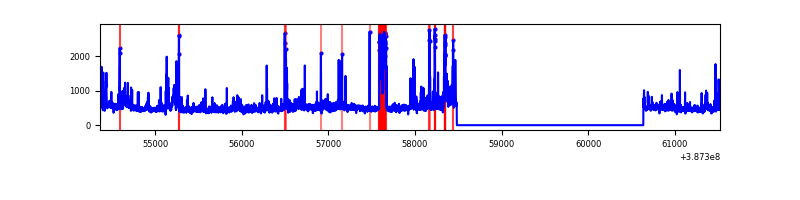 |
Top three noisy pixels from each quadrant. If the there are fewer than three noisy pixels in the level2.evt file, extra rows are filled as -1
| Pixel properties | Quadrant properties | ||||||
|---|---|---|---|---|---|---|---|
| Quadrant | DetID | PixID | Counts | Sigma | Mean | Median | Sigma |
| A | 10 | 83 | 95471 | 775.94 | 610 | 599 | 122.3 |
| A | 8 | 192 | 34771 | 279.49 | 610 | 599 | 122.3 |
| A | 13 | 6 | 12989 | 101.34 | 610 | 599 | 122.3 |
| B | 5 | 236 | 3151274 | 34249.26 | 488 | 478 | 92.0 |
| B | 5 | 172 | 2463291 | 26770.86 | 488 | 478 | 92.0 |
| B | 4 | 232 | 25168 | 268.38 | 488 | 478 | 92.0 |
| C | 0 | 10 | 336861 | 2542.77 | 578 | 582 | 132.2 |
| C | 15 | 214 | 208602 | 1572.94 | 578 | 582 | 132.2 |
| C | 1 | 23 | 15926 | 116.02 | 578 | 582 | 132.2 |
| D | 12 | 233 | 225733 | 1605.93 | 583 | 566 | 140.2 |
| D | 1 | 47 | 116149 | 824.36 | 583 | 566 | 140.2 |
| D | 12 | 235 | 103482 | 734.01 | 583 | 566 | 140.2 |
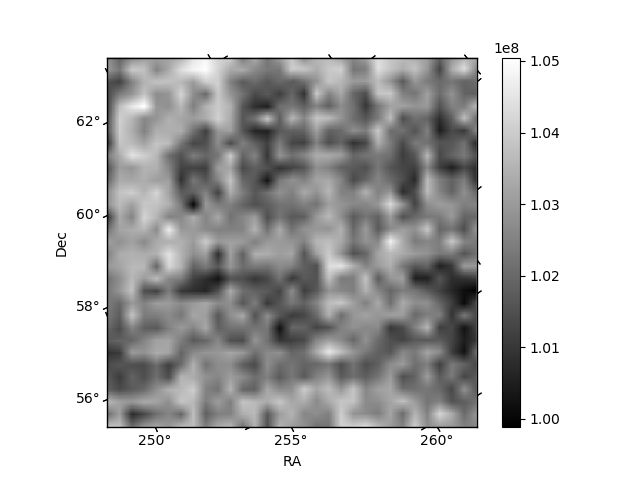
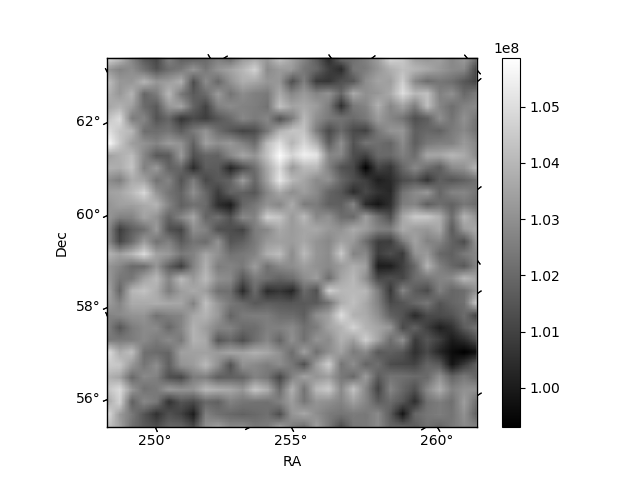
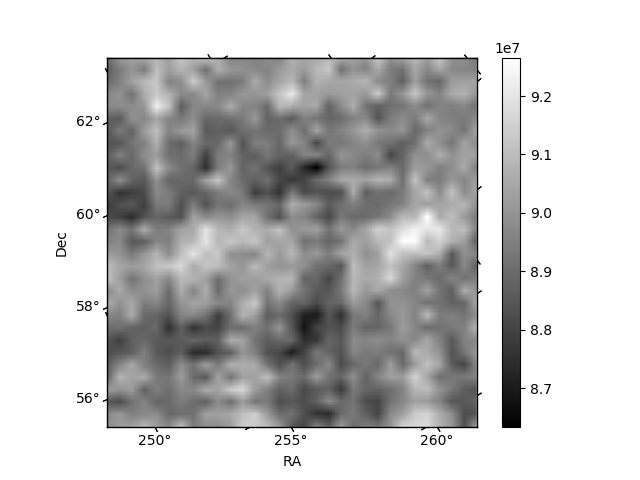
Histogram calculated using DETX and DETY for each event in the final _common_clean file
| Quadrant A | 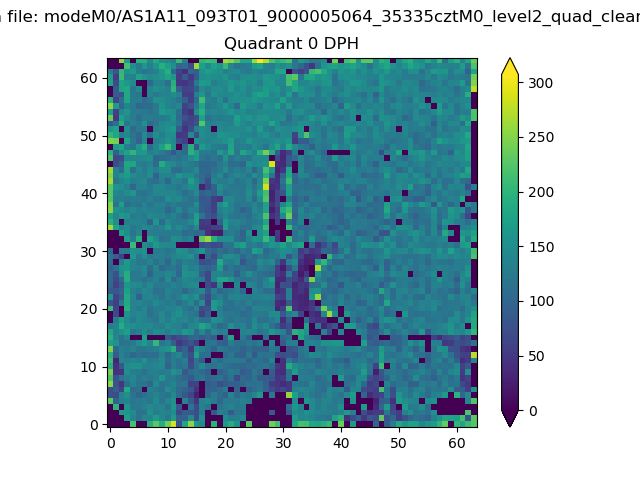 |
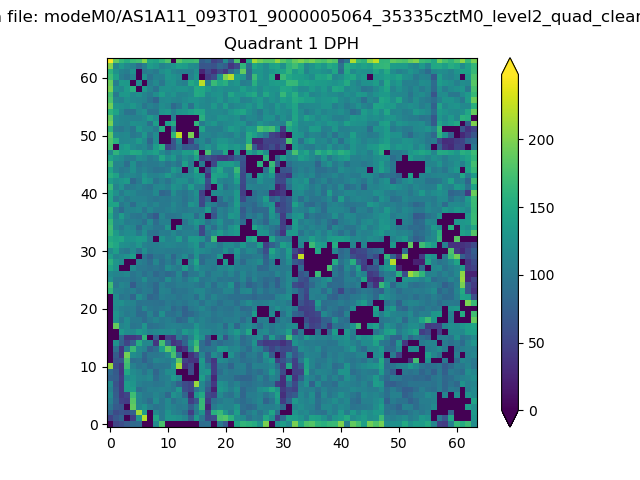 |
Quadrant B |
|---|---|---|---|
| Quadrant D | 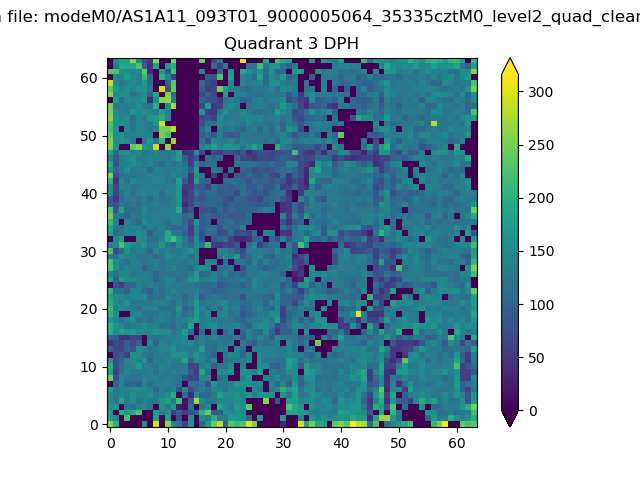 |
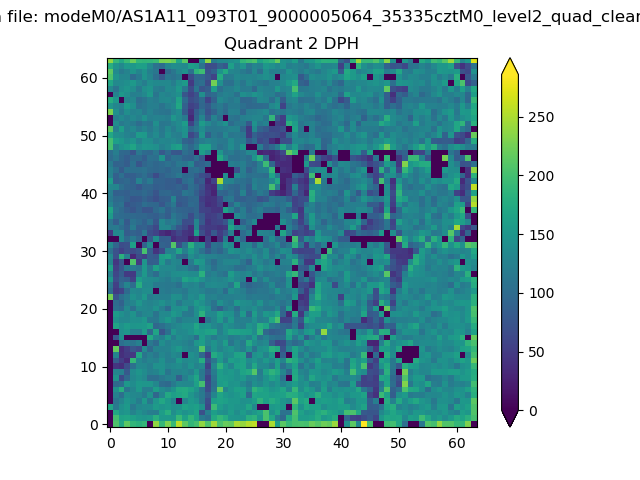 |
Quadrant C |
| Plot type | Count rate plots | Images |
|---|---|---|
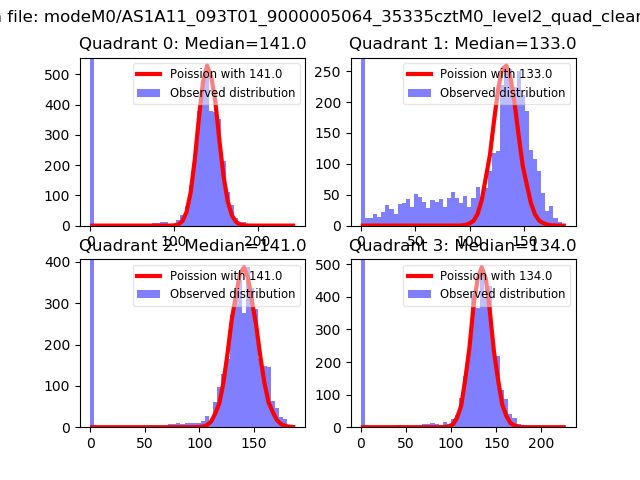
| Comparison with Poisson distribution Blue bars denote a histogram of data divided into 1 sec bins. Red curve is a Poisson curve with rate = median count rate of data. |
 |
 |
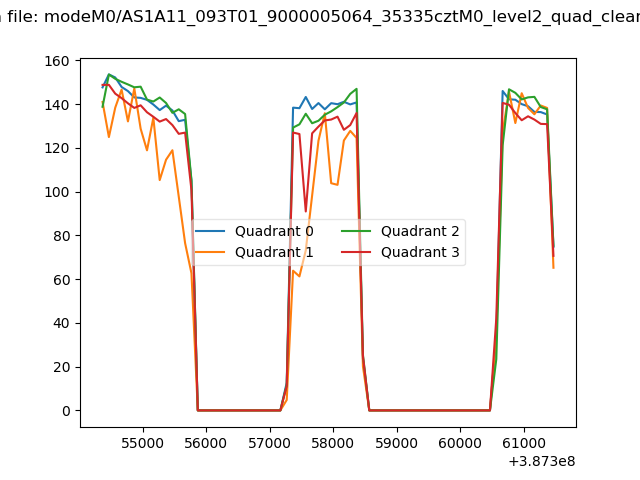
| Quadrant-wise count rates Data is divided into 100 sec bins |
 |
|
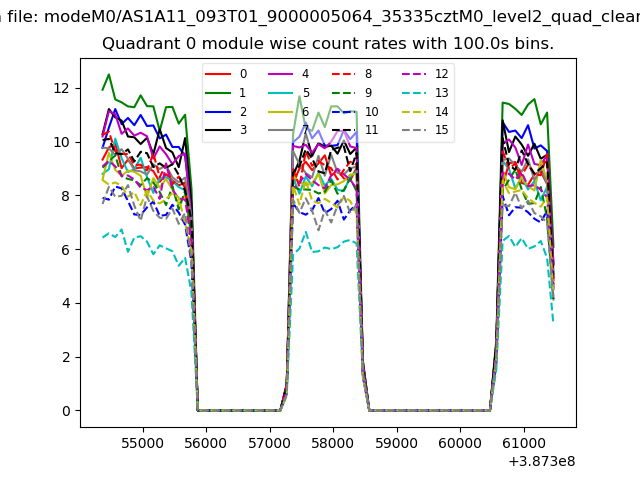
| Module-wise count rates for Quadrant A Data is divided into 100 sec bins |
 |
 |
| Module-wise count rates for Quadrant B Data is divided into 100 sec bins |
 |
 |
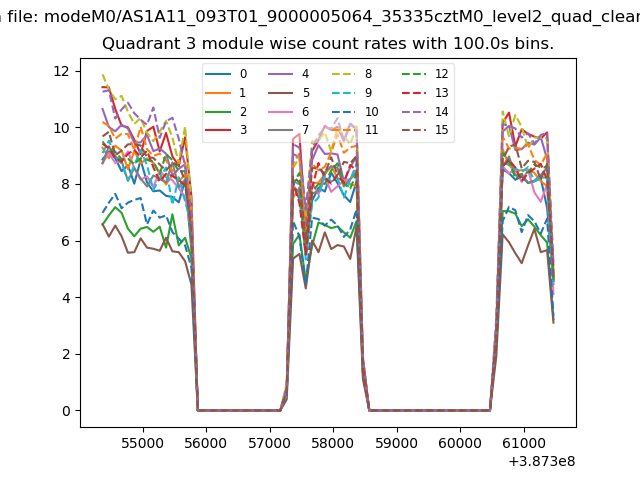
| Module-wise count rates for Quadrant C Data is divided into 100 sec bins |
 |
 |
| Module-wise count rates for Quadrant D Data is divided into 100 sec bins |
 |
 |
| Parameter | Plot |
|---|---|
| CZT HV Monitor |  |
| D_VDD | 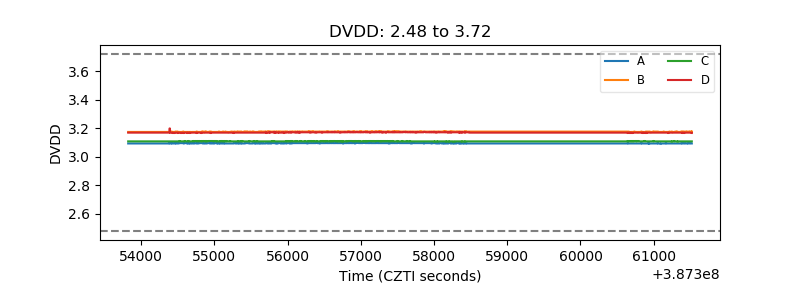 |
| Temperature 1 | 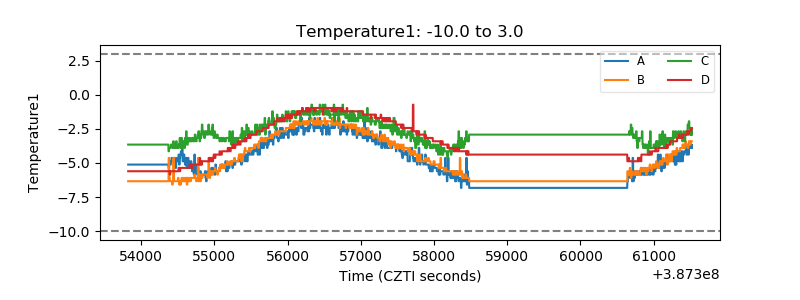 |
| Veto HV Monitor | 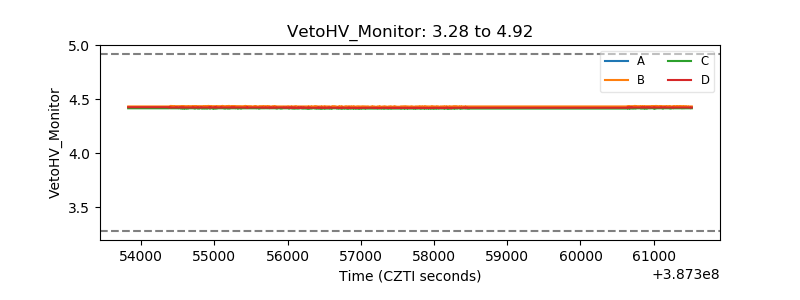 |
| Veto LLD | 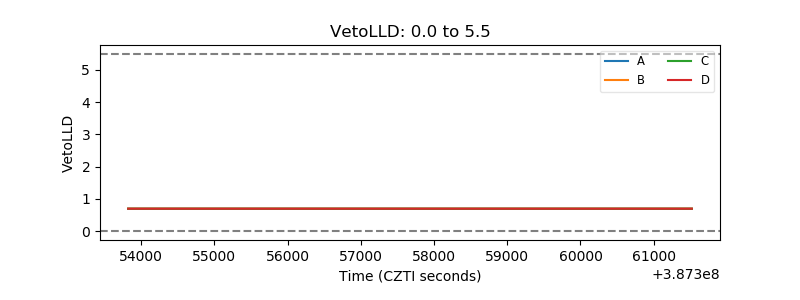 |
| Alpha Counter | 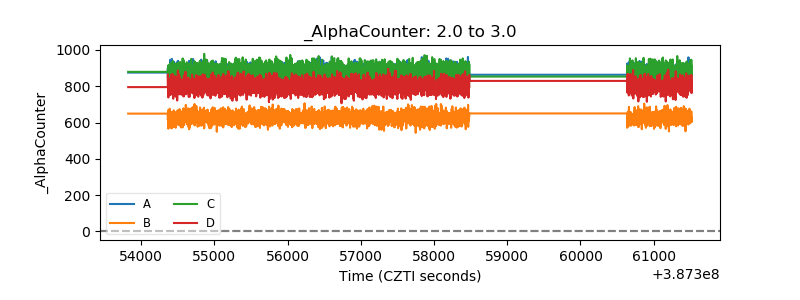 |
| _CPM_Rate | 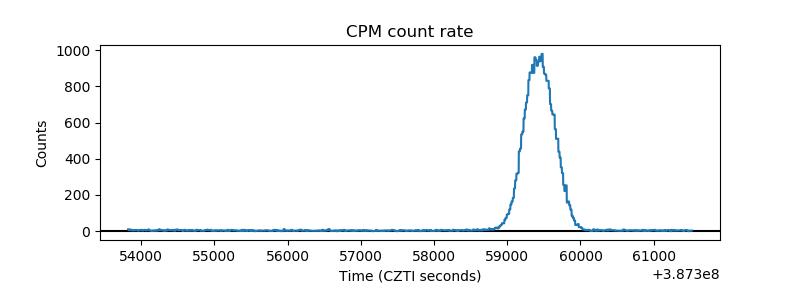 |
| CZT Counter | 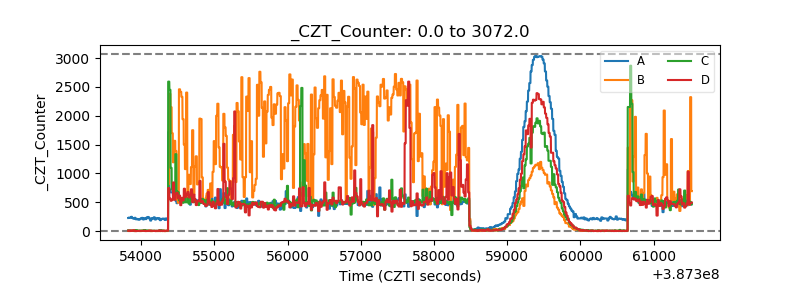 |
| +2.5 Volts monitor |  |
| +5 Volts monitor |  |
| _ROLL_ROT | 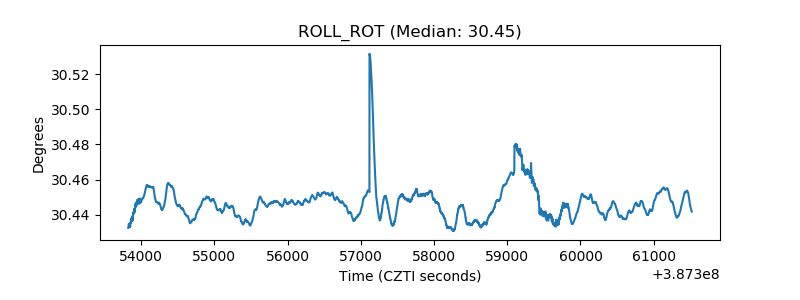 |
| _Roll_DEC | 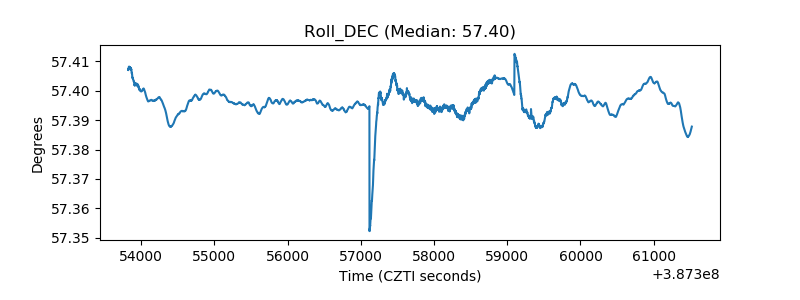 |
| _Roll_RA | 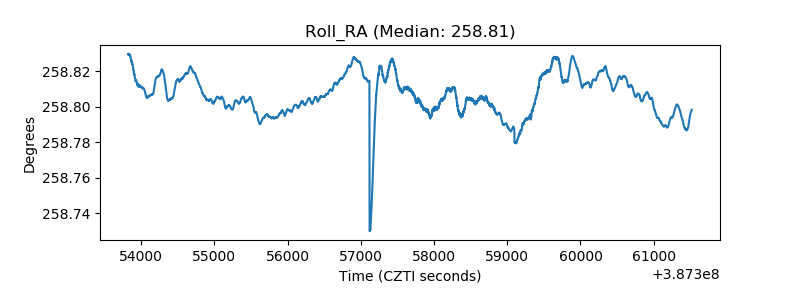 |
| Veto Counter | 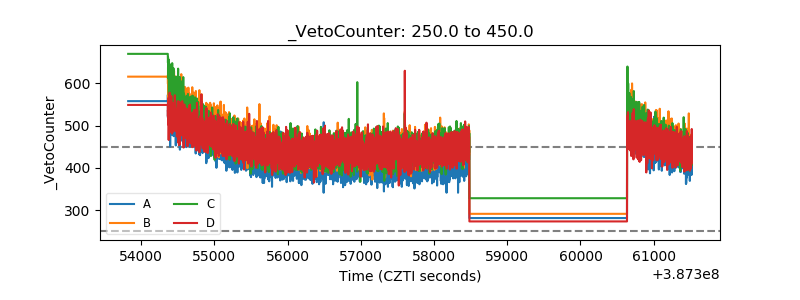 |