| Param | Original file | Final file |
|---|---|---|
| Filename | modeM0/AS1A11_037T01_9000005066cztM0_level2.fits | modeM0/AS1A11_037T01_9000005066cztM0_level2_quad_clean.evt |
| Size (bytes) | 109,085,760 | 104,310,720 |
| Size | 104.0 MB | 99.5 MB |
| Events in quadrant A | 666,848 | 637,099 |
| Events in quadrant B | 628,784 | 620,718 |
| Events in quadrant C | 636,058 | 575,585 |
| Events in quadrant D | 524,870 | 478,230 |
| Mode M0 | |||
|---|---|---|---|
| Quadrant | BADHDUFLAG | Total packets | Discarded packets |
| A | 0 | 25088 | 0 |
| B | 0 | 29712 | 0 |
| C | 0 | 30568 | 0 |
| D | 0 | 43627 | 0 |
| Mode M9 | |||
|---|---|---|---|
| Quadrant | BADHDUFLAG | Total packets | Discarded packets |
| A | 0 | 40 | 0 |
| B | 0 | 40 | 0 |
| C | 0 | 40 | 0 |
| D | 0 | 40 | 0 |
| Mode SS | |||
|---|---|---|---|
| Quadrant | BADHDUFLAG | Total packets | Discarded packets |
| A | 0 | 250 | 0 |
| B | 0 | 250 | 0 |
| C | 0 | 250 | 0 |
| D | 0 | 250 | 0 |
| Quadrant | Total seconds | Saturated seconds | Saturation percentage |
|---|---|---|---|
| A | 12239 | 18 | 0.147071% |
| B | 12239 | 297 | 2.426669% |
| C | 12239 | 352 | 2.876052% |
| D | 12239 | 1443 | 11.790179% |
Noise dominated data is calculated using 1-second bins in cleaned event files. If a bin has >2000 counts, and if more than 50% of those come from <1% of pixels, then it is considered to be noise-dominated and hence unusable.
| Quadrant | # 1 sec bins | Bins with >0 counts | Bins with >2000 counts | High rate bins dominated by noise | Noise dominated (total time) | Noise dominated (detector-on time) | Marked lightcurve |
|---|---|---|---|---|---|---|---|
| A | 16295 | 12238 | 0 | 0 | 0.00% | 0.00% |  |
| B | 16295 | 12238 | 0 | 0 | 0.00% | 0.00% |  |
| C | 16295 | 12231 | 0 | 0 | 0.00% | 0.00% |  |
| D | 16294 | 12206 | 0 | 0 | 0.00% | 0.00% |  |
Top three noisy pixels from each quadrant. If the there are fewer than three noisy pixels in the level2.evt file, extra rows are filled as -1
| Pixel properties | Quadrant properties | ||||||
|---|---|---|---|---|---|---|---|
| Quadrant | DetID | PixID | Counts | Sigma | Mean | Median | Sigma |
| A | 9 | 19 | 575 | 9.18 | 174 | 163 | 44.9 |
| A | 7 | 110 | 569 | 9.05 | 174 | 163 | 44.9 |
| A | 0 | 29 | 529 | 8.16 | 174 | 163 | 44.9 |
| B | 2 | 9 | 532 | 10.66 | 166 | 158 | 35.1 |
| B | 3 | 80 | 501 | 9.78 | 166 | 158 | 35.1 |
| B | 2 | 8 | 469 | 8.87 | 166 | 158 | 35.1 |
| C | 3 | 203 | 525 | 8.07 | 168 | 157 | 45.6 |
| C | 3 | 202 | 495 | 7.41 | 168 | 157 | 45.6 |
| C | 3 | 187 | 452 | 6.47 | 168 | 157 | 45.6 |
| D | 4 | 160 | 408 | 6.53 | 149 | 136 | 41.7 |
| D | 7 | 3 | 398 | 6.29 | 149 | 136 | 41.7 |
| D | 1 | 3 | 389 | 6.07 | 149 | 136 | 41.7 |
Histogram calculated using DETX and DETY for each event in the final _common_clean file
| Quadrant A | 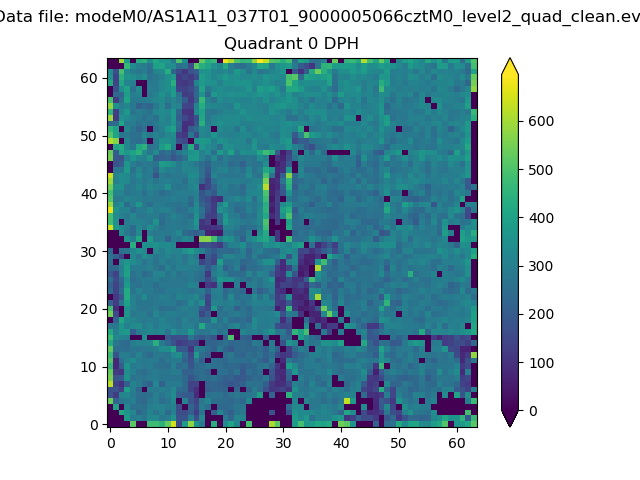 |
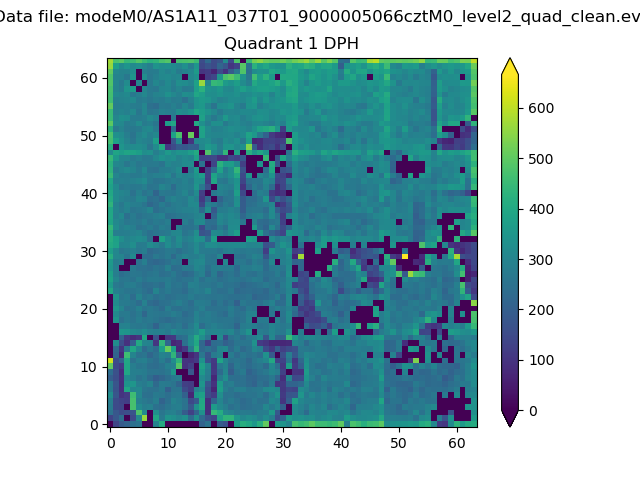 |
Quadrant B |
|---|---|---|---|
| Quadrant D |  |
 |
Quadrant C |
| Plot type | Count rate plots | Images |
|---|---|---|
| Comparison with Poisson distribution Blue bars denote a histogram of data divided into 1 sec bins. Red curve is a Poisson curve with rate = median count rate of data. |
 |
 |
| Quadrant-wise count rates Data is divided into 100 sec bins |
 |
|
| Module-wise count rates for Quadrant A Data is divided into 100 sec bins |
 |
 |
| Module-wise count rates for Quadrant B Data is divided into 100 sec bins |
 |
 |
| Module-wise count rates for Quadrant C Data is divided into 100 sec bins |
 |
 |
| Module-wise count rates for Quadrant D Data is divided into 100 sec bins |
 |
 |
| Parameter | Plot |
|---|---|
| CZT HV Monitor |  |
| D_VDD |  |
| Temperature 1 |  |
| Veto HV Monitor |  |
| Veto LLD |  |
| Alpha Counter |  |
| _CPM_Rate |  |
| CZT Counter |  |
| +2.5 Volts monitor |  |
| +5 Volts monitor |  |
| _ROLL_ROT |  |
| _Roll_DEC | 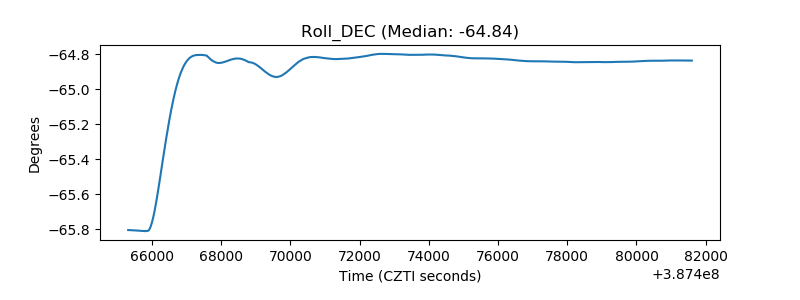 |
| _Roll_RA |  |
| Veto Counter |  |