| Param | Original file | Final file |
|---|---|---|
| Filename | modeM0/AS1A11_099T01_9000005068cztM0_level2.fits | modeM0/AS1A11_099T01_9000005068cztM0_level2_quad_clean.evt |
| Size (bytes) | 1,583,478,720 | 1,441,791,360 |
| Size | 1.5 GB | 1.3 GB |
| Events in quadrant A | 10,597,382 | 10,415,411 |
| Events in quadrant B | 6,787,964 | 4,013,518 |
| Events in quadrant C | 10,141,560 | 9,749,240 |
| Events in quadrant D | 8,042,548 | 7,157,962 |
| Mode M9 | |||
|---|---|---|---|
| Quadrant | BADHDUFLAG | Total packets | Discarded packets |
| A | 0 | 685 | 0 |
| B | 0 | 686 | 0 |
| C | 0 | 686 | 0 |
| D | 0 | 686 | 0 |
| Mode M0 | |||
|---|---|---|---|
| Quadrant | BADHDUFLAG | Total packets | Discarded packets |
| A | 0 | 397570 | 0 |
| B | 0 | 1056240 | 0 |
| C | 0 | 429042 | 0 |
| D | 0 | 703140 | 0 |
| Mode SS | |||
|---|---|---|---|
| Quadrant | BADHDUFLAG | Total packets | Discarded packets |
| A | 0 | 3670 | 0 |
| B | 0 | 3670 | 0 |
| C | 0 | 3670 | 0 |
| D | 0 | 3670 | 0 |
| Quadrant | Total seconds | Saturated seconds | Saturation percentage |
|---|---|---|---|
| A | 179855 | 3462 | 1.924884% |
| B | 179851 | 100307 | 55.772278% |
| C | 179853 | 4904 | 2.726671% |
| D | 179855 | 30917 | 17.189959% |
Noise dominated data is calculated using 1-second bins in cleaned event files. If a bin has >2000 counts, and if more than 50% of those come from <1% of pixels, then it is considered to be noise-dominated and hence unusable.
| Quadrant | # 1 sec bins | Bins with >0 counts | Bins with >2000 counts | High rate bins dominated by noise | Noise dominated (total time) | Noise dominated (detector-on time) | Marked lightcurve |
|---|---|---|---|---|---|---|---|
| A | 256134 | 179591 | 0 | 0 | 0.00% | 0.00% | 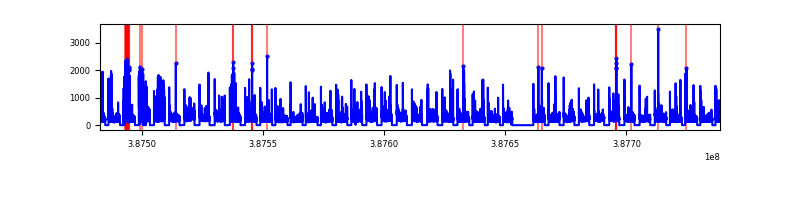 |
| B | 256133 | 178243 | 0 | 0 | 0.00% | 0.00% |  |
| C | 256134 | 179796 | 0 | 0 | 0.00% | 0.00% |  |
| D | 256133 | 179007 | 0 | 0 | 0.00% | 0.00% |  |
Top three noisy pixels from each quadrant. If the there are fewer than three noisy pixels in the level2.evt file, extra rows are filled as -1
| Pixel properties | Quadrant properties | ||||||
|---|---|---|---|---|---|---|---|
| Quadrant | DetID | PixID | Counts | Sigma | Mean | Median | Sigma |
| A | 0 | 29 | 8671 | 9.03 | 2770 | 2604 | 672.1 |
| A | 9 | 19 | 8639 | 8.98 | 2770 | 2604 | 672.1 |
| A | 7 | 110 | 8553 | 8.85 | 2770 | 2604 | 672.1 |
| B | 2 | 9 | 5902 | 12.17 | 1798 | 1720 | 343.5 |
| B | 3 | 80 | 5208 | 10.15 | 1798 | 1720 | 343.5 |
| B | 2 | 8 | 4781 | 8.91 | 1798 | 1720 | 343.5 |
| C | 1 | 81 | 8485 | 8.73 | 2686 | 2520 | 683.6 |
| C | 1 | 80 | 8301 | 8.46 | 2686 | 2520 | 683.6 |
| C | 3 | 203 | 8144 | 8.23 | 2686 | 2520 | 683.6 |
| D | 7 | 3 | 6016 | 6.46 | 2307 | 2105 | 605.5 |
| D | 10 | 113 | 5794 | 6.09 | 2307 | 2105 | 605.5 |
| D | 4 | 160 | 5765 | 6.04 | 2307 | 2105 | 605.5 |
Histogram calculated using DETX and DETY for each event in the final _common_clean file
| Quadrant A |  |
 |
Quadrant B |
|---|---|---|---|
| Quadrant D |  |
 |
Quadrant C |
| Plot type | Count rate plots | Images |
|---|---|---|
| Comparison with Poisson distribution Blue bars denote a histogram of data divided into 1 sec bins. Red curve is a Poisson curve with rate = median count rate of data. |
 |
 |
| Quadrant-wise count rates Data is divided into 100 sec bins |
 |
|
| Module-wise count rates for Quadrant A Data is divided into 100 sec bins |
 |
 |
| Module-wise count rates for Quadrant B Data is divided into 100 sec bins |
 |
 |
| Module-wise count rates for Quadrant C Data is divided into 100 sec bins |
 |
 |
| Module-wise count rates for Quadrant D Data is divided into 100 sec bins |
 |
 |
| Parameter | Plot |
|---|---|
| CZT HV Monitor |  |
| D_VDD |  |
| Temperature 1 |  |
| Veto HV Monitor |  |
| Veto LLD |  |
| Alpha Counter |  |
| _CPM_Rate |  |
| CZT Counter |  |
| +2.5 Volts monitor |  |
| +5 Volts monitor |  |
| _ROLL_ROT |  |
| _Roll_DEC |  |
| _Roll_RA |  |
| Veto Counter |  |