| Param | Original file | Final file |
|---|---|---|
| Filename | modeM0/AS1A11_099T01_9000005068_35365cztM0_level2.evt | modeM0/AS1A11_099T01_9000005068_35365cztM0_level2_quad_clean.evt |
| Size (bytes) | 665,375,040 | 64,972,800 |
| Size | 634.6 MB | 62.0 MB |
| Events in quadrant A | 2,666,719 | 477,161 |
| Events in quadrant B | 10,289,639 | 235,214 |
| Events in quadrant C | 2,911,901 | 468,481 |
| Events in quadrant D | 3,945,916 | 436,348 |
| Mode M9 | |||
|---|---|---|---|
| Quadrant | BADHDUFLAG | Total packets | Discarded packets |
| A | 0 | 32 | 0 |
| B | 0 | 32 | 0 |
| C | 0 | 32 | 0 |
| D | 0 | 33 | 0 |
| Mode M0 | |||
|---|---|---|---|
| Quadrant | BADHDUFLAG | Total packets | Discarded packets |
| A | 0 | 10690 | 3 |
| B | 0 | 33871 | 2 |
| C | 0 | 11336 | 2 |
| D | 0 | 15564 | 2 |
| Mode SS | |||
|---|---|---|---|
| Quadrant | BADHDUFLAG | Total packets | Discarded packets |
| A | 0 | 102 | 0 |
| B | 0 | 102 | 0 |
| C | 0 | 102 | 0 |
| D | 0 | 102 | 0 |
| Quadrant | Total seconds | Saturated seconds | Saturation percentage |
|---|---|---|---|
| A | 4973 | 10 | 0.201086% |
| B | 4973 | 3631 | 73.014277% |
| C | 4973 | 137 | 2.754876% |
| D | 4973 | 92 | 1.849990% |
Noise dominated data is calculated using 1-second bins in cleaned event files. If a bin has >2000 counts, and if more than 50% of those come from <1% of pixels, then it is considered to be noise-dominated and hence unusable.
| Quadrant | # 1 sec bins | Bins with >0 counts | Bins with >2000 counts | High rate bins dominated by noise | Noise dominated (total time) | Noise dominated (detector-on time) | Marked lightcurve |
|---|---|---|---|---|---|---|---|
| A | 7097 | 4974 | 2 | 2 | 0.03% | 0.04% | 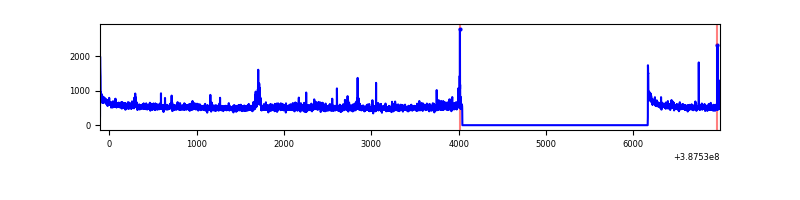 |
| B | 7097 | 4974 | 3161 | 3161 | 44.54% | 63.55% | 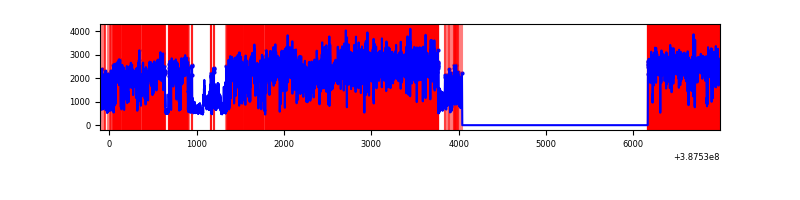 |
| C | 7097 | 4974 | 109 | 109 | 1.54% | 2.19% | 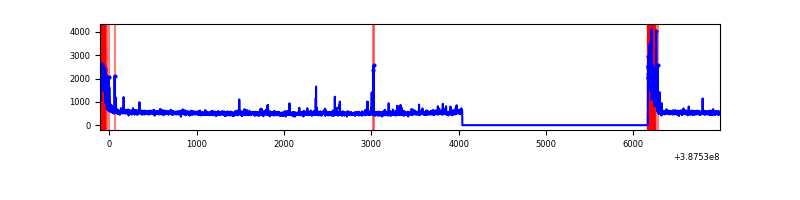 |
| D | 7097 | 4974 | 80 | 80 | 1.13% | 1.61% | 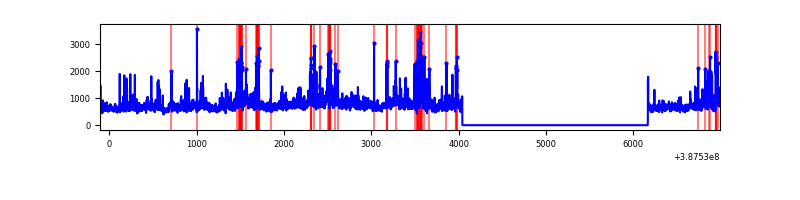 |
Top three noisy pixels from each quadrant. If the there are fewer than three noisy pixels in the level2.evt file, extra rows are filled as -1
| Pixel properties | Quadrant properties | ||||||
|---|---|---|---|---|---|---|---|
| Quadrant | DetID | PixID | Counts | Sigma | Mean | Median | Sigma |
| A | 10 | 83 | 113505 | 896.34 | 625 | 614 | 125.9 |
| A | 15 | 169 | 63554 | 499.73 | 625 | 614 | 125.9 |
| A | 14 | 239 | 25456 | 197.24 | 625 | 614 | 125.9 |
| B | 4 | 251 | 8666972 | 127950.56 | 351 | 343 | 67.7 |
| B | 5 | 172 | 102931 | 1514.57 | 351 | 343 | 67.7 |
| B | 4 | 81 | 54898 | 805.43 | 351 | 343 | 67.7 |
| C | 0 | 10 | 367531 | 2663.42 | 591 | 597 | 137.8 |
| C | 15 | 214 | 208328 | 1507.83 | 591 | 597 | 137.8 |
| C | 0 | 207 | 17197 | 120.49 | 591 | 597 | 137.8 |
| D | 8 | 195 | 844787 | 5712.4 | 598 | 581 | 147.8 |
| D | 7 | 80 | 210925 | 1423.31 | 598 | 581 | 147.8 |
| D | 2 | 152 | 100629 | 676.98 | 598 | 581 | 147.8 |
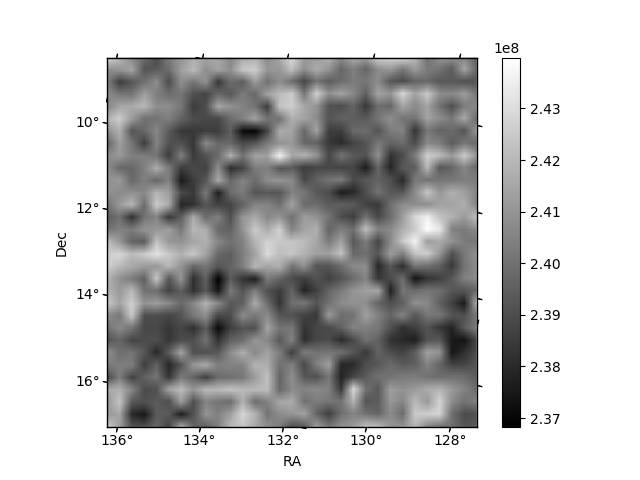
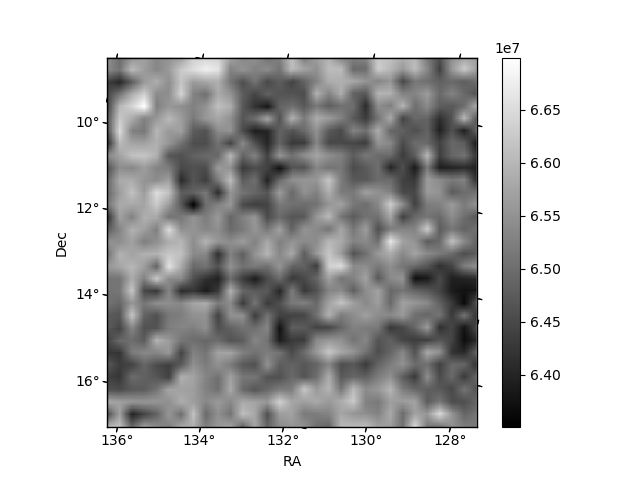
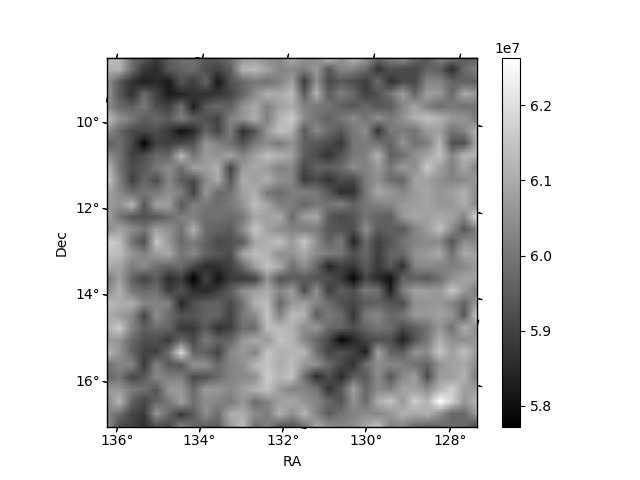
Histogram calculated using DETX and DETY for each event in the final _common_clean file
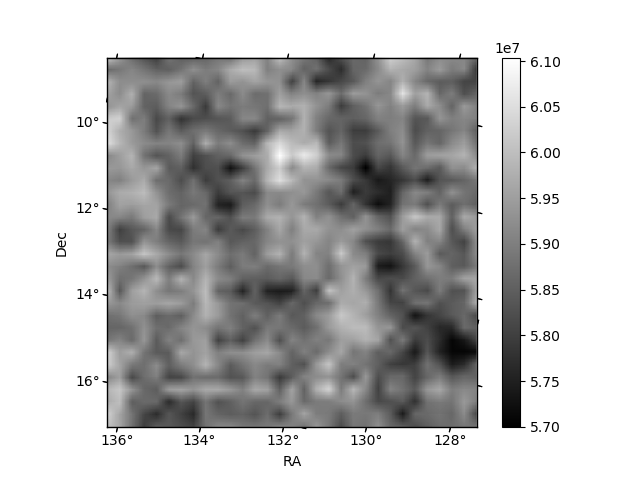
| Quadrant A | 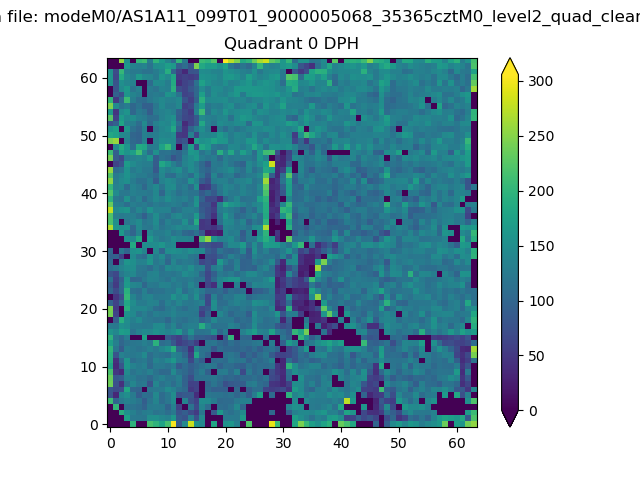 |
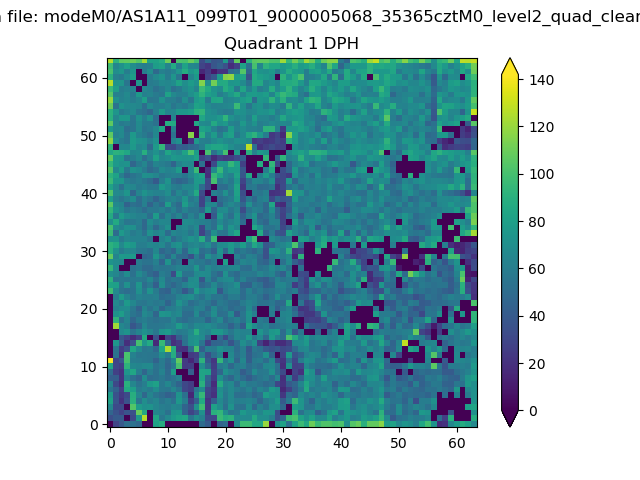 |
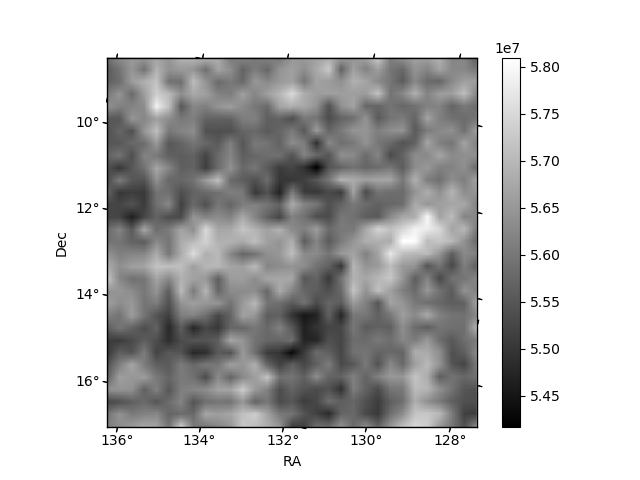
Quadrant B |
|---|---|---|---|
| Quadrant D | 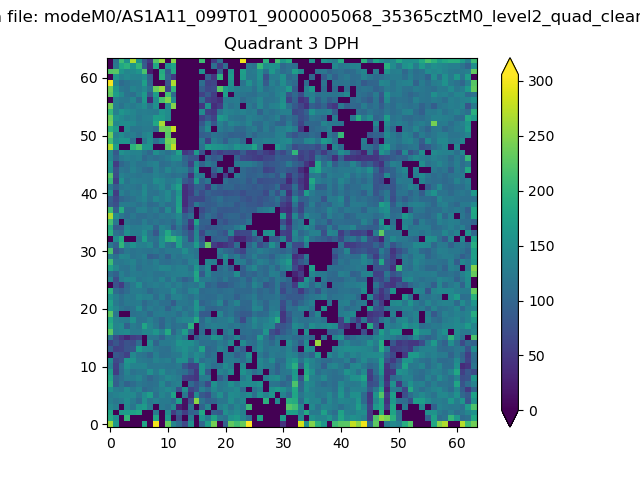 |
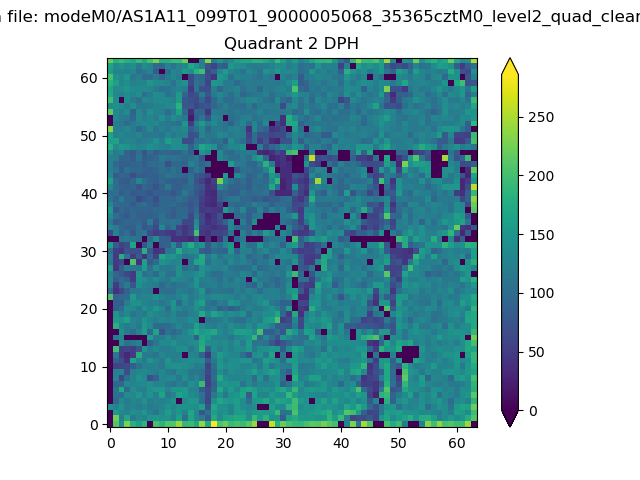 |
Quadrant C |
| Plot type | Count rate plots | Images |
|---|---|---|
| Comparison with Poisson distribution Blue bars denote a histogram of data divided into 1 sec bins. Red curve is a Poisson curve with rate = median count rate of data. |
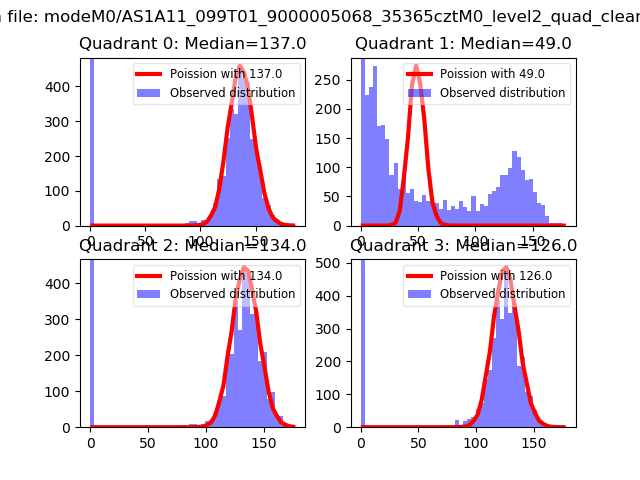 |
 |
| Quadrant-wise count rates Data is divided into 100 sec bins |
 |
|
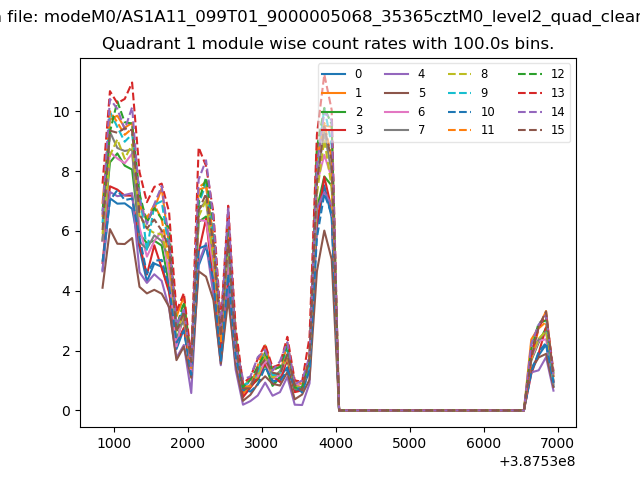
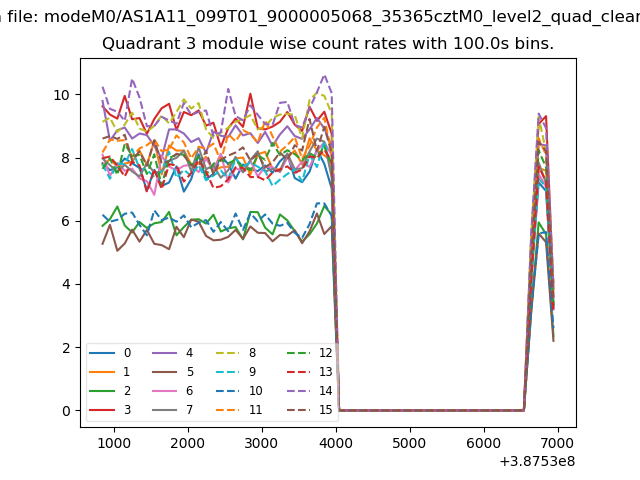
| Module-wise count rates for Quadrant A Data is divided into 100 sec bins |
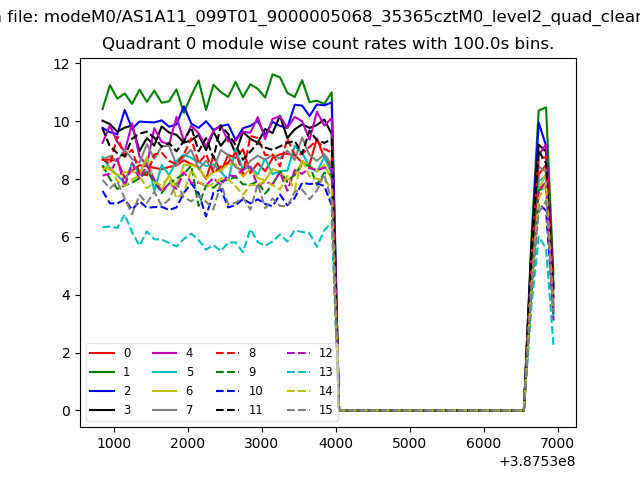 |
 |
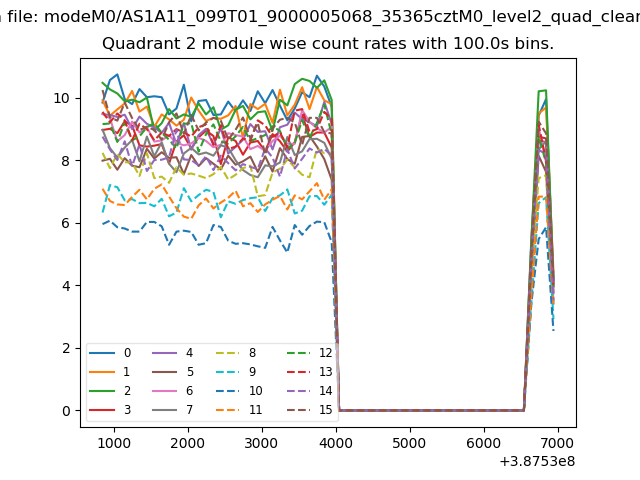
| Module-wise count rates for Quadrant B Data is divided into 100 sec bins |
 |
 |
| Module-wise count rates for Quadrant C Data is divided into 100 sec bins |
 |
 |
| Module-wise count rates for Quadrant D Data is divided into 100 sec bins |
 |
 |
| Parameter | Plot |
|---|---|
| CZT HV Monitor |  |
| D_VDD | 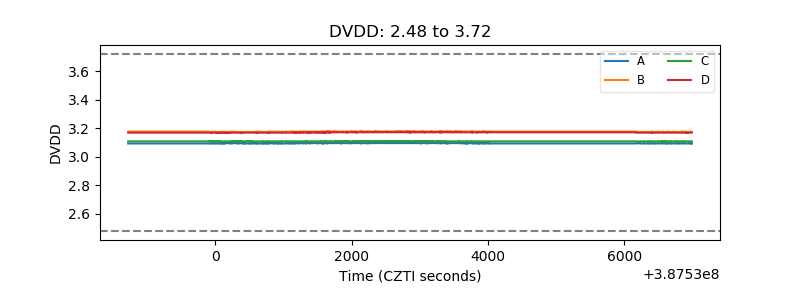 |
| Temperature 1 | 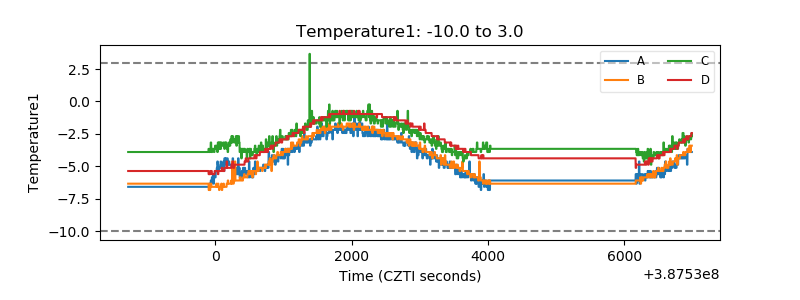 |
| Veto HV Monitor | 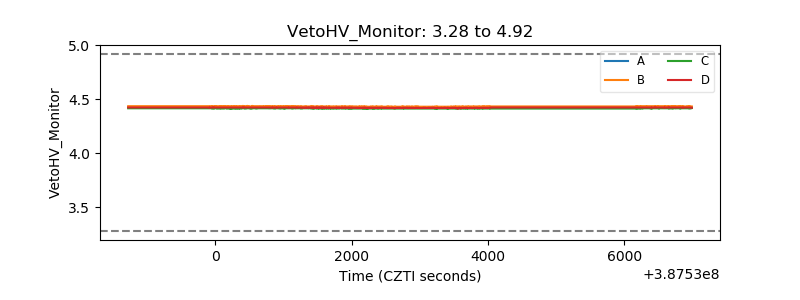 |
| Veto LLD | 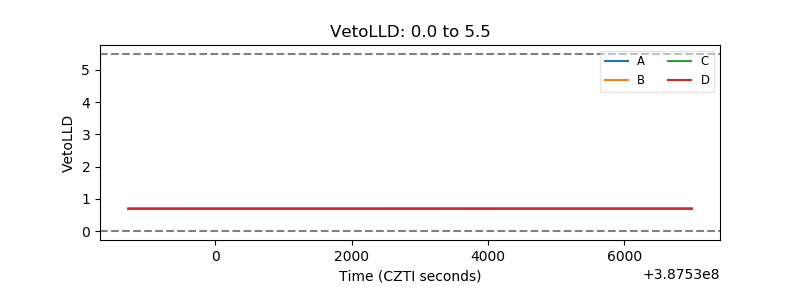 |
| Alpha Counter | 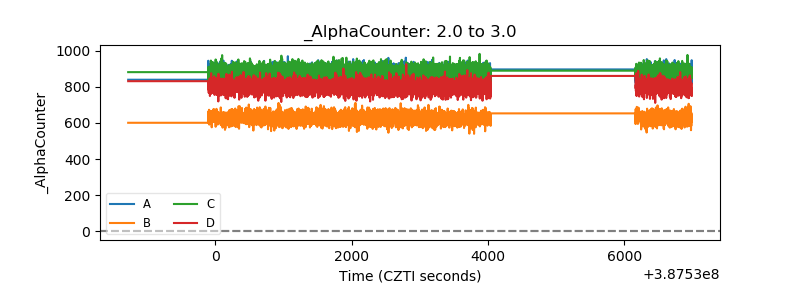 |
| _CPM_Rate | 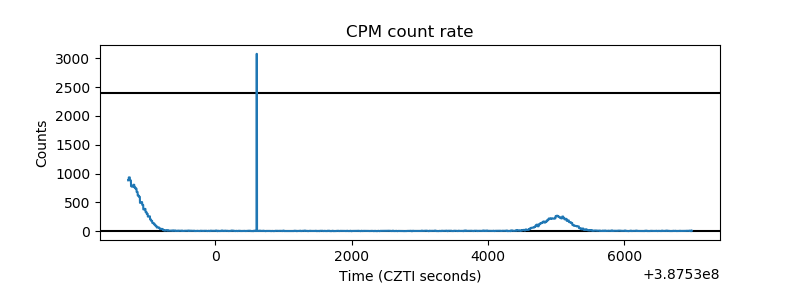 |
| CZT Counter | 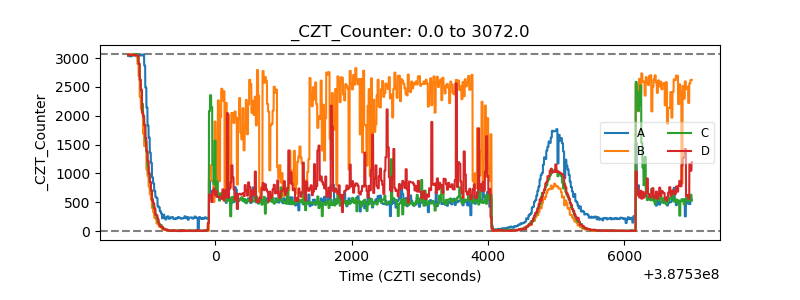 |
| +2.5 Volts monitor | 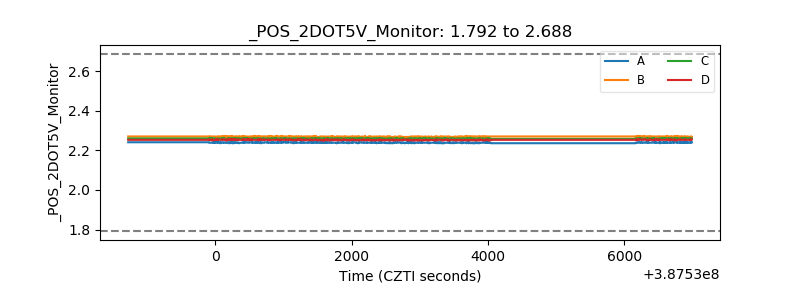 |
| +5 Volts monitor |  |
| _ROLL_ROT | 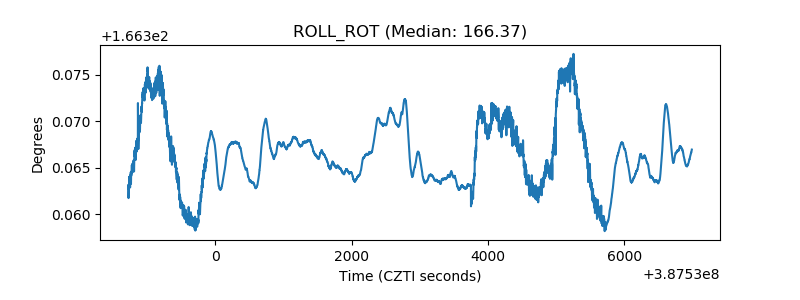 |
| _Roll_DEC | 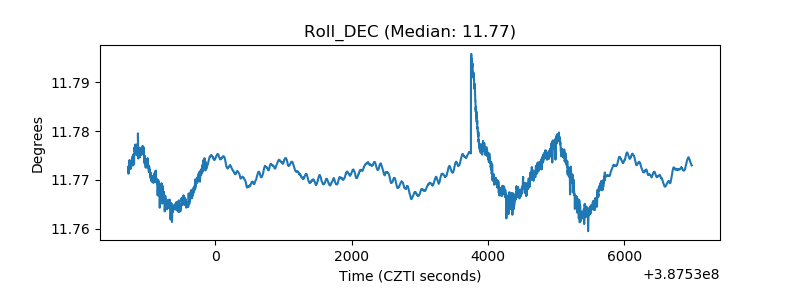 |
| _Roll_RA | 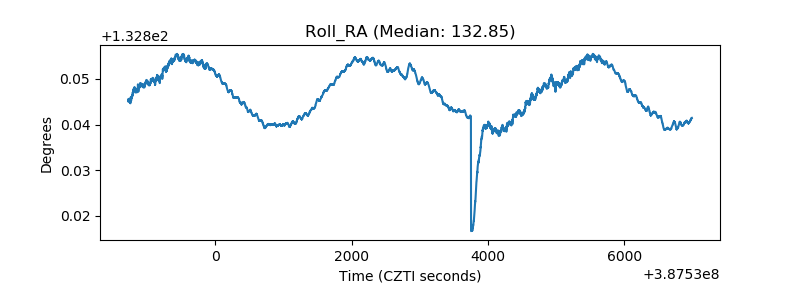 |
| Veto Counter | 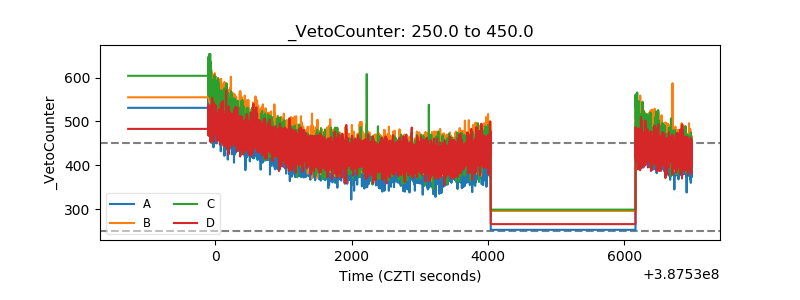 |