| Param | Original file | Final file |
|---|---|---|
| Filename | modeM0/AS1A11_099T01_9000005068_35369cztM0_level2.evt | modeM0/AS1A11_099T01_9000005068_35369cztM0_level2_quad_clean.evt |
| Size (bytes) | 793,679,040 | 66,542,400 |
| Size | 756.9 MB | 63.5 MB |
| Events in quadrant A | 2,845,193 | 470,061 |
| Events in quadrant B | 11,843,042 | 254,050 |
| Events in quadrant C | 3,385,695 | 454,714 |
| Events in quadrant D | 5,559,962 | 417,921 |
| Mode M9 | |||
|---|---|---|---|
| Quadrant | BADHDUFLAG | Total packets | Discarded packets |
| A | 0 | 15 | 0 |
| B | 0 | 15 | 0 |
| C | 0 | 15 | 0 |
| D | 0 | 16 | 0 |
| Mode M0 | |||
|---|---|---|---|
| Quadrant | BADHDUFLAG | Total packets | Discarded packets |
| A | 0 | 12314 | 3 |
| B | 0 | 39279 | 8 |
| C | 0 | 13640 | 2 |
| D | 0 | 20511 | 2 |
| Mode SS | |||
|---|---|---|---|
| Quadrant | BADHDUFLAG | Total packets | Discarded packets |
| A | 0 | 122 | 0 |
| B | 0 | 122 | 0 |
| C | 0 | 122 | 0 |
| D | 0 | 122 | 0 |
| Quadrant | Total seconds | Saturated seconds | Saturation percentage |
|---|---|---|---|
| A | 5960 | 6 | 0.100671% |
| B | 5959 | 4024 | 67.528109% |
| C | 5960 | 111 | 1.862416% |
| D | 5960 | 492 | 8.255034% |
Noise dominated data is calculated using 1-second bins in cleaned event files. If a bin has >2000 counts, and if more than 50% of those come from <1% of pixels, then it is considered to be noise-dominated and hence unusable.
| Quadrant | # 1 sec bins | Bins with >0 counts | Bins with >2000 counts | High rate bins dominated by noise | Noise dominated (total time) | Noise dominated (detector-on time) | Marked lightcurve |
|---|---|---|---|---|---|---|---|
| A | 7273 | 5961 | 0 | 0 | 0.00% | 0.00% |  |
| B | 7273 | 5961 | 3458 | 3458 | 47.55% | 58.01% | 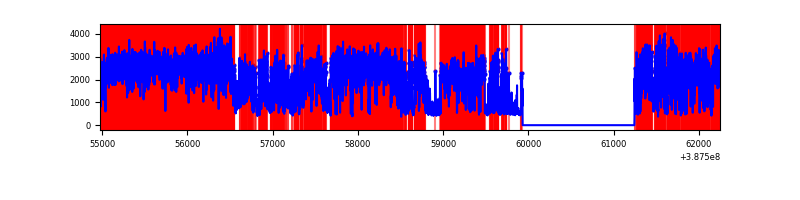 |
| C | 7273 | 5961 | 80 | 80 | 1.10% | 1.34% |  |
| D | 7273 | 5961 | 524 | 524 | 7.20% | 8.79% | 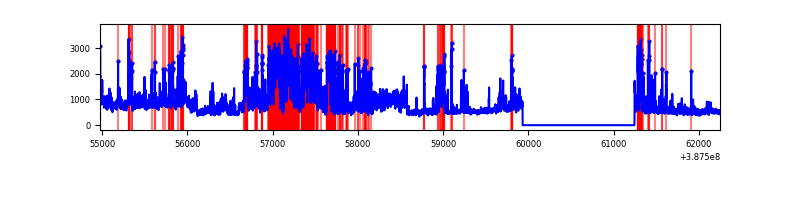 |
Top three noisy pixels from each quadrant. If the there are fewer than three noisy pixels in the level2.evt file, extra rows are filled as -1
| Pixel properties | Quadrant properties | ||||||
|---|---|---|---|---|---|---|---|
| Quadrant | DetID | PixID | Counts | Sigma | Mean | Median | Sigma |
| A | 10 | 83 | 128710 | 912.63 | 692 | 678 | 140.3 |
| A | 13 | 6 | 19985 | 137.62 | 692 | 678 | 140.3 |
| A | 13 | 254 | 10846 | 72.48 | 692 | 678 | 140.3 |
| B | 4 | 251 | 9672174 | 115091.07 | 432 | 422 | 84.0 |
| B | 5 | 172 | 178255 | 2116.16 | 432 | 422 | 84.0 |
| B | 5 | 236 | 129304 | 1533.66 | 432 | 422 | 84.0 |
| C | 0 | 10 | 399020 | 2565.77 | 667 | 672 | 155.3 |
| C | 15 | 214 | 244360 | 1569.6 | 667 | 672 | 155.3 |
| C | 3 | 233 | 80717 | 515.57 | 667 | 672 | 155.3 |
| D | 8 | 195 | 921235 | 5677.43 | 656 | 637 | 162.2 |
| D | 1 | 52 | 443005 | 2728.13 | 656 | 637 | 162.2 |
| D | 13 | 249 | 347118 | 2136.79 | 656 | 637 | 162.2 |
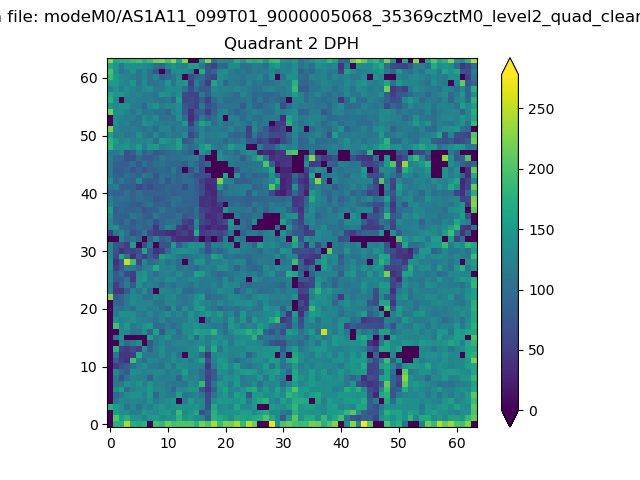
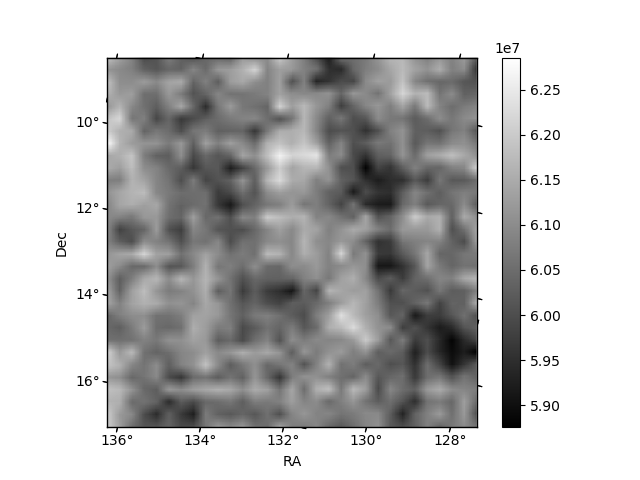
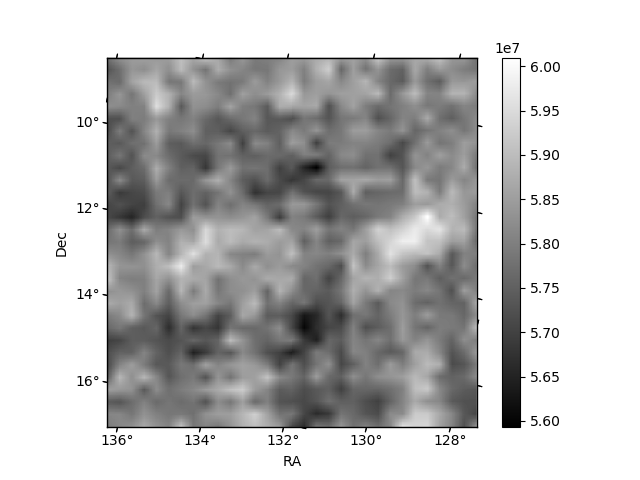
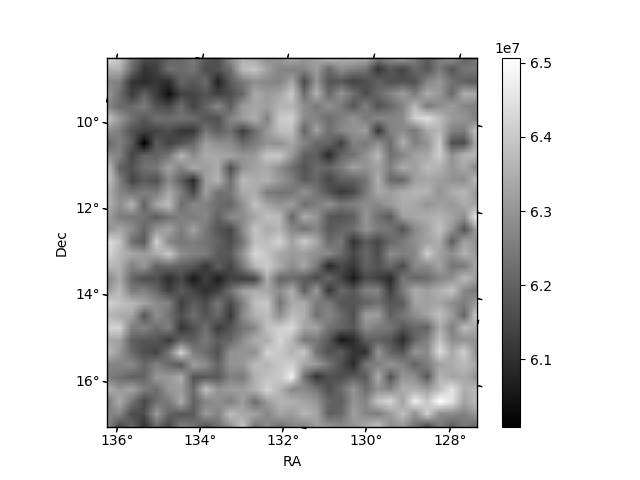
Histogram calculated using DETX and DETY for each event in the final _common_clean file
| Quadrant A | 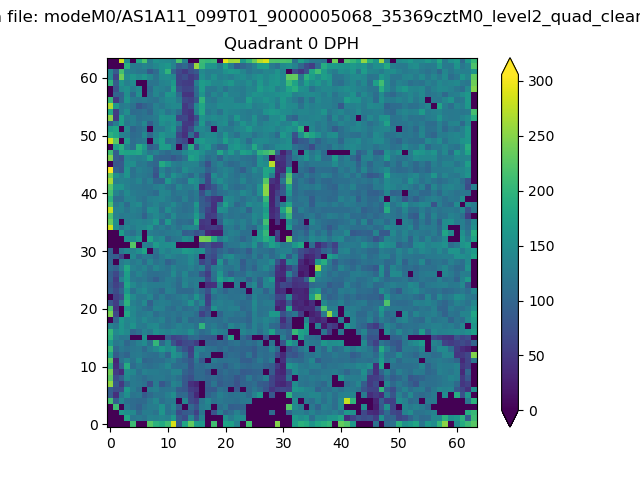 |
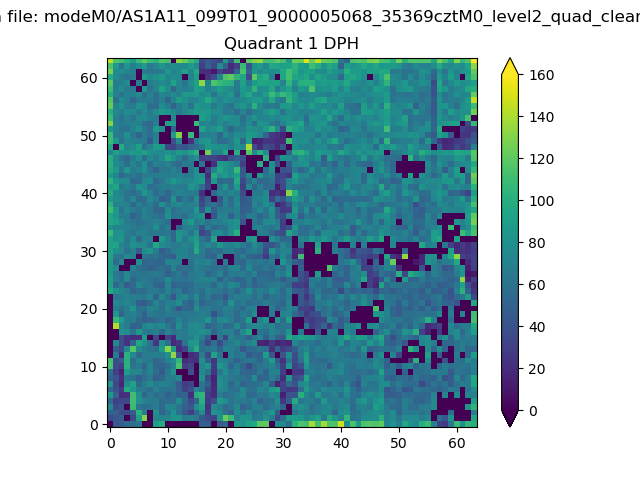 |
Quadrant B |
|---|---|---|---|
| Quadrant D | 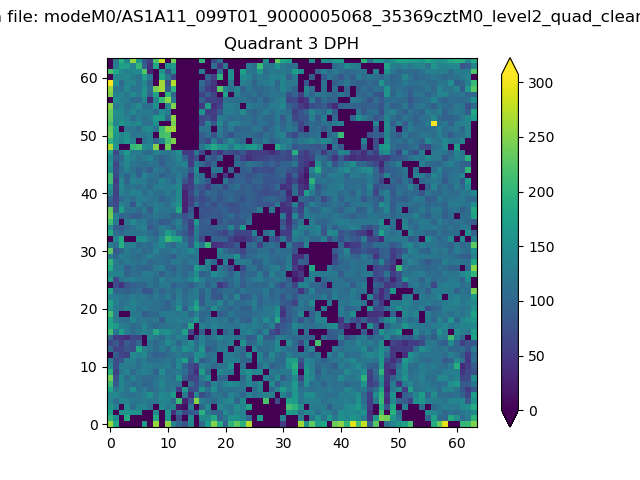 |
 |
Quadrant C |
| Plot type | Count rate plots | Images |
|---|---|---|
| Comparison with Poisson distribution Blue bars denote a histogram of data divided into 1 sec bins. Red curve is a Poisson curve with rate = median count rate of data. |
 |
 |
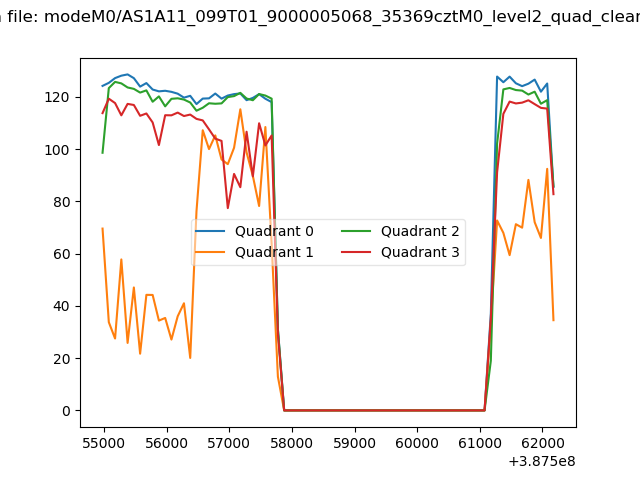
| Quadrant-wise count rates Data is divided into 100 sec bins |
 |
|
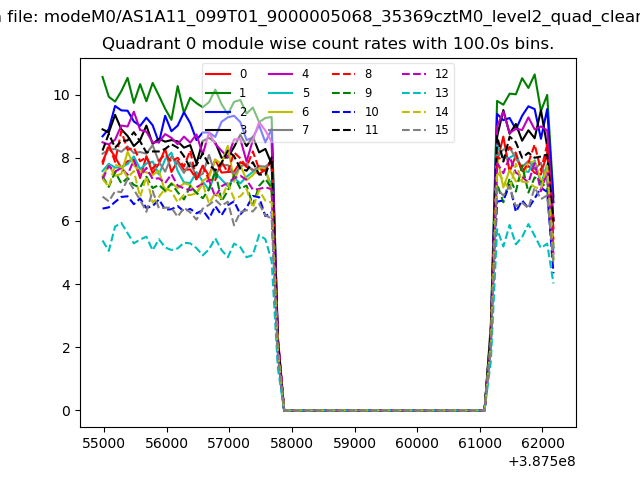
| Module-wise count rates for Quadrant A Data is divided into 100 sec bins |
 |
 |
| Module-wise count rates for Quadrant B Data is divided into 100 sec bins |
 |
 |
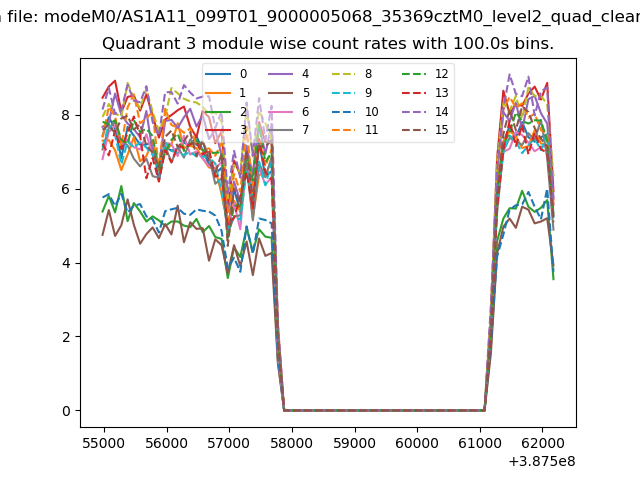
| Module-wise count rates for Quadrant C Data is divided into 100 sec bins |
 |
 |
| Module-wise count rates for Quadrant D Data is divided into 100 sec bins |
 |
 |
| Parameter | Plot |
|---|---|
| CZT HV Monitor |  |
| D_VDD | 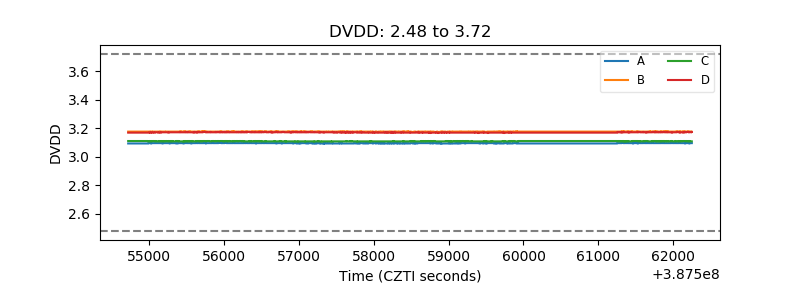 |
| Temperature 1 | 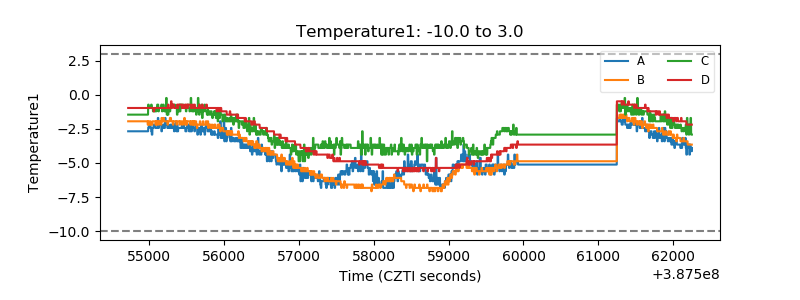 |
| Veto HV Monitor | 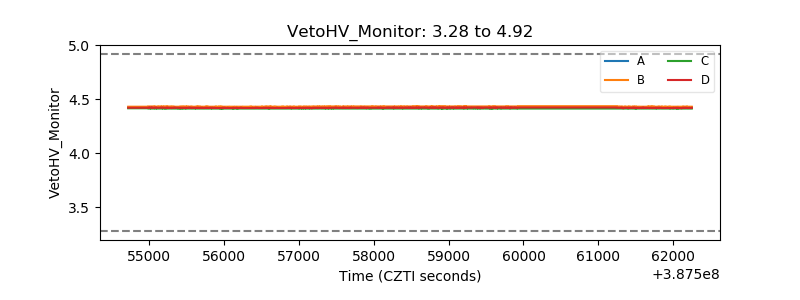 |
| Veto LLD | 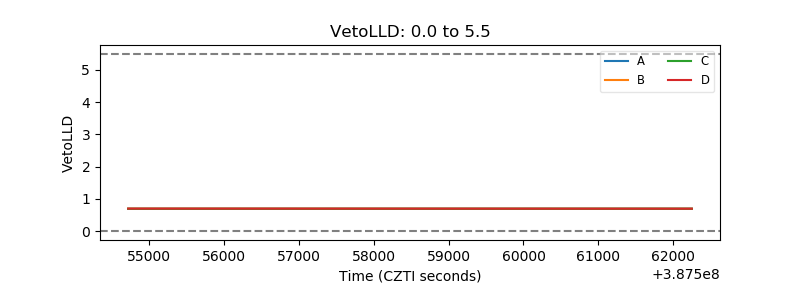 |
| Alpha Counter | 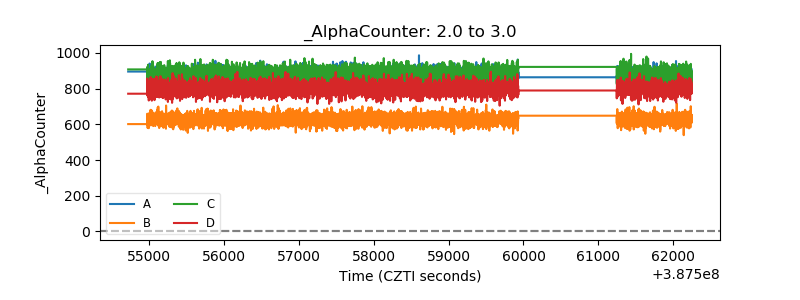 |
| _CPM_Rate | 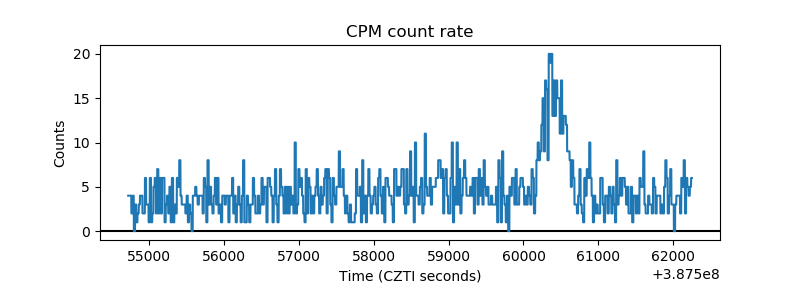 |
| CZT Counter | 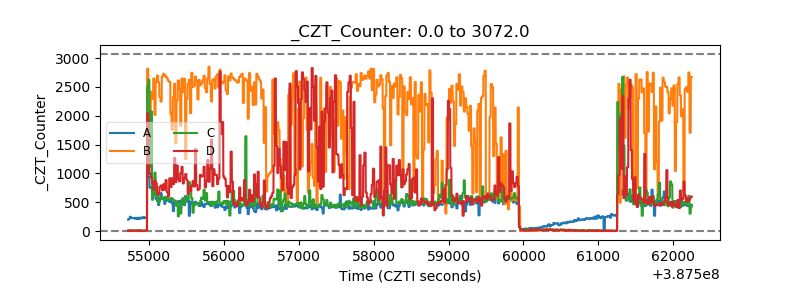 |
| +2.5 Volts monitor |  |
| +5 Volts monitor |  |
| _ROLL_ROT | 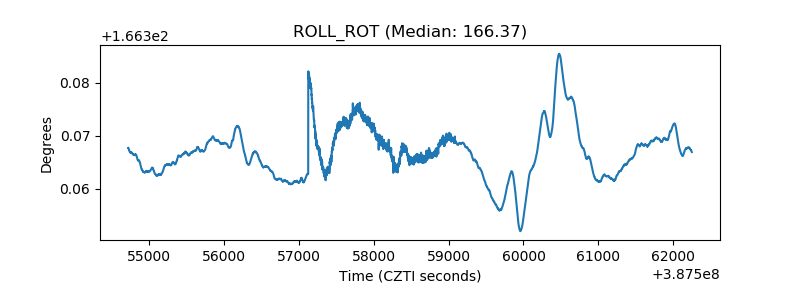 |
| _Roll_DEC |  |
| _Roll_RA | 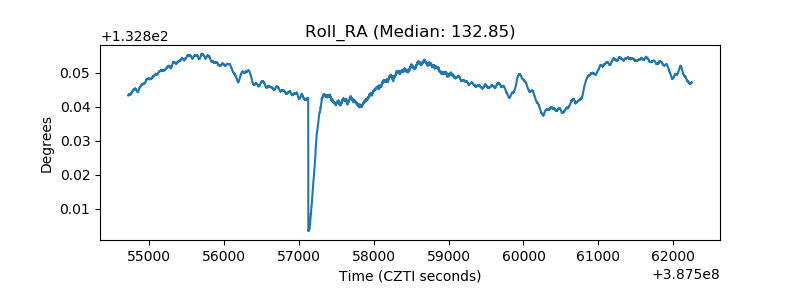 |
| Veto Counter | 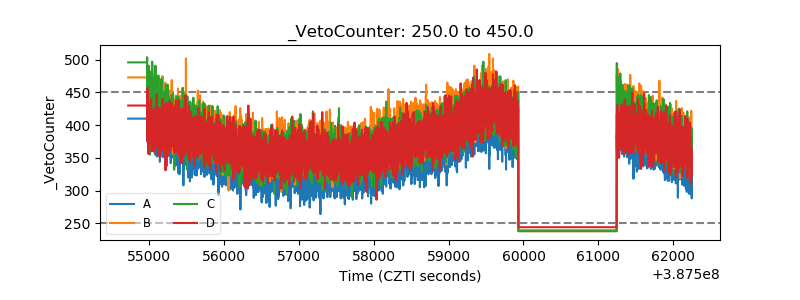 |