| Param | Original file | Final file |
|---|---|---|
| Filename | modeM0/AS1A11_099T01_9000005068_35380cztM0_level2.evt | modeM0/AS1A11_099T01_9000005068_35380cztM0_level2_quad_clean.evt |
| Size (bytes) | 886,415,040 | 61,977,600 |
| Size | 845.4 MB | 59.1 MB |
| Events in quadrant A | 2,629,295 | 509,213 |
| Events in quadrant B | 7,341,969 | 339,765 |
| Events in quadrant C | 4,258,558 | 489,128 |
| Events in quadrant D | 12,272,773 | 178,648 |
| Mode M9 | |||
|---|---|---|---|
| Quadrant | BADHDUFLAG | Total packets | Discarded packets |
| A | 0 | 28 | 0 |
| B | 0 | 28 | 0 |
| C | 0 | 28 | 0 |
| D | 0 | 29 | 0 |
| Mode M0 | |||
|---|---|---|---|
| Quadrant | BADHDUFLAG | Total packets | Discarded packets |
| A | 0 | 10769 | 3 |
| B | 0 | 25111 | 2 |
| C | 0 | 15791 | 2 |
| D | 0 | 39903 | 2 |
| Mode SS | |||
|---|---|---|---|
| Quadrant | BADHDUFLAG | Total packets | Discarded packets |
| A | 0 | 104 | 0 |
| B | 0 | 104 | 0 |
| C | 0 | 104 | 0 |
| D | 0 | 104 | 0 |
| Quadrant | Total seconds | Saturated seconds | Saturation percentage |
|---|---|---|---|
| A | 5094 | 12 | 0.235571% |
| B | 5094 | 2127 | 41.755006% |
| C | 5094 | 343 | 6.733412% |
| D | 5094 | 4326 | 84.923439% |
Noise dominated data is calculated using 1-second bins in cleaned event files. If a bin has >2000 counts, and if more than 50% of those come from <1% of pixels, then it is considered to be noise-dominated and hence unusable.
| Quadrant | # 1 sec bins | Bins with >0 counts | Bins with >2000 counts | High rate bins dominated by noise | Noise dominated (total time) | Noise dominated (detector-on time) | Marked lightcurve |
|---|---|---|---|---|---|---|---|
| A | 7098 | 5095 | 2 | 2 | 0.03% | 0.04% | 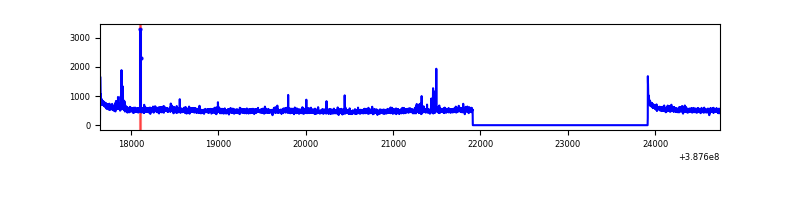 |
| B | 7098 | 5095 | 1944 | 1944 | 27.39% | 38.16% | 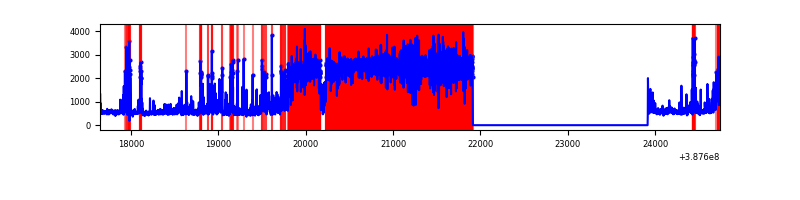 |
| C | 7098 | 5095 | 279 | 279 | 3.93% | 5.48% | 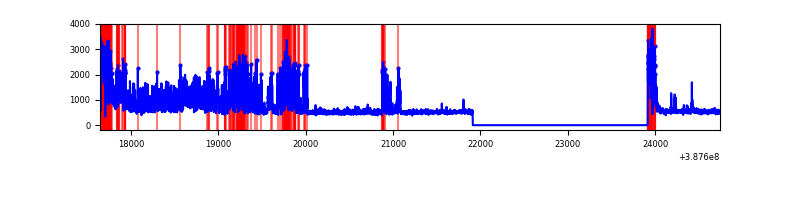 |
| D | 7098 | 5095 | 4076 | 4076 | 57.42% | 80.00% | 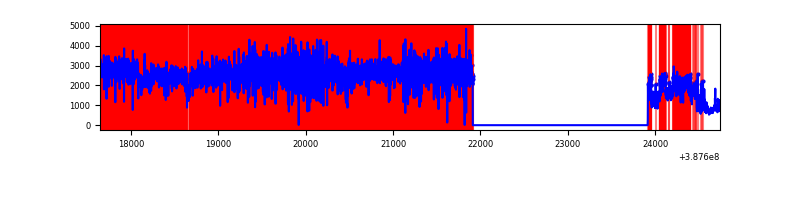 |
Top three noisy pixels from each quadrant. If the there are fewer than three noisy pixels in the level2.evt file, extra rows are filled as -1
| Pixel properties | Quadrant properties | ||||||
|---|---|---|---|---|---|---|---|
| Quadrant | DetID | PixID | Counts | Sigma | Mean | Median | Sigma |
| A | 10 | 83 | 122837 | 951.09 | 630 | 618 | 128.5 |
| A | 14 | 254 | 33640 | 256.97 | 630 | 618 | 128.5 |
| A | 13 | 6 | 15242 | 113.8 | 630 | 618 | 128.5 |
| B | 4 | 251 | 1746413 | 18872.2 | 481 | 470 | 92.5 |
| B | 5 | 31 | 1085501 | 11728.29 | 481 | 470 | 92.5 |
| B | 5 | 15 | 1055776 | 11406.99 | 481 | 470 | 92.5 |
| C | 10 | 49 | 1302536 | 9541.38 | 588 | 593 | 136.5 |
| C | 0 | 10 | 398511 | 2916.17 | 588 | 593 | 136.5 |
| C | 15 | 214 | 212707 | 1554.49 | 588 | 593 | 136.5 |
| D | 7 | 80 | 8392553 | 109426.64 | 302 | 293 | 76.7 |
| D | 12 | 235 | 1794909 | 23399.99 | 302 | 293 | 76.7 |
| D | 10 | 118 | 269506 | 3510.27 | 302 | 293 | 76.7 |
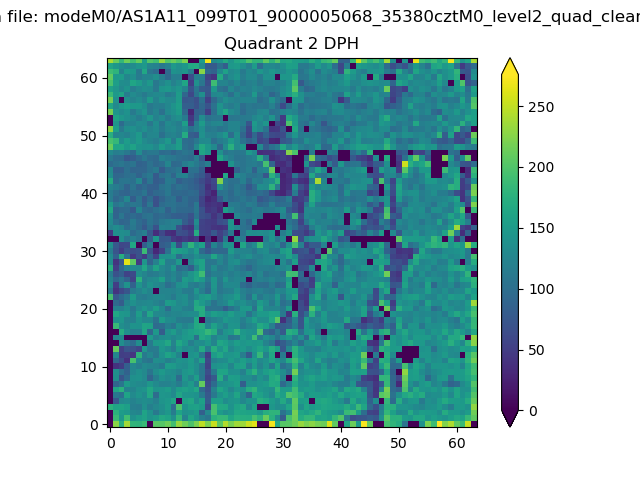
Histogram calculated using DETX and DETY for each event in the final _common_clean file
| Quadrant A | 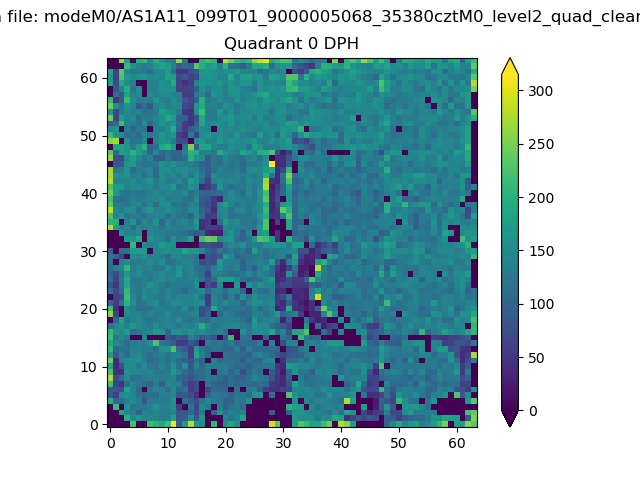 |
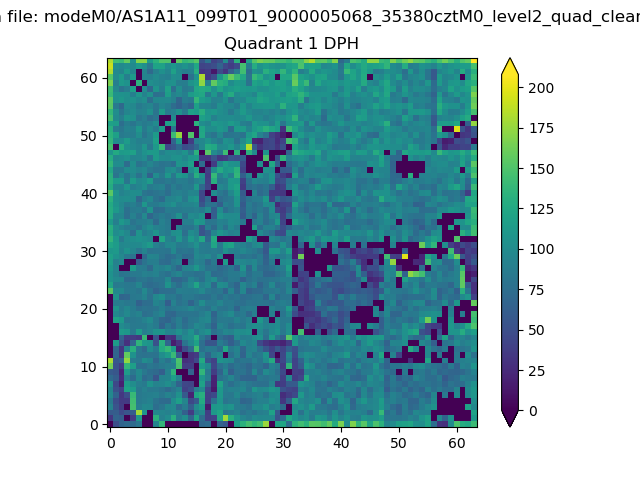 |
Quadrant B |
|---|---|---|---|
| Quadrant D | 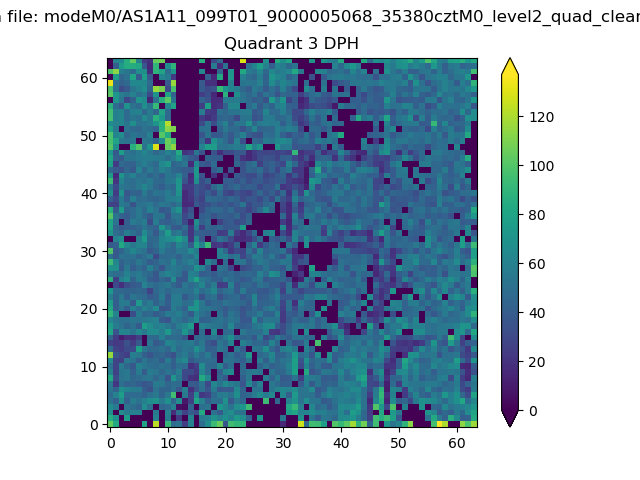 |
 |
Quadrant C |
| Plot type | Count rate plots | Images |
|---|---|---|
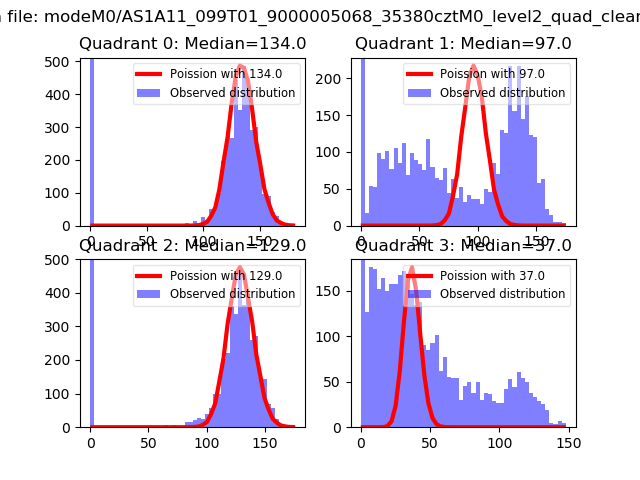
| Comparison with Poisson distribution Blue bars denote a histogram of data divided into 1 sec bins. Red curve is a Poisson curve with rate = median count rate of data. |
 |
 |
| Quadrant-wise count rates Data is divided into 100 sec bins |
 |
|
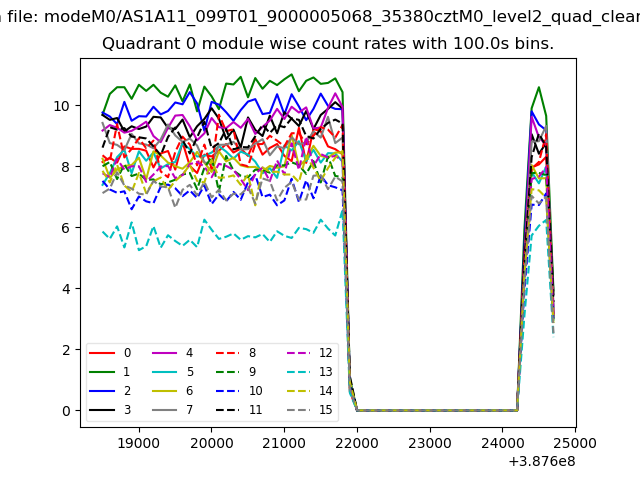
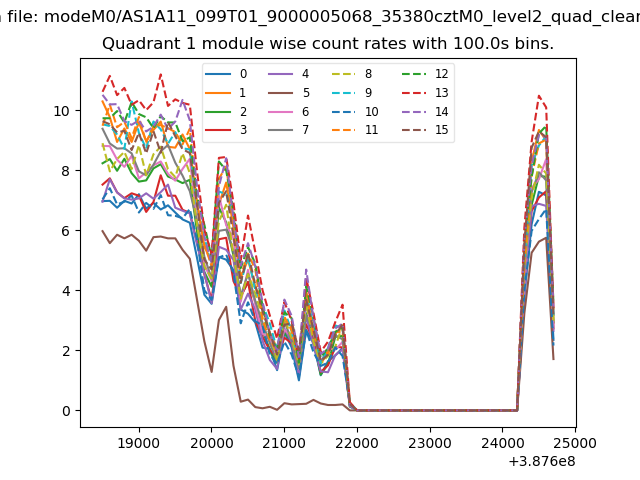
| Module-wise count rates for Quadrant A Data is divided into 100 sec bins |
 |
 |
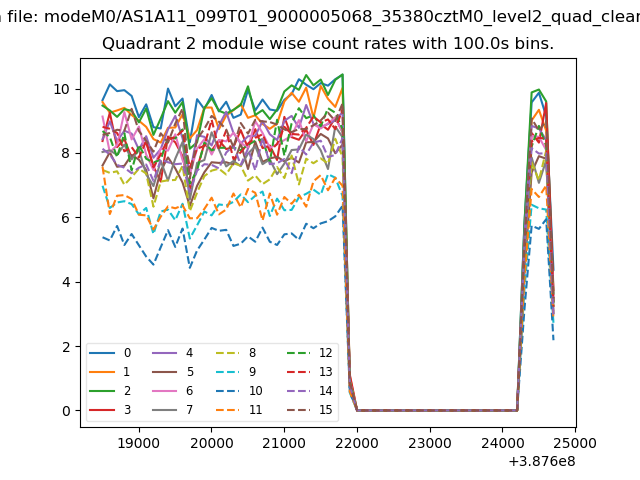
| Module-wise count rates for Quadrant B Data is divided into 100 sec bins |
 |
 |
| Module-wise count rates for Quadrant C Data is divided into 100 sec bins |
 |
 |
| Module-wise count rates for Quadrant D Data is divided into 100 sec bins |
 |
 |
| Parameter | Plot |
|---|---|
| CZT HV Monitor | 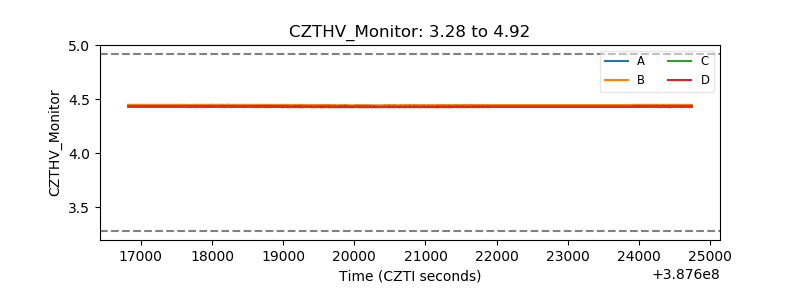 |
| D_VDD | 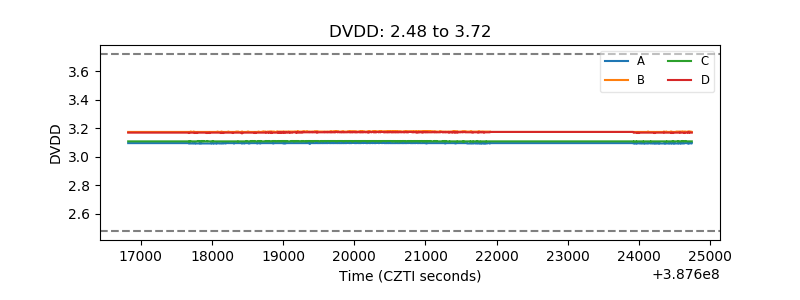 |
| Temperature 1 | 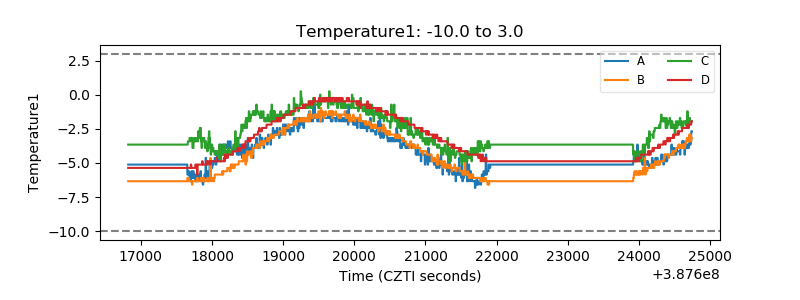 |
| Veto HV Monitor | 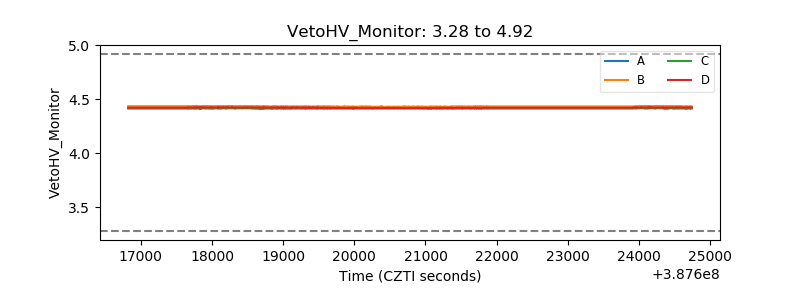 |
| Veto LLD | 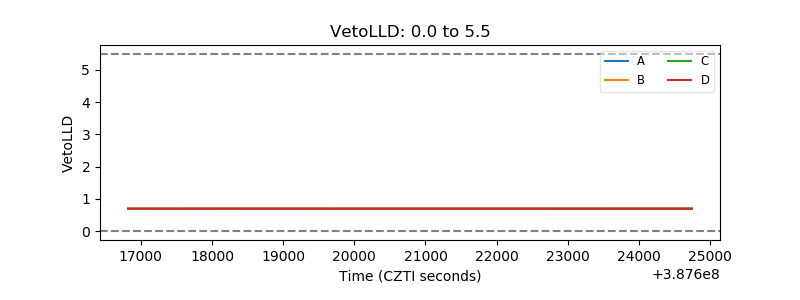 |
| Alpha Counter |  |
| _CPM_Rate | 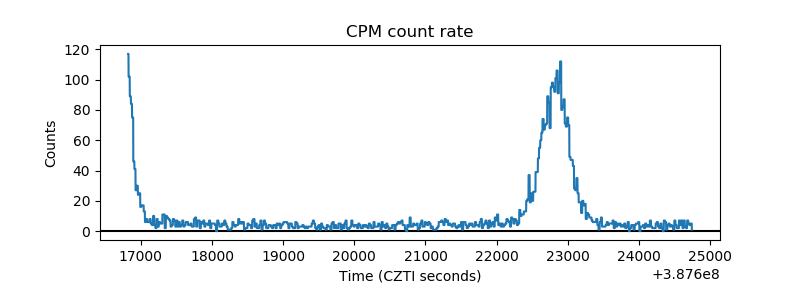 |
| CZT Counter | 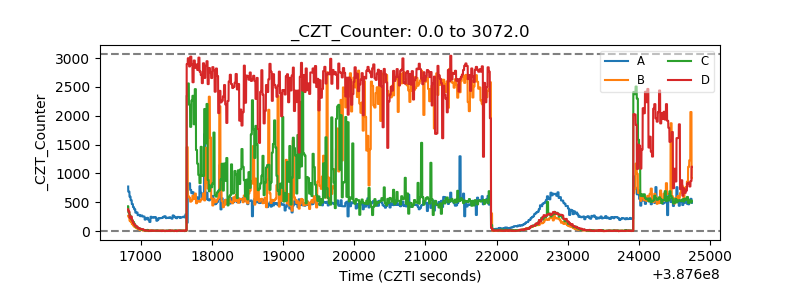 |
| +2.5 Volts monitor |  |
| +5 Volts monitor |  |
| _ROLL_ROT | 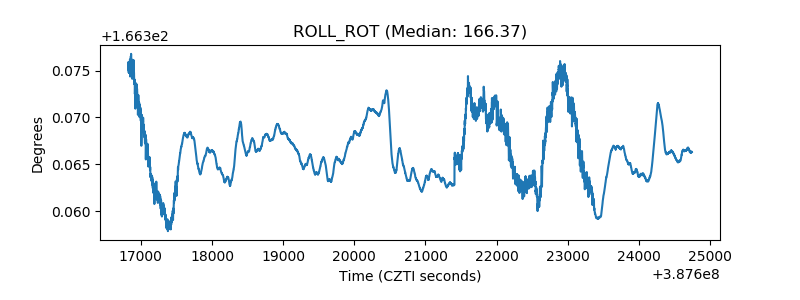 |
| _Roll_DEC |  |
| _Roll_RA | 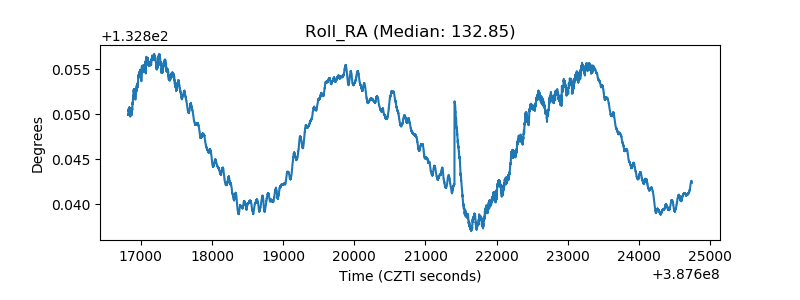 |
| Veto Counter | 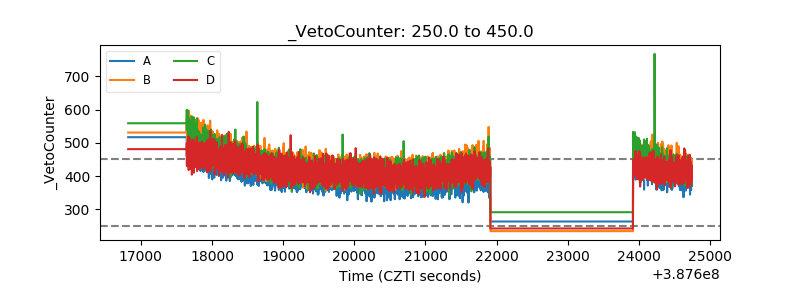 |