| Param | Original file | Final file |
|---|---|---|
| Filename | modeM0/AS1A11_099T01_9000005068_35386cztM0_level2.evt | modeM0/AS1A11_099T01_9000005068_35386cztM0_level2_quad_clean.evt |
| Size (bytes) | 2,076,045,120 | 159,693,120 |
| Size | 1.9 GB | 152.3 MB |
| Events in quadrant A | 7,495,433 | 1,102,167 |
| Events in quadrant B | 27,490,988 | 688,802 |
| Events in quadrant C | 8,806,367 | 1,072,057 |
| Events in quadrant D | 18,030,084 | 890,129 |
| Mode M9 | |||
|---|---|---|---|
| Quadrant | BADHDUFLAG | Total packets | Discarded packets |
| A | 0 | 43 | 0 |
| B | 0 | 43 | 0 |
| C | 0 | 43 | 0 |
| D | 0 | 44 | 0 |
| Mode M0 | |||
|---|---|---|---|
| Quadrant | BADHDUFLAG | Total packets | Discarded packets |
| A | 0 | 32765 | 5 |
| B | 0 | 92424 | 4 |
| C | 0 | 35856 | 4 |
| D | 0 | 64095 | 4 |
| Mode SS | |||
|---|---|---|---|
| Quadrant | BADHDUFLAG | Total packets | Discarded packets |
| A | 0 | 318 | 0 |
| B | 0 | 318 | 0 |
| C | 0 | 318 | 0 |
| D | 0 | 318 | 0 |
| Quadrant | Total seconds | Saturated seconds | Saturation percentage |
|---|---|---|---|
| A | 15646 | 32 | 0.204525% |
| B | 15646 | 8857 | 56.608718% |
| C | 15646 | 214 | 1.367762% |
| D | 15646 | 3174 | 20.286335% |
Noise dominated data is calculated using 1-second bins in cleaned event files. If a bin has >2000 counts, and if more than 50% of those come from <1% of pixels, then it is considered to be noise-dominated and hence unusable.
| Quadrant | # 1 sec bins | Bins with >0 counts | Bins with >2000 counts | High rate bins dominated by noise | Noise dominated (total time) | Noise dominated (detector-on time) | Marked lightcurve |
|---|---|---|---|---|---|---|---|
| A | 19822 | 15649 | 0 | 0 | 0.00% | 0.00% | 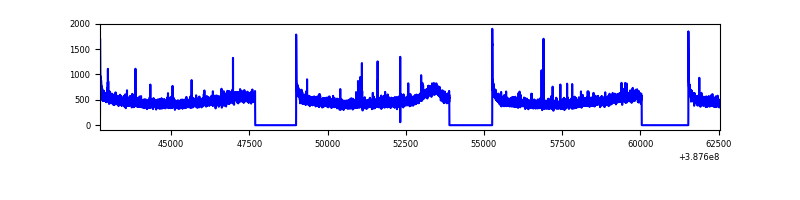 |
| B | 19822 | 15649 | 7001 | 7001 | 35.32% | 44.74% | 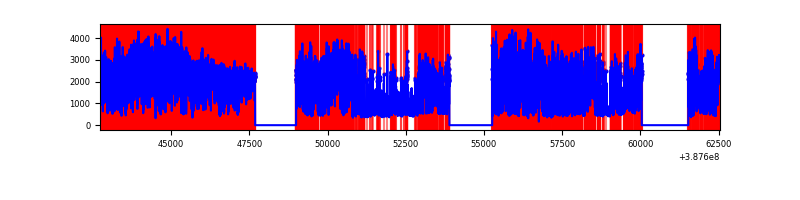 |
| C | 19822 | 15649 | 154 | 154 | 0.78% | 0.98% | 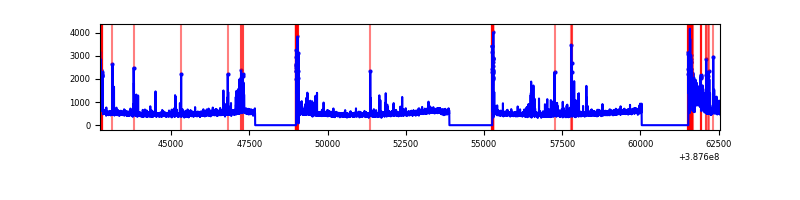 |
| D | 19822 | 15649 | 3230 | 3230 | 16.30% | 20.64% | 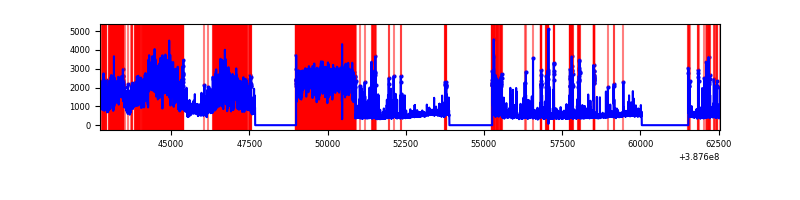 |
Top three noisy pixels from each quadrant. If the there are fewer than three noisy pixels in the level2.evt file, extra rows are filled as -1
| Pixel properties | Quadrant properties | ||||||
|---|---|---|---|---|---|---|---|
| Quadrant | DetID | PixID | Counts | Sigma | Mean | Median | Sigma |
| A | 10 | 83 | 297415 | 794.02 | 1842 | 1804 | 372.3 |
| A | 13 | 6 | 39462 | 101.15 | 1842 | 1804 | 372.3 |
| A | 9 | 143 | 30627 | 77.42 | 1842 | 1804 | 372.3 |
| B | 4 | 251 | 20733274 | 80240.01 | 1350 | 1313 | 258.4 |
| B | 5 | 236 | 612032 | 2363.7 | 1350 | 1313 | 258.4 |
| B | 5 | 172 | 485938 | 1875.67 | 1350 | 1313 | 258.4 |
| C | 15 | 214 | 638359 | 1553.57 | 1771 | 1787 | 409.7 |
| C | 0 | 10 | 608449 | 1480.57 | 1771 | 1787 | 409.7 |
| C | 0 | 207 | 448796 | 1090.94 | 1771 | 1787 | 409.7 |
| D | 7 | 80 | 7871190 | 19101.61 | 1659 | 1610 | 412.0 |
| D | 12 | 235 | 1414356 | 3429.12 | 1659 | 1610 | 412.0 |
| D | 10 | 118 | 600898 | 1454.63 | 1659 | 1610 | 412.0 |
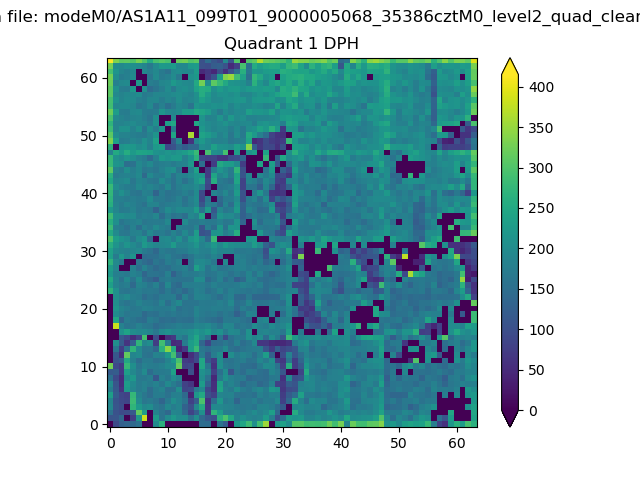
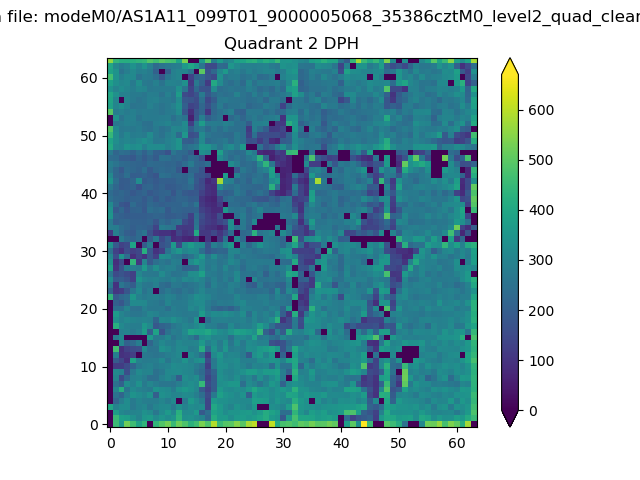
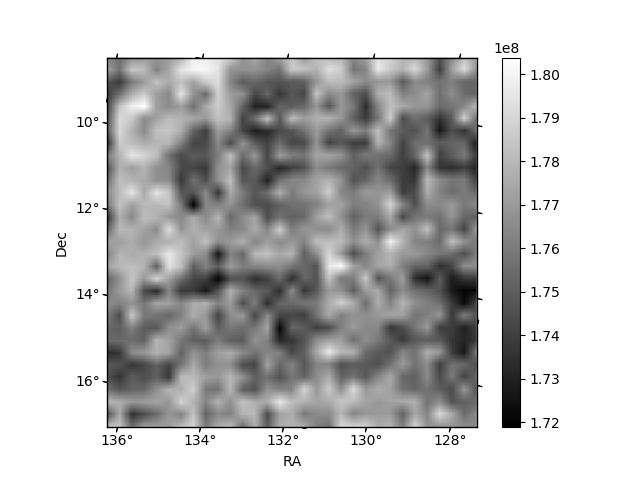
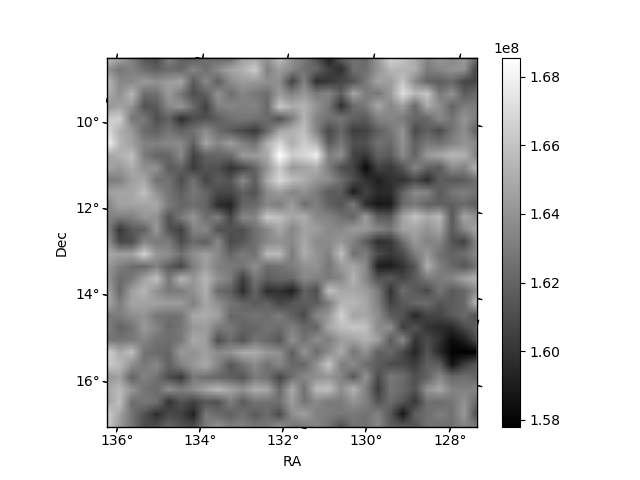
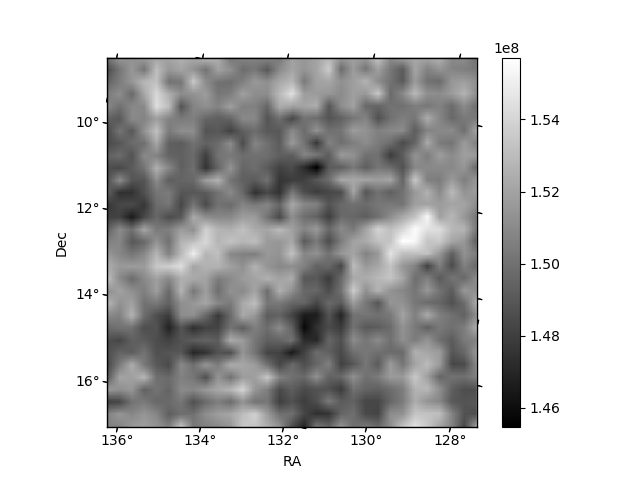
Histogram calculated using DETX and DETY for each event in the final _common_clean file
| Quadrant A |  |
 |
Quadrant B |
|---|---|---|---|
| Quadrant D | 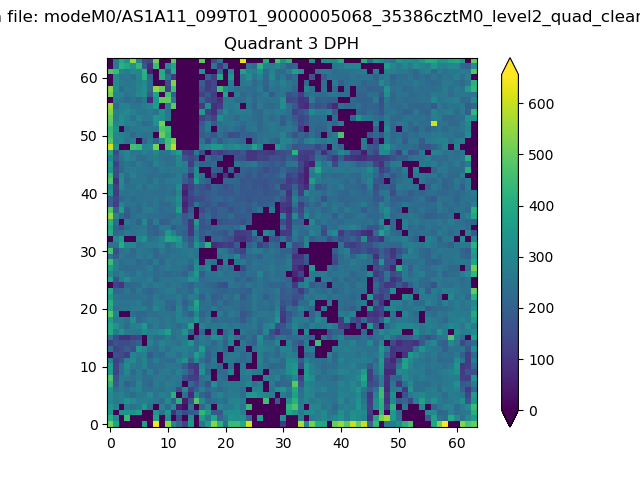 |
 |
Quadrant C |
| Plot type | Count rate plots | Images |
|---|---|---|
| Comparison with Poisson distribution Blue bars denote a histogram of data divided into 1 sec bins. Red curve is a Poisson curve with rate = median count rate of data. |
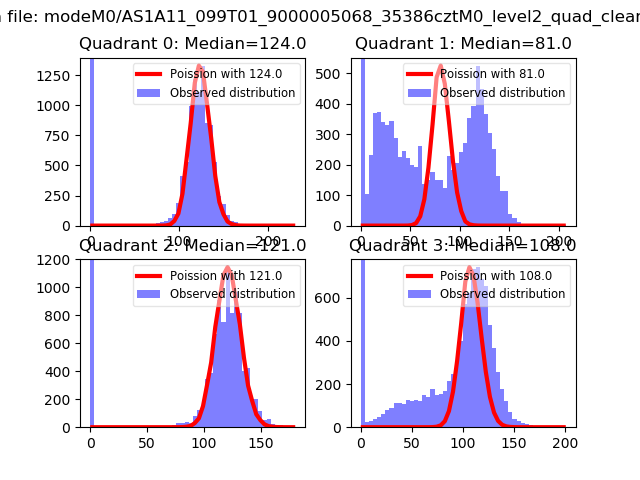 |
 |
| Quadrant-wise count rates Data is divided into 100 sec bins |
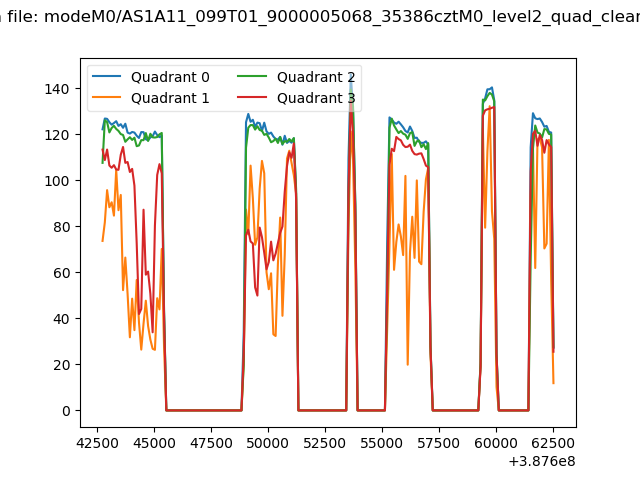 |
|
| Module-wise count rates for Quadrant A Data is divided into 100 sec bins |
 |
 |
| Module-wise count rates for Quadrant B Data is divided into 100 sec bins |
 |
 |
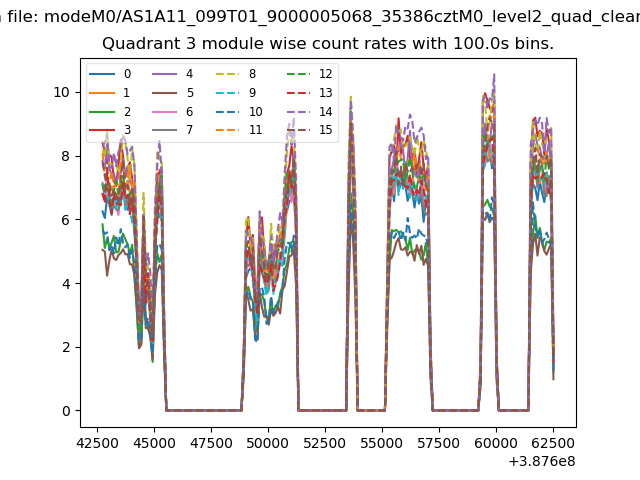
| Module-wise count rates for Quadrant C Data is divided into 100 sec bins |
 |
 |
| Module-wise count rates for Quadrant D Data is divided into 100 sec bins |
 |
 |
| Parameter | Plot |
|---|---|
| CZT HV Monitor |  |
| D_VDD | 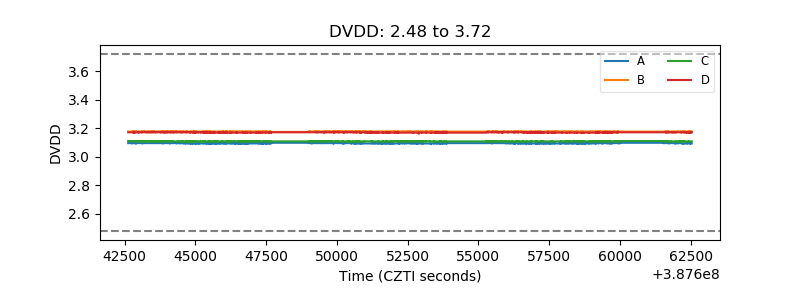 |
| Temperature 1 | 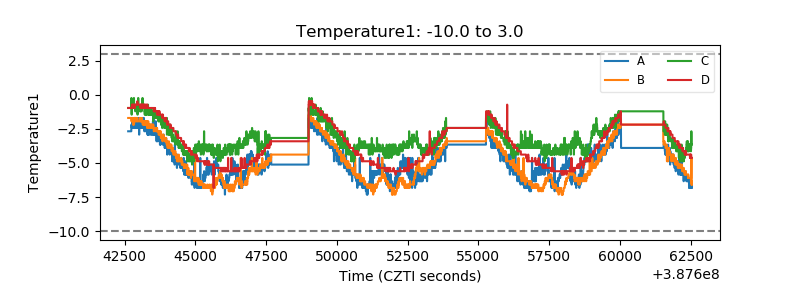 |
| Veto HV Monitor | 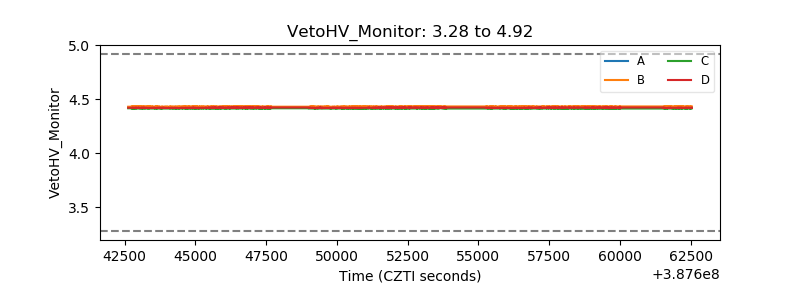 |
| Veto LLD | 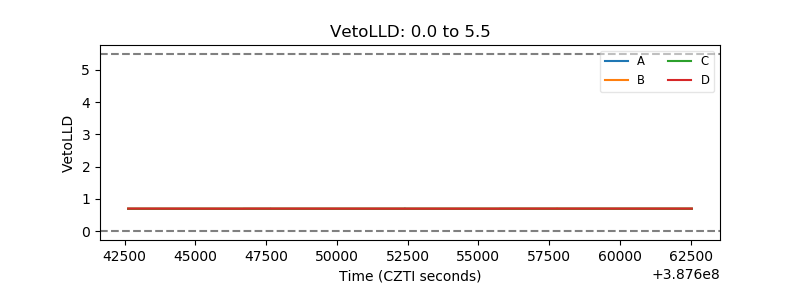 |
| Alpha Counter | 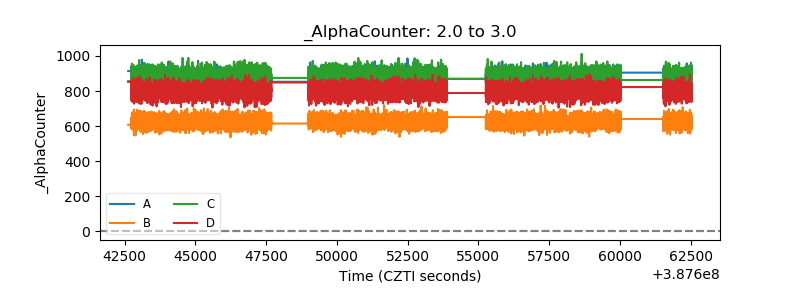 |
| _CPM_Rate | 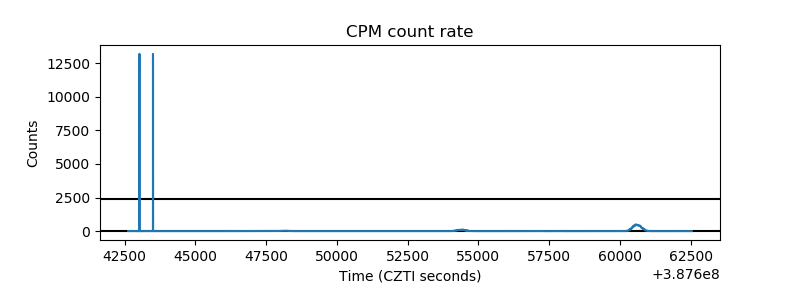 |
| CZT Counter | 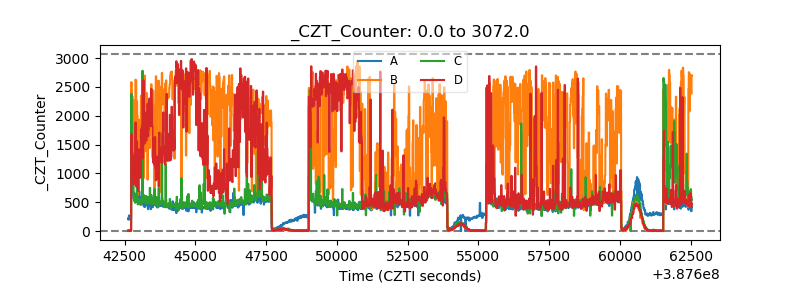 |
| +2.5 Volts monitor |  |
| +5 Volts monitor |  |
| _ROLL_ROT | 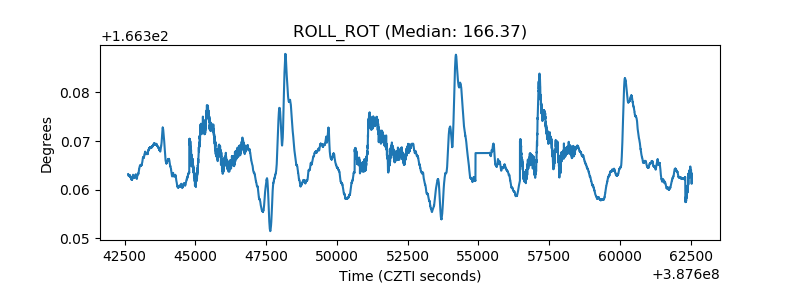 |
| _Roll_DEC | 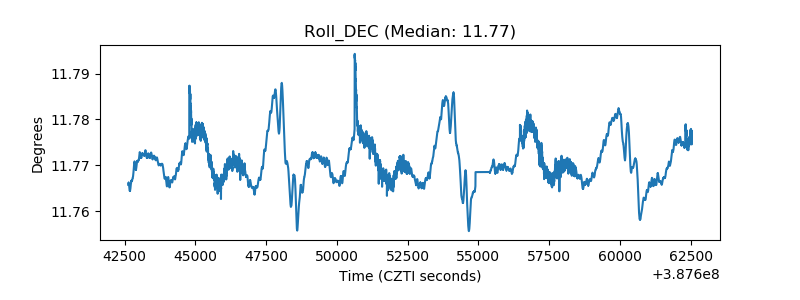 |
| _Roll_RA |  |
| Veto Counter | 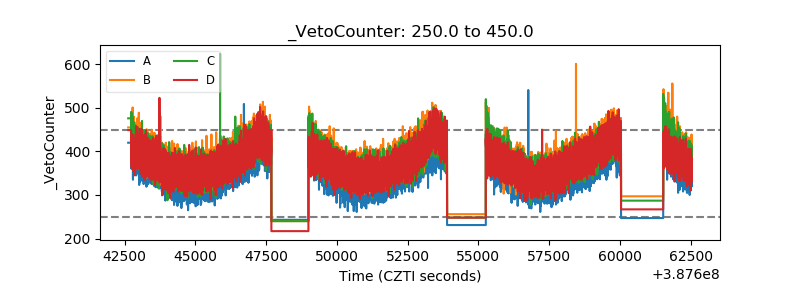 |