| Param | Original file | Final file |
|---|---|---|
| Filename | modeM0/AS1A11_099T01_9000005068_35395cztM0_level2.evt | modeM0/AS1A11_099T01_9000005068_35395cztM0_level2_quad_clean.evt |
| Size (bytes) | 718,836,480 | 71,844,480 |
| Size | 685.5 MB | 68.5 MB |
| Events in quadrant A | 2,575,245 | 530,520 |
| Events in quadrant B | 9,251,500 | 339,393 |
| Events in quadrant C | 3,153,758 | 517,897 |
| Events in quadrant D | 6,441,352 | 424,947 |
| Mode M9 | |||
|---|---|---|---|
| Quadrant | BADHDUFLAG | Total packets | Discarded packets |
| A | 0 | 34 | 0 |
| B | 0 | 34 | 0 |
| C | 0 | 34 | 0 |
| D | 0 | 35 | 0 |
| Mode M0 | |||
|---|---|---|---|
| Quadrant | BADHDUFLAG | Total packets | Discarded packets |
| A | 0 | 10696 | 3 |
| B | 0 | 30983 | 2 |
| C | 0 | 12321 | 2 |
| D | 0 | 22680 | 2 |
| Mode SS | |||
|---|---|---|---|
| Quadrant | BADHDUFLAG | Total packets | Discarded packets |
| A | 0 | 104 | 0 |
| B | 0 | 104 | 0 |
| C | 0 | 104 | 0 |
| D | 0 | 104 | 0 |
| Quadrant | Total seconds | Saturated seconds | Saturation percentage |
|---|---|---|---|
| A | 5157 | 8 | 0.155129% |
| B | 5157 | 2918 | 56.583285% |
| C | 5157 | 152 | 2.947450% |
| D | 5157 | 1252 | 24.277681% |
Noise dominated data is calculated using 1-second bins in cleaned event files. If a bin has >2000 counts, and if more than 50% of those come from <1% of pixels, then it is considered to be noise-dominated and hence unusable.
| Quadrant | # 1 sec bins | Bins with >0 counts | Bins with >2000 counts | High rate bins dominated by noise | Noise dominated (total time) | Noise dominated (detector-on time) | Marked lightcurve |
|---|---|---|---|---|---|---|---|
| A | 7070 | 5158 | 0 | 0 | 0.00% | 0.00% | 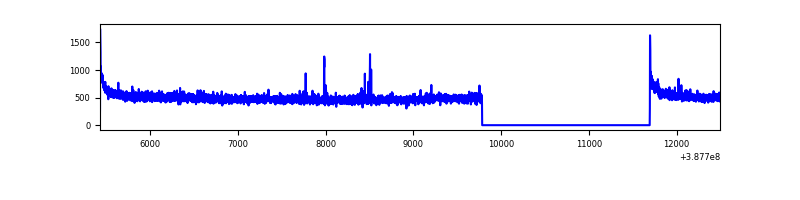 |
| B | 7070 | 5158 | 2341 | 2341 | 33.11% | 45.39% | 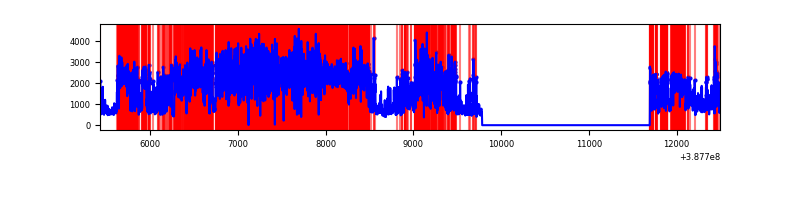 |
| C | 7070 | 5158 | 112 | 112 | 1.58% | 2.17% | 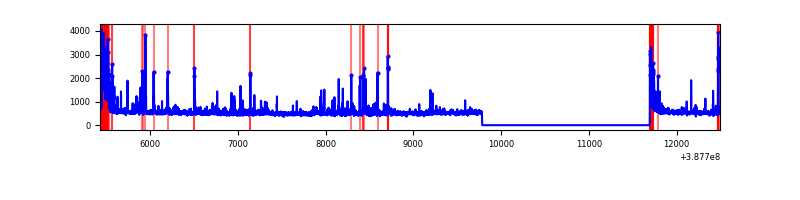 |
| D | 7070 | 5158 | 1020 | 1020 | 14.43% | 19.78% | 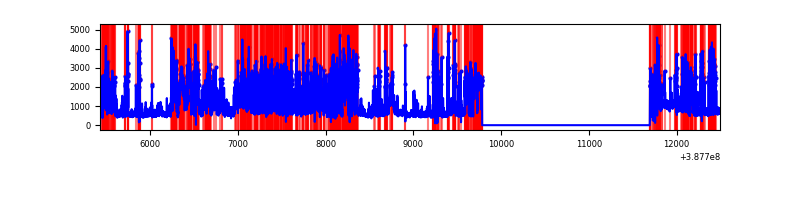 |
Top three noisy pixels from each quadrant. If the there are fewer than three noisy pixels in the level2.evt file, extra rows are filled as -1
| Pixel properties | Quadrant properties | ||||||
|---|---|---|---|---|---|---|---|
| Quadrant | DetID | PixID | Counts | Sigma | Mean | Median | Sigma |
| A | 10 | 83 | 126313 | 988.24 | 623 | 610 | 127.2 |
| A | 13 | 6 | 17297 | 131.19 | 623 | 610 | 127.2 |
| A | 9 | 143 | 10930 | 81.13 | 623 | 610 | 127.2 |
| B | 4 | 251 | 5044574 | 58135.23 | 447 | 437 | 86.8 |
| B | 0 | 182 | 474668 | 5465.66 | 447 | 437 | 86.8 |
| B | 5 | 14 | 441916 | 5088.18 | 447 | 437 | 86.8 |
| C | 0 | 10 | 376441 | 2725.57 | 591 | 597 | 137.9 |
| C | 15 | 214 | 213556 | 1544.35 | 591 | 597 | 137.9 |
| C | 0 | 207 | 197795 | 1430.05 | 591 | 597 | 137.9 |
| D | 7 | 80 | 3064981 | 23236.77 | 535 | 522 | 131.9 |
| D | 7 | 223 | 507646 | 3845.35 | 535 | 522 | 131.9 |
| D | 2 | 152 | 174728 | 1320.95 | 535 | 522 | 131.9 |
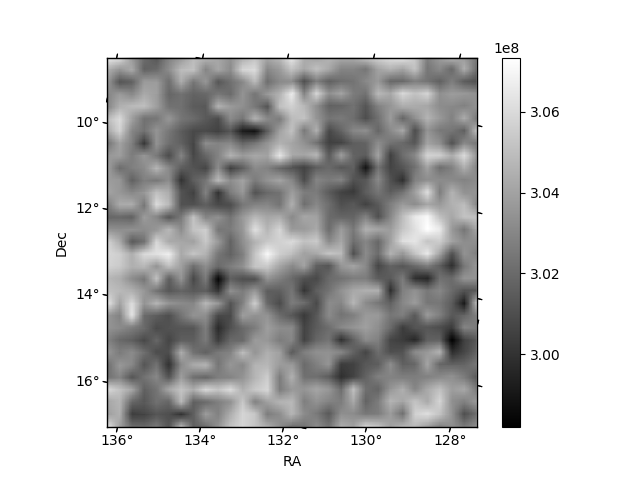
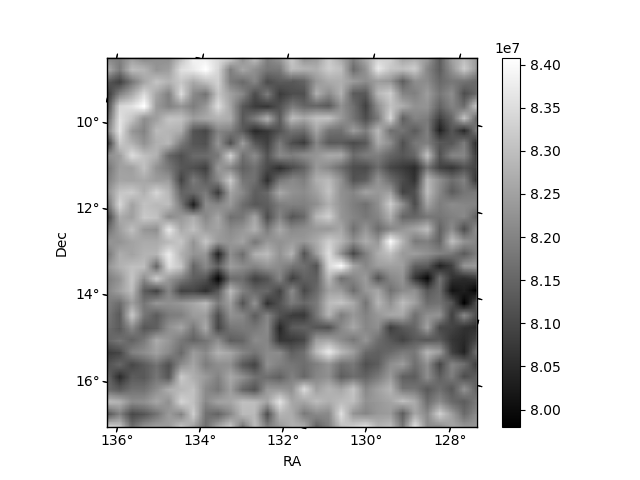
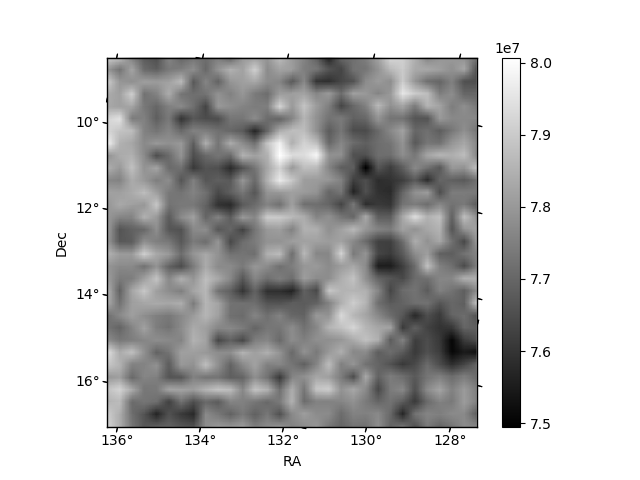
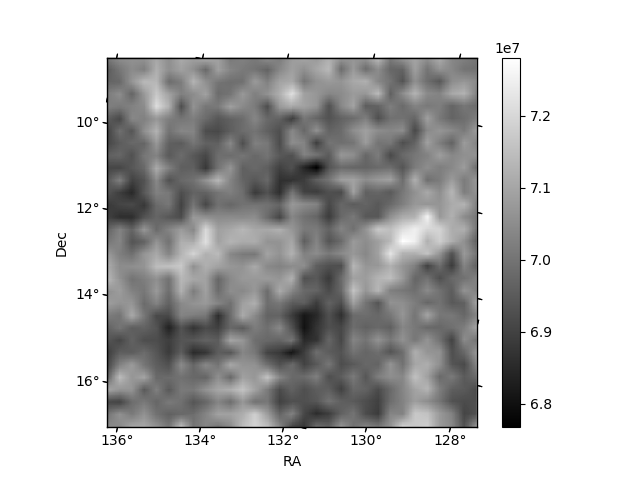
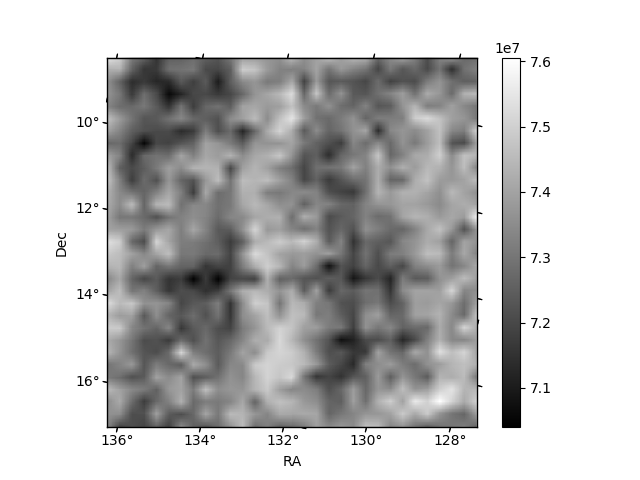
Histogram calculated using DETX and DETY for each event in the final _common_clean file
| Quadrant A | 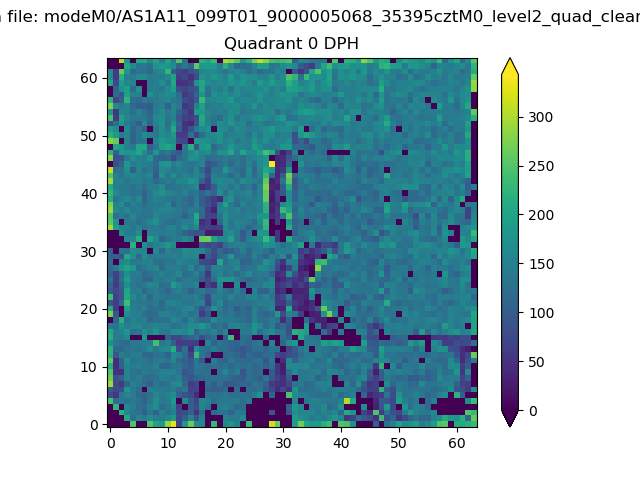 |
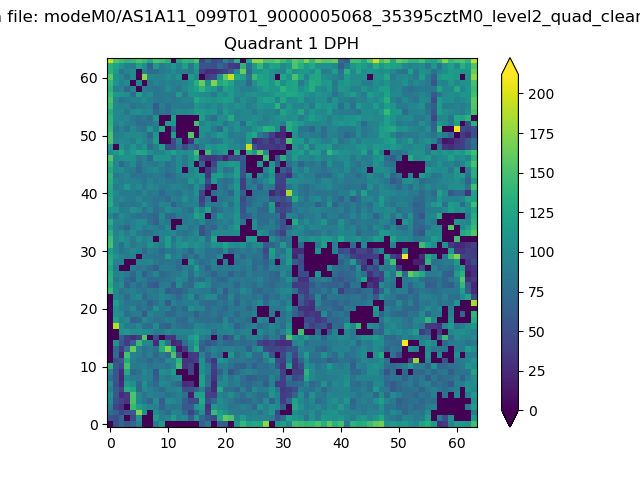 |
Quadrant B |
|---|---|---|---|
| Quadrant D | 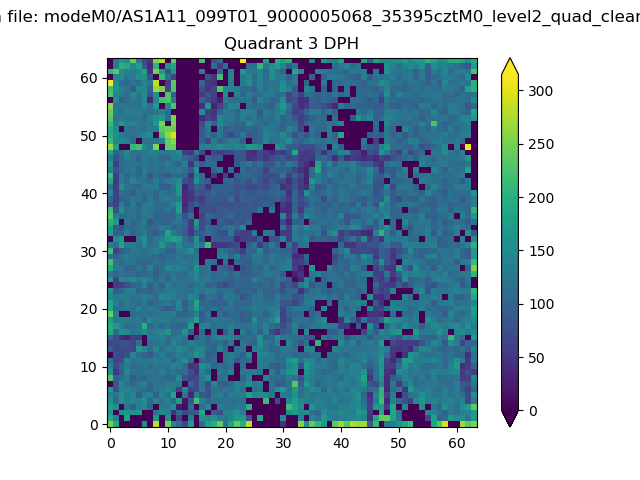 |
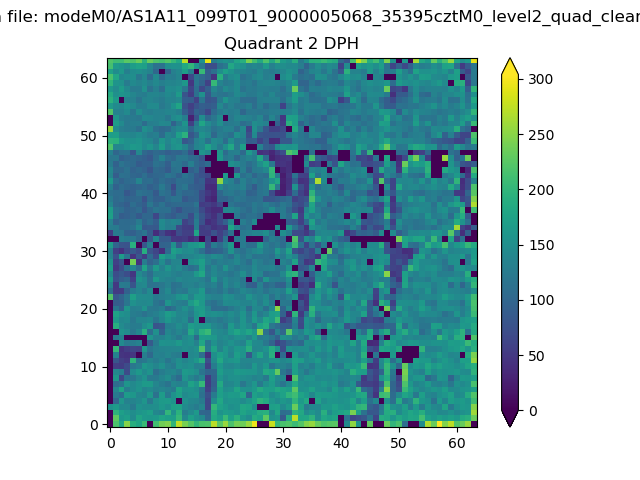 |
Quadrant C |
| Plot type | Count rate plots | Images |
|---|---|---|
| Comparison with Poisson distribution Blue bars denote a histogram of data divided into 1 sec bins. Red curve is a Poisson curve with rate = median count rate of data. |
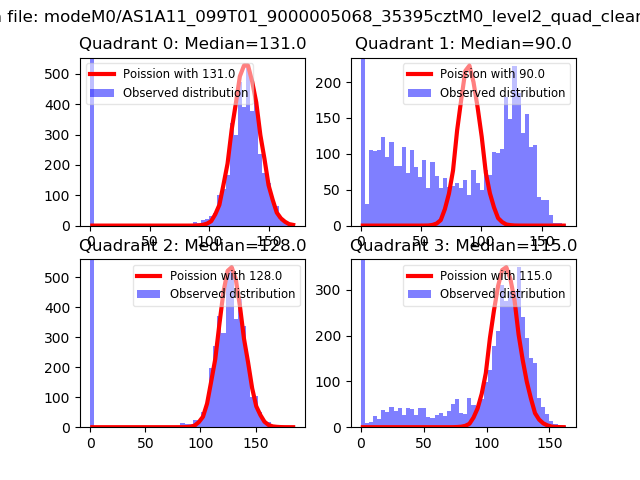 |
 |
| Quadrant-wise count rates Data is divided into 100 sec bins |
 |
|
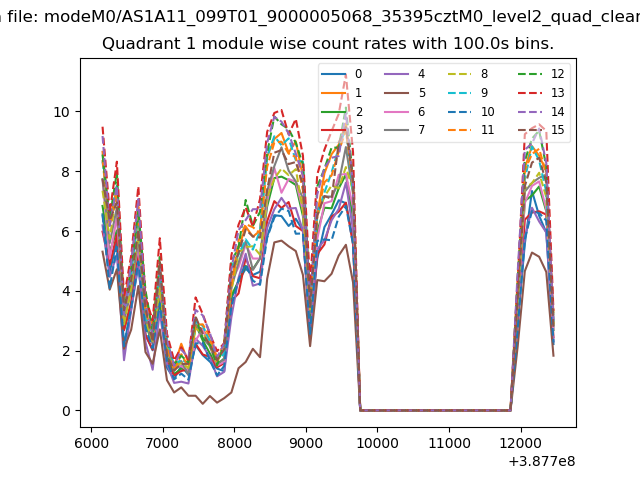
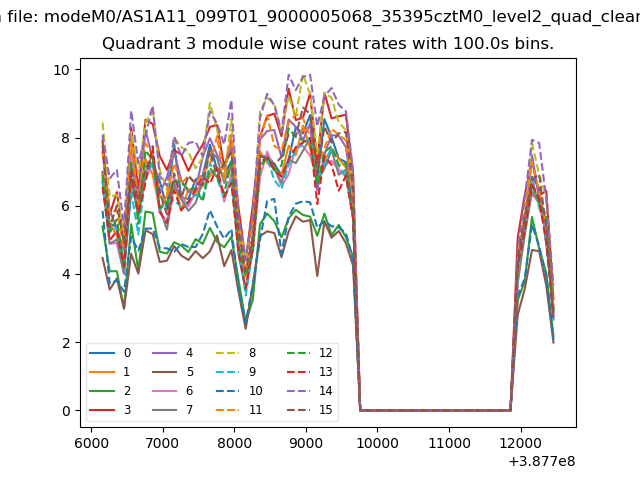
| Module-wise count rates for Quadrant A Data is divided into 100 sec bins |
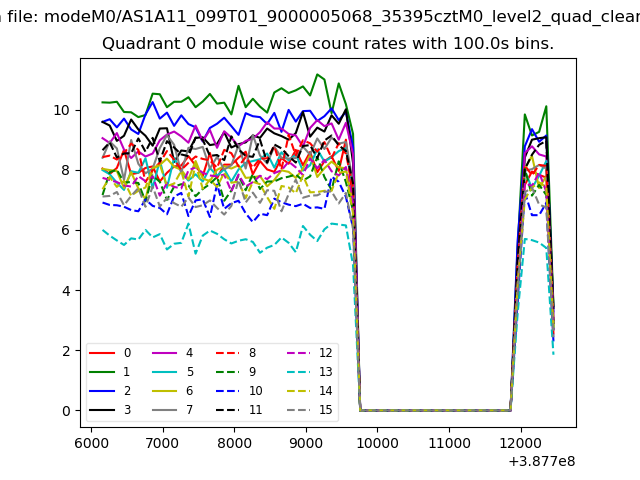 |
 |
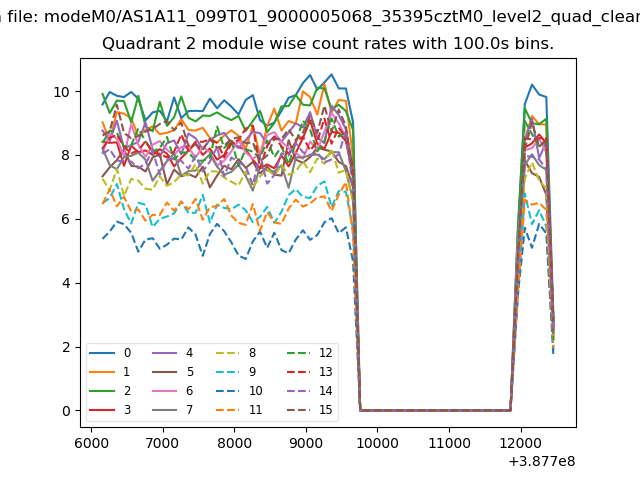
| Module-wise count rates for Quadrant B Data is divided into 100 sec bins |
 |
 |
| Module-wise count rates for Quadrant C Data is divided into 100 sec bins |
 |
 |
| Module-wise count rates for Quadrant D Data is divided into 100 sec bins |
 |
 |
| Parameter | Plot |
|---|---|
| CZT HV Monitor | 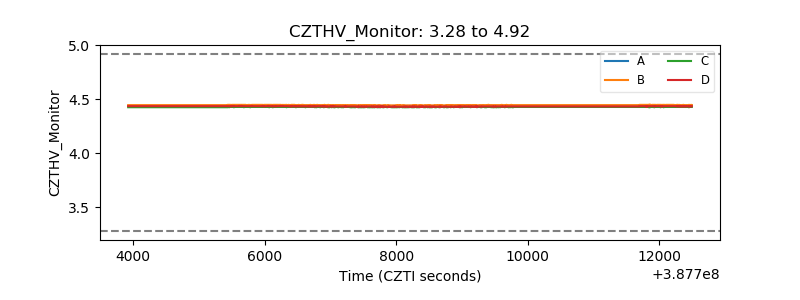 |
| D_VDD | 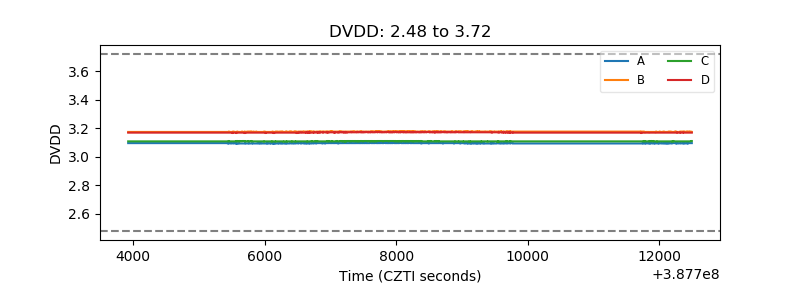 |
| Temperature 1 | 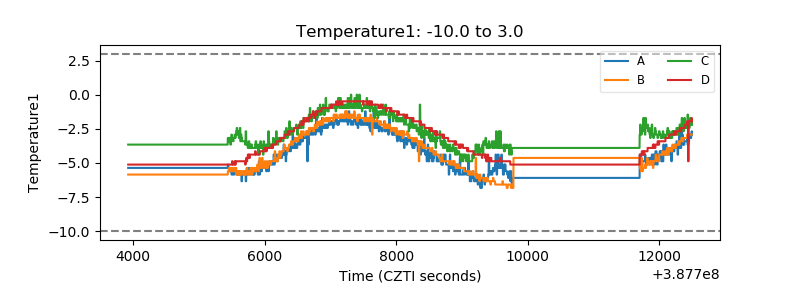 |
| Veto HV Monitor | 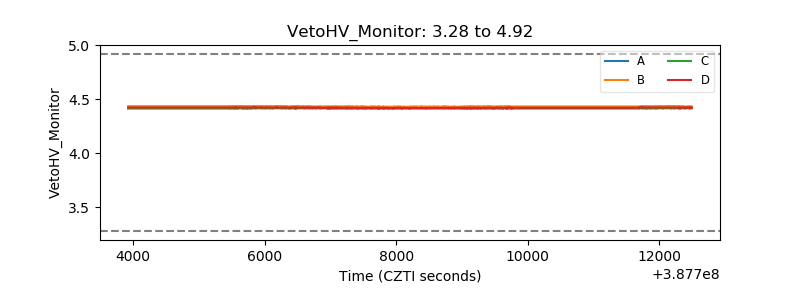 |
| Veto LLD | 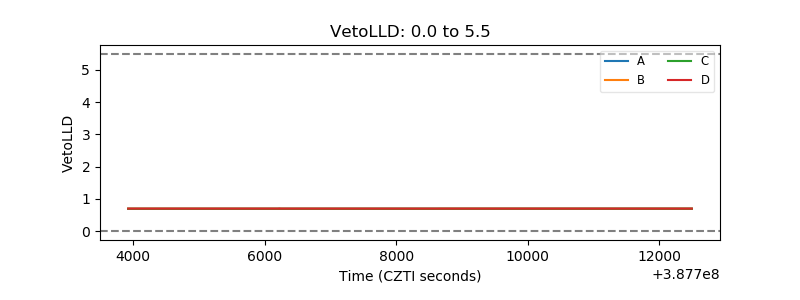 |
| Alpha Counter |  |
| _CPM_Rate | 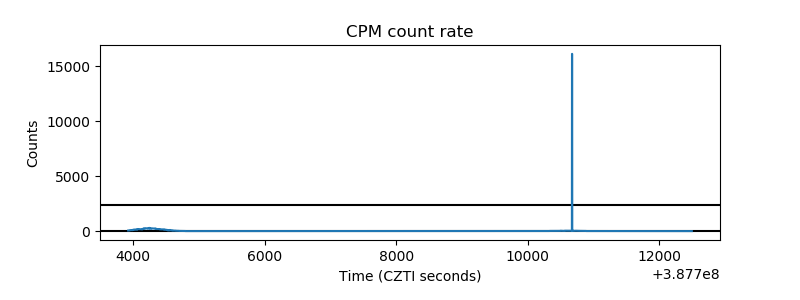 |
| CZT Counter | 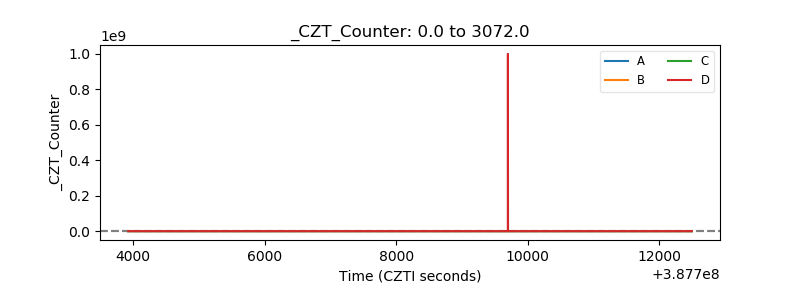 |
| +2.5 Volts monitor |  |
| +5 Volts monitor |  |
| _ROLL_ROT | 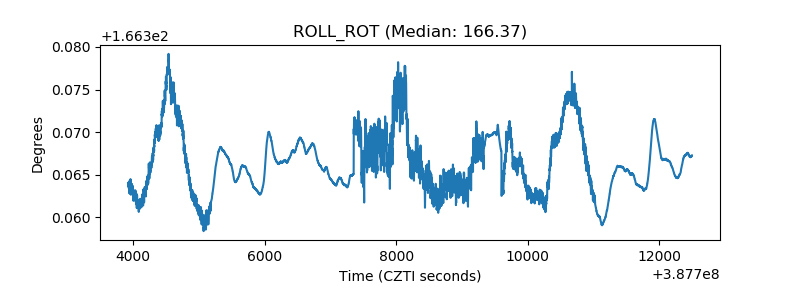 |
| _Roll_DEC |  |
| _Roll_RA | 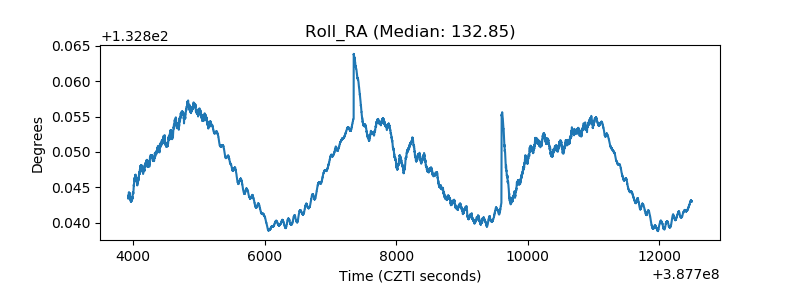 |
| Veto Counter | 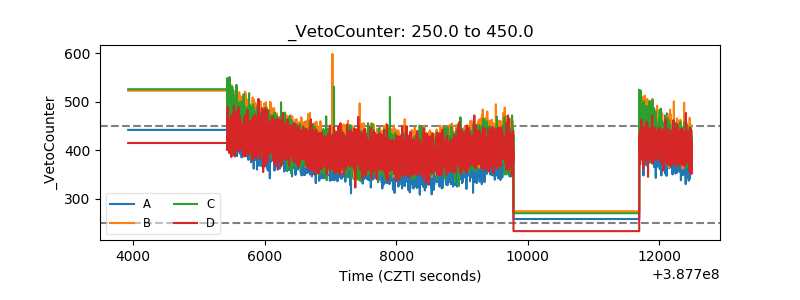 |