| Param | Original file | Final file |
|---|---|---|
| Filename | modeM0/AS1T05_022T01_9000005070cztM0_level2.fits | modeM0/AS1T05_022T01_9000005070cztM0_level2_quad_clean.evt |
| Size (bytes) | 677,027,520 | 650,715,840 |
| Size | 645.7 MB | 620.6 MB |
| Events in quadrant A | 4,386,808 | 4,203,190 |
| Events in quadrant B | 3,253,058 | 3,097,863 |
| Events in quadrant C | 4,270,912 | 3,959,741 |
| Events in quadrant D | 3,414,476 | 3,285,180 |
| Mode M0 | |||
|---|---|---|---|
| Quadrant | BADHDUFLAG | Total packets | Discarded packets |
| A | 0 | 155063 | 0 |
| B | 0 | 389167 | 0 |
| C | 0 | 176125 | 0 |
| D | 0 | 257341 | 0 |
| Mode SS | |||
|---|---|---|---|
| Quadrant | BADHDUFLAG | Total packets | Discarded packets |
| A | 0 | 1540 | 0 |
| B | 0 | 1540 | 0 |
| C | 0 | 1540 | 0 |
| D | 0 | 1540 | 0 |
| Mode M9 | |||
|---|---|---|---|
| Quadrant | BADHDUFLAG | Total packets | Discarded packets |
| A | 0 | 287 | 0 |
| B | 0 | 287 | 0 |
| C | 0 | 287 | 0 |
| D | 0 | 287 | 0 |
| Quadrant | Total seconds | Saturated seconds | Saturation percentage |
|---|---|---|---|
| A | 75242 | 108 | 0.143537% |
| B | 75242 | 31169 | 41.425002% |
| C | 75242 | 1559 | 2.071981% |
| D | 75242 | 9886 | 13.138938% |
Noise dominated data is calculated using 1-second bins in cleaned event files. If a bin has >2000 counts, and if more than 50% of those come from <1% of pixels, then it is considered to be noise-dominated and hence unusable.
| Quadrant | # 1 sec bins | Bins with >0 counts | Bins with >2000 counts | High rate bins dominated by noise | Noise dominated (total time) | Noise dominated (detector-on time) | Marked lightcurve |
|---|---|---|---|---|---|---|---|
| A | 103977 | 75242 | 0 | 0 | 0.00% | 0.00% |  |
| B | 103977 | 74907 | 0 | 0 | 0.00% | 0.00% |  |
| C | 103977 | 75208 | 0 | 0 | 0.00% | 0.00% |  |
| D | 103977 | 74255 | 0 | 0 | 0.00% | 0.00% |  |
Top three noisy pixels from each quadrant. If the there are fewer than three noisy pixels in the level2.evt file, extra rows are filled as -1
| Pixel properties | Quadrant properties | ||||||
|---|---|---|---|---|---|---|---|
| Quadrant | DetID | PixID | Counts | Sigma | Mean | Median | Sigma |
| A | 9 | 19 | 3567 | 8.93 | 1142 | 1073 | 279.2 |
| A | 0 | 29 | 3534 | 8.82 | 1142 | 1073 | 279.2 |
| A | 7 | 110 | 3532 | 8.81 | 1142 | 1073 | 279.2 |
| B | 2 | 9 | 2793 | 11.95 | 860 | 823 | 164.9 |
| B | 3 | 80 | 2523 | 10.31 | 860 | 823 | 164.9 |
| B | 2 | 8 | 2300 | 8.96 | 860 | 823 | 164.9 |
| C | 1 | 81 | 3631 | 8.97 | 1127 | 1057 | 286.9 |
| C | 1 | 80 | 3526 | 8.61 | 1127 | 1057 | 286.9 |
| C | 3 | 202 | 3365 | 8.04 | 1127 | 1057 | 286.9 |
| D | 3 | 14 | 2494 | 6.14 | 980 | 897 | 260.0 |
| D | 7 | 3 | 2472 | 6.06 | 980 | 897 | 260.0 |
| D | 10 | 189 | 2467 | 6.04 | 980 | 897 | 260.0 |
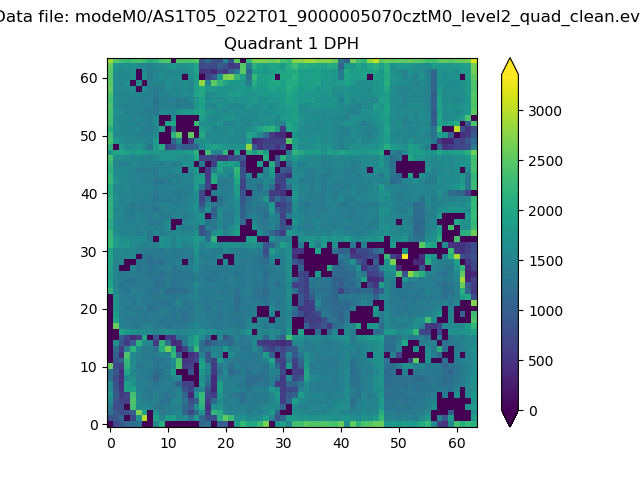
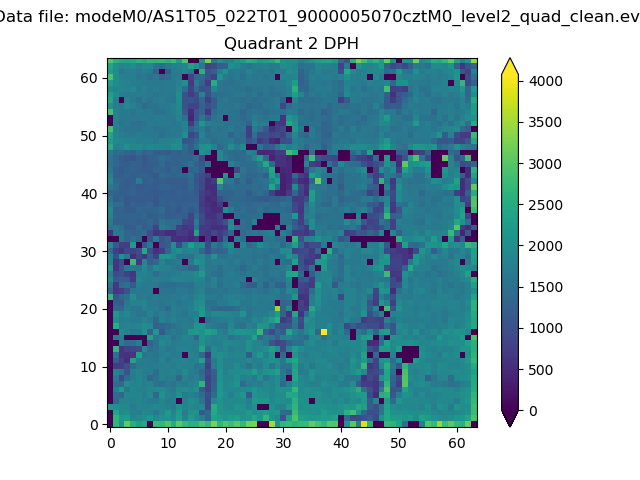
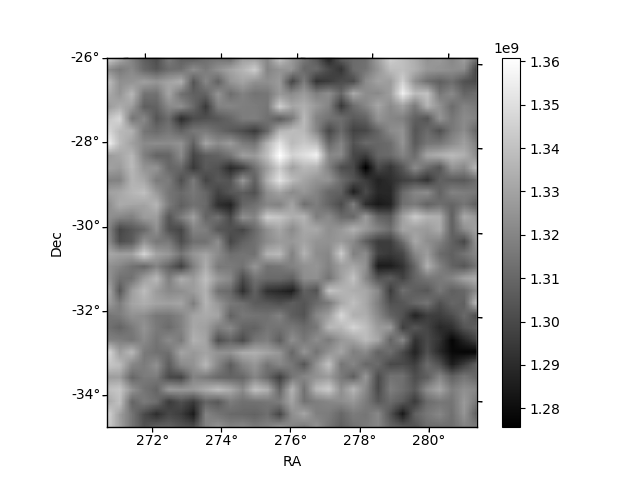
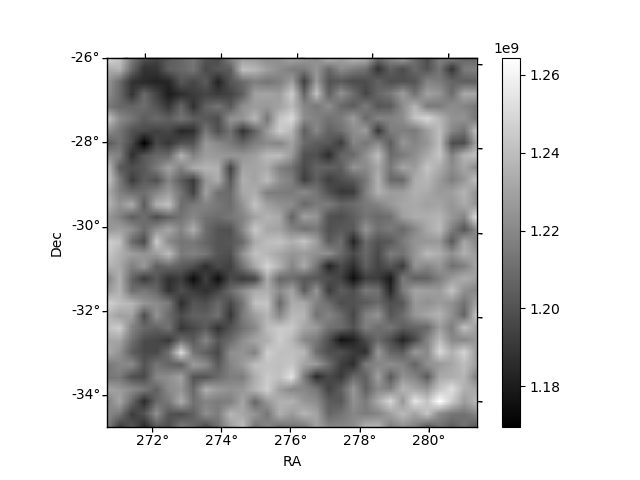
Histogram calculated using DETX and DETY for each event in the final _common_clean file
| Quadrant A |  |
 |
Quadrant B |
|---|---|---|---|
| Quadrant D | 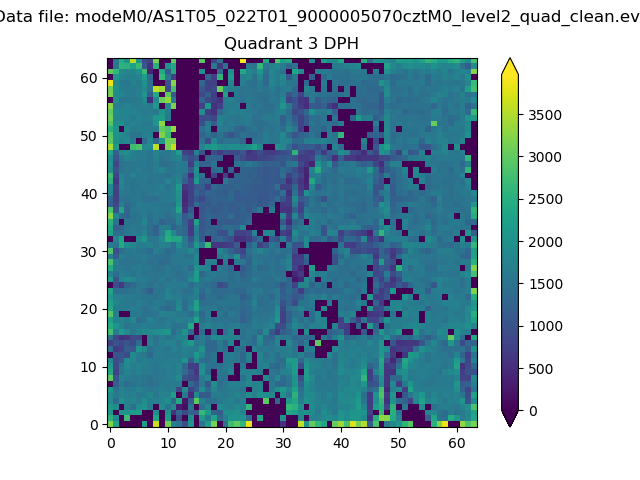 |
 |
Quadrant C |
| Plot type | Count rate plots | Images |
|---|---|---|
| Comparison with Poisson distribution Blue bars denote a histogram of data divided into 1 sec bins. Red curve is a Poisson curve with rate = median count rate of data. |
 |
 |
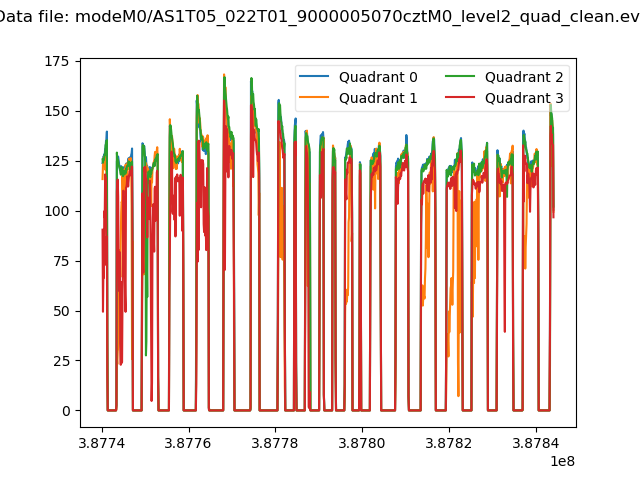
| Quadrant-wise count rates Data is divided into 100 sec bins |
 |
|
| Module-wise count rates for Quadrant A Data is divided into 100 sec bins |
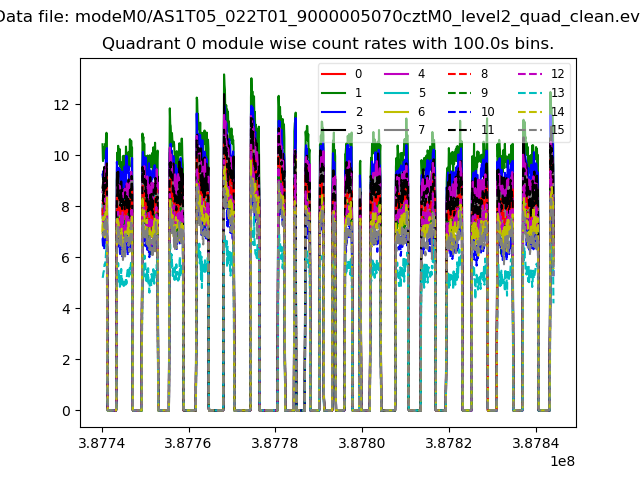 |
 |
| Module-wise count rates for Quadrant B Data is divided into 100 sec bins |
 |
 |
| Module-wise count rates for Quadrant C Data is divided into 100 sec bins |
 |
 |
| Module-wise count rates for Quadrant D Data is divided into 100 sec bins |
 |
 |
| Parameter | Plot |
|---|---|
| CZT HV Monitor | 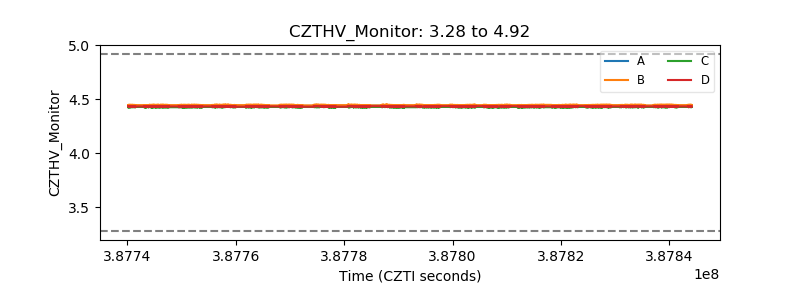 |
| D_VDD |  |
| Temperature 1 | 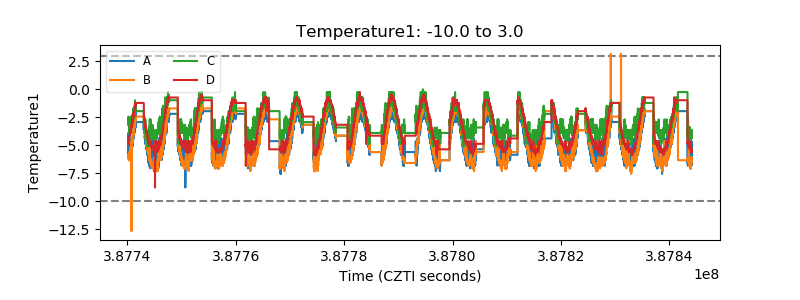 |
| Veto HV Monitor |  |
| Veto LLD | 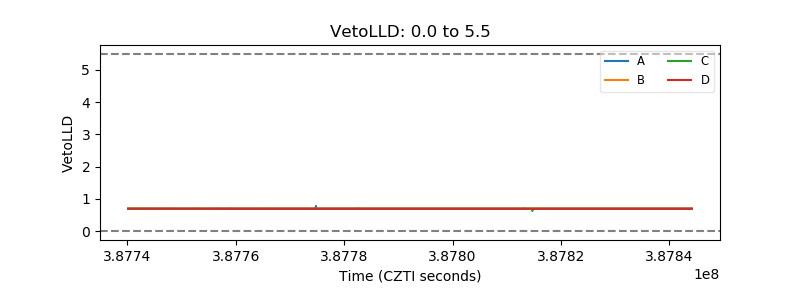 |
| Alpha Counter | 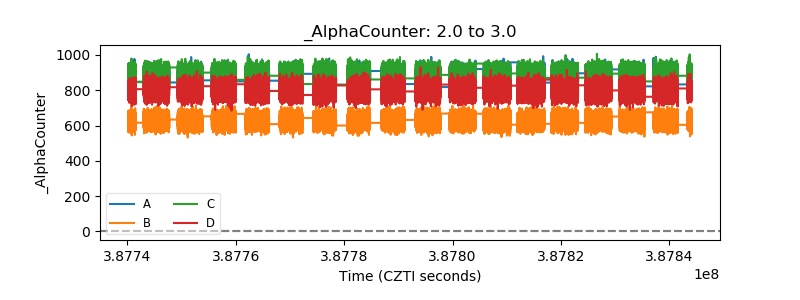 |
| _CPM_Rate |  |
| CZT Counter |  |
| +2.5 Volts monitor | 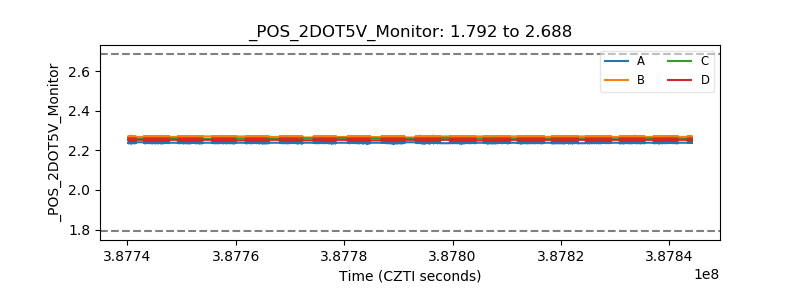 |
| +5 Volts monitor |  |
| _ROLL_ROT |  |
| _Roll_DEC |  |
| _Roll_RA | 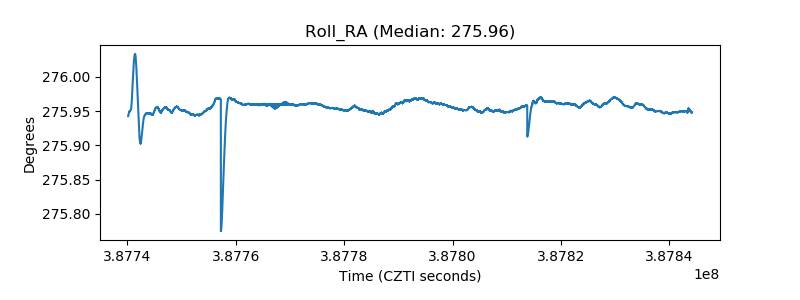 |
| Veto Counter |  |