| Param | Original file | Final file |
|---|---|---|
| Filename | modeM0/AS1A11_097T07_9000005072cztM0_level2.fits | modeM0/AS1A11_097T07_9000005072cztM0_level2_quad_clean.evt |
| Size (bytes) | 564,454,080 | 458,570,880 |
| Size | 538.3 MB | 437.3 MB |
| Events in quadrant A | 3,653,080 | 3,054,151 |
| Events in quadrant B | 2,702,556 | 1,242,095 |
| Events in quadrant C | 3,520,358 | 2,865,180 |
| Events in quadrant D | 2,931,652 | 2,452,213 |
| Mode M0 | |||
|---|---|---|---|
| Quadrant | BADHDUFLAG | Total packets | Discarded packets |
| A | 0 | 127649 | 0 |
| B | 0 | 353257 | 0 |
| C | 0 | 145980 | 0 |
| D | 0 | 192553 | 0 |
| Mode M9 | |||
|---|---|---|---|
| Quadrant | BADHDUFLAG | Total packets | Discarded packets |
| A | 0 | 241 | 0 |
| B | 0 | 241 | 0 |
| C | 0 | 241 | 0 |
| D | 0 | 241 | 0 |
| Mode SS | |||
|---|---|---|---|
| Quadrant | BADHDUFLAG | Total packets | Discarded packets |
| A | 0 | 1276 | 0 |
| B | 0 | 1276 | 0 |
| C | 0 | 1276 | 0 |
| D | 0 | 1276 | 0 |
| Quadrant | Total seconds | Saturated seconds | Saturation percentage |
|---|---|---|---|
| A | 62257 | 80 | 0.128500% |
| B | 62256 | 29723 | 47.743189% |
| C | 62257 | 1047 | 1.681739% |
| D | 62257 | 5008 | 8.044075% |
Noise dominated data is calculated using 1-second bins in cleaned event files. If a bin has >2000 counts, and if more than 50% of those come from <1% of pixels, then it is considered to be noise-dominated and hence unusable.
| Quadrant | # 1 sec bins | Bins with >0 counts | Bins with >2000 counts | High rate bins dominated by noise | Noise dominated (total time) | Noise dominated (detector-on time) | Marked lightcurve |
|---|---|---|---|---|---|---|---|
| A | 86519 | 62257 | 0 | 0 | 0.00% | 0.00% |  |
| B | 86519 | 62148 | 0 | 0 | 0.00% | 0.00% | 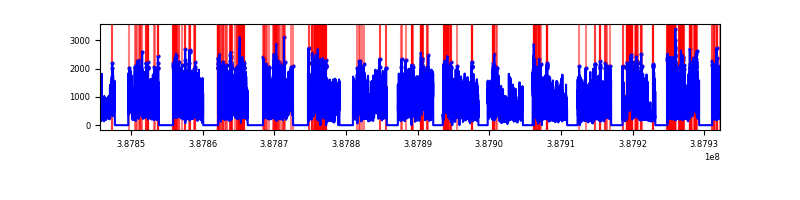 |
| C | 86519 | 62253 | 0 | 0 | 0.00% | 0.00% | 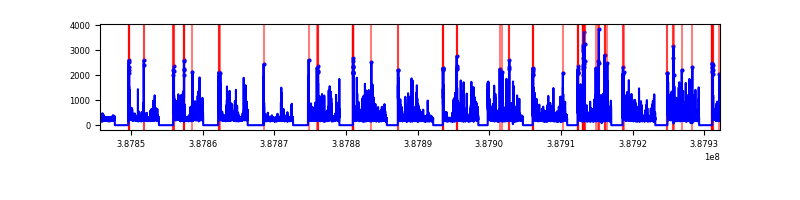 |
| D | 86519 | 62157 | 0 | 0 | 0.00% | 0.00% |  |
Top three noisy pixels from each quadrant. If the there are fewer than three noisy pixels in the level2.evt file, extra rows are filled as -1
| Pixel properties | Quadrant properties | ||||||
|---|---|---|---|---|---|---|---|
| Quadrant | DetID | PixID | Counts | Sigma | Mean | Median | Sigma |
| A | 9 | 19 | 3038 | 9.15 | 952 | 896 | 234.2 |
| A | 7 | 110 | 3022 | 9.08 | 952 | 896 | 234.2 |
| A | 0 | 29 | 2781 | 8.05 | 952 | 896 | 234.2 |
| B | 2 | 9 | 2376 | 12.24 | 716 | 687 | 138.0 |
| B | 3 | 80 | 2100 | 10.24 | 716 | 687 | 138.0 |
| B | 2 | 8 | 1992 | 9.46 | 716 | 687 | 138.0 |
| C | 1 | 81 | 2847 | 8.21 | 929 | 869 | 240.8 |
| C | 1 | 80 | 2768 | 7.89 | 929 | 869 | 240.8 |
| C | 3 | 203 | 2701 | 7.61 | 929 | 869 | 240.8 |
| D | 7 | 3 | 2218 | 6.55 | 839 | 766 | 221.6 |
| D | 6 | 67 | 2145 | 6.22 | 839 | 766 | 221.6 |
| D | 4 | 160 | 2128 | 6.15 | 839 | 766 | 221.6 |
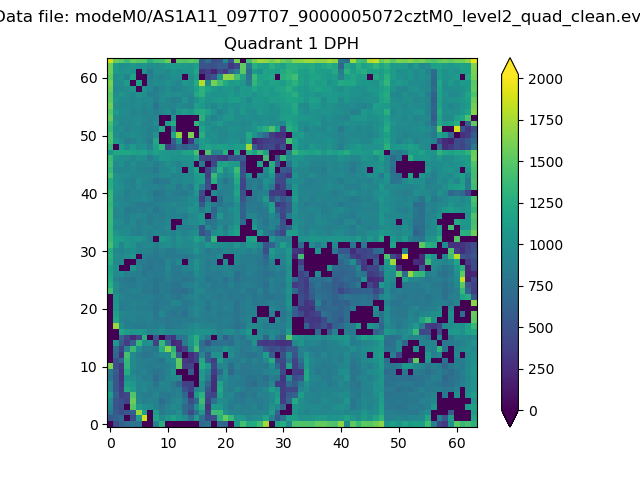
Histogram calculated using DETX and DETY for each event in the final _common_clean file
| Quadrant A |  |
 |
Quadrant B |
|---|---|---|---|
| Quadrant D |  |
 |
Quadrant C |
| Plot type | Count rate plots | Images |
|---|---|---|
| Comparison with Poisson distribution Blue bars denote a histogram of data divided into 1 sec bins. Red curve is a Poisson curve with rate = median count rate of data. |
 |
 |
| Quadrant-wise count rates Data is divided into 100 sec bins |
 |
|
| Module-wise count rates for Quadrant A Data is divided into 100 sec bins |
 |
 |
| Module-wise count rates for Quadrant B Data is divided into 100 sec bins |
 |
 |
| Module-wise count rates for Quadrant C Data is divided into 100 sec bins |
 |
 |
| Module-wise count rates for Quadrant D Data is divided into 100 sec bins |
 |
 |
| Parameter | Plot |
|---|---|
| CZT HV Monitor | 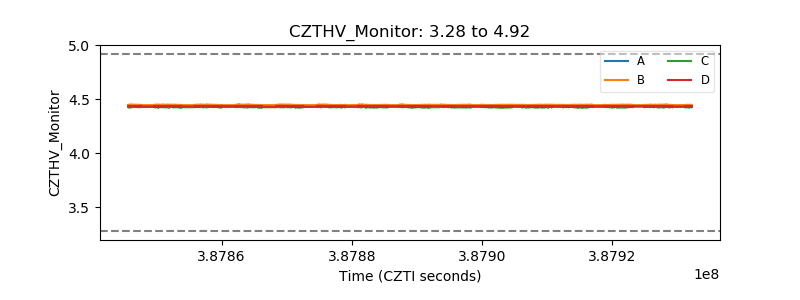 |
| D_VDD | 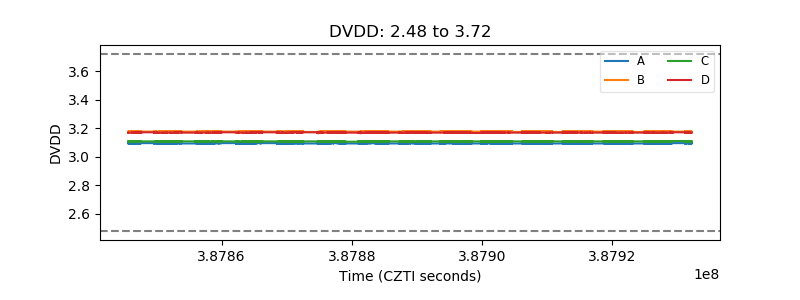 |
| Temperature 1 |  |
| Veto HV Monitor |  |
| Veto LLD |  |
| Alpha Counter |  |
| _CPM_Rate |  |
| CZT Counter |  |
| +2.5 Volts monitor |  |
| +5 Volts monitor |  |
| _ROLL_ROT |  |
| _Roll_DEC | 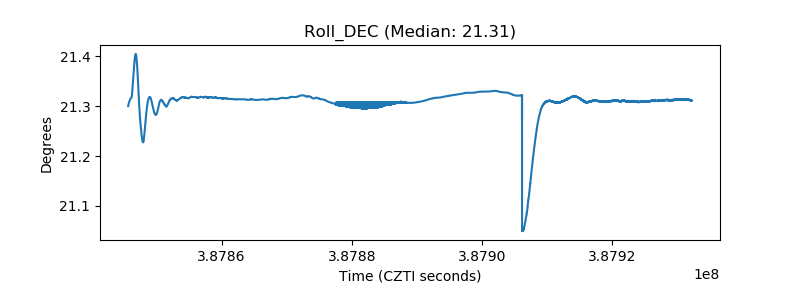 |
| _Roll_RA |  |
| Veto Counter |  |