| Param | Original file | Final file |
|---|---|---|
| Filename | modeM0/AS1A11_097T17_9000005074cztM0_level2.fits | modeM0/AS1A11_097T17_9000005074cztM0_level2_quad_clean.evt |
| Size (bytes) | 551,134,080 | 508,325,760 |
| Size | 525.6 MB | 484.8 MB |
| Events in quadrant A | 3,440,152 | 3,064,691 |
| Events in quadrant B | 3,079,682 | 2,691,189 |
| Events in quadrant C | 3,262,928 | 2,888,351 |
| Events in quadrant D | 2,862,678 | 2,707,860 |
| Mode M9 | |||
|---|---|---|---|
| Quadrant | BADHDUFLAG | Total packets | Discarded packets |
| A | 0 | 222 | 0 |
| B | 0 | 222 | 0 |
| C | 0 | 222 | 0 |
| D | 0 | 222 | 0 |
| Mode M0 | |||
|---|---|---|---|
| Quadrant | BADHDUFLAG | Total packets | Discarded packets |
| A | 0 | 120350 | 0 |
| B | 0 | 230224 | 0 |
| C | 0 | 153417 | 0 |
| D | 0 | 148646 | 0 |
| Mode SS | |||
|---|---|---|---|
| Quadrant | BADHDUFLAG | Total packets | Discarded packets |
| A | 0 | 1204 | 0 |
| B | 0 | 1204 | 0 |
| C | 0 | 1204 | 0 |
| D | 0 | 1204 | 0 |
| Quadrant | Total seconds | Saturated seconds | Saturation percentage |
|---|---|---|---|
| A | 58911 | 61 | 0.103546% |
| B | 58911 | 8251 | 14.005873% |
| C | 58907 | 2476 | 4.203236% |
| D | 58909 | 1591 | 2.700776% |
Noise dominated data is calculated using 1-second bins in cleaned event files. If a bin has >2000 counts, and if more than 50% of those come from <1% of pixels, then it is considered to be noise-dominated and hence unusable.
| Quadrant | # 1 sec bins | Bins with >0 counts | Bins with >2000 counts | High rate bins dominated by noise | Noise dominated (total time) | Noise dominated (detector-on time) | Marked lightcurve |
|---|---|---|---|---|---|---|---|
| A | 81083 | 58912 | 0 | 0 | 0.00% | 0.00% |  |
| B | 81083 | 58907 | 0 | 0 | 0.00% | 0.00% | 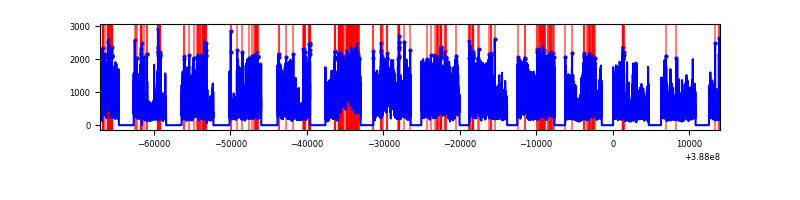 |
| C | 81083 | 58830 | 0 | 0 | 0.00% | 0.00% |  |
| D | 81083 | 58888 | 0 | 0 | 0.00% | 0.00% |  |
Top three noisy pixels from each quadrant. If the there are fewer than three noisy pixels in the level2.evt file, extra rows are filled as -1
| Pixel properties | Quadrant properties | ||||||
|---|---|---|---|---|---|---|---|
| Quadrant | DetID | PixID | Counts | Sigma | Mean | Median | Sigma |
| A | 0 | 29 | 2876 | 9.18 | 896 | 842 | 221.7 |
| A | 7 | 110 | 2837 | 9.0 | 896 | 842 | 221.7 |
| A | 9 | 19 | 2808 | 8.87 | 896 | 842 | 221.7 |
| B | 2 | 9 | 2692 | 11.85 | 815 | 778 | 161.5 |
| B | 3 | 80 | 2357 | 9.77 | 815 | 778 | 161.5 |
| B | 2 | 8 | 2269 | 9.23 | 815 | 778 | 161.5 |
| C | 1 | 81 | 2744 | 8.61 | 862 | 806 | 225.1 |
| C | 1 | 80 | 2664 | 8.25 | 862 | 806 | 225.1 |
| C | 3 | 234 | 2269 | 6.5 | 862 | 806 | 225.1 |
| D | 7 | 3 | 2066 | 5.98 | 820 | 747 | 220.7 |
| D | 3 | 14 | 2049 | 5.9 | 820 | 747 | 220.7 |
| D | 10 | 113 | 2040 | 5.86 | 820 | 747 | 220.7 |
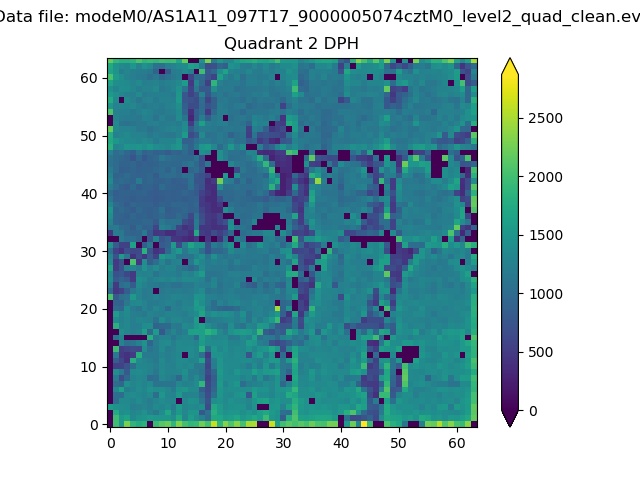
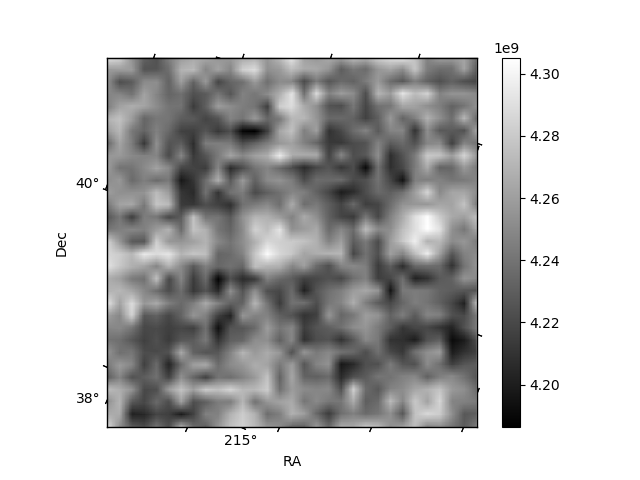
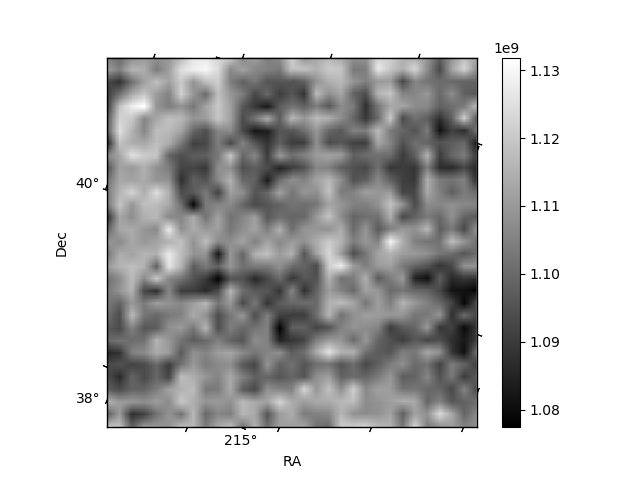
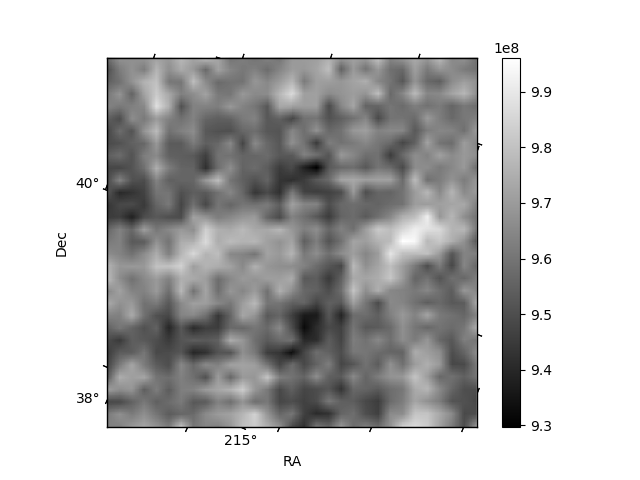
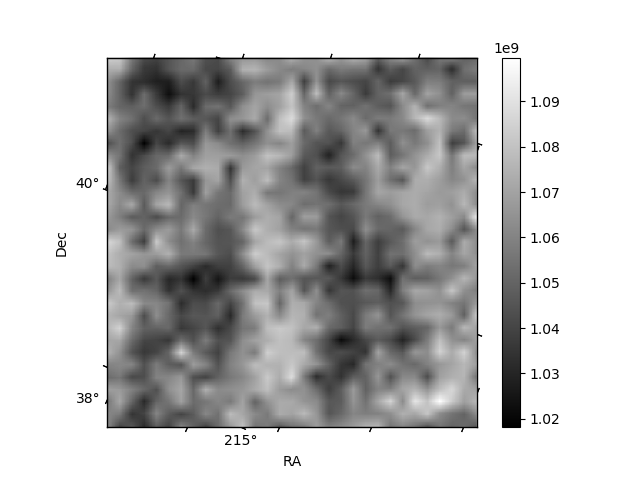
Histogram calculated using DETX and DETY for each event in the final _common_clean file
| Quadrant A | 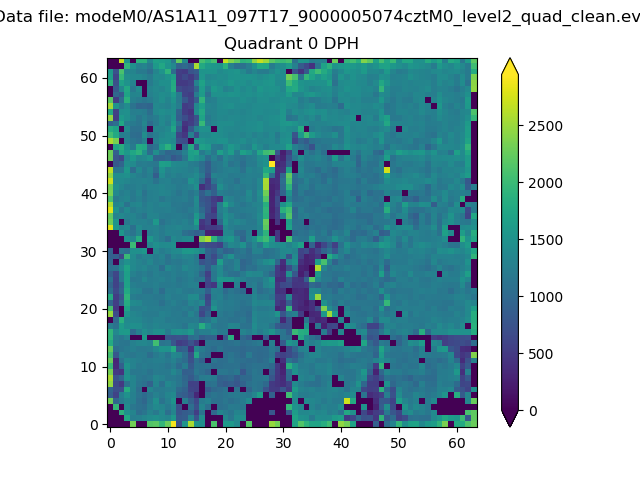 |
 |
Quadrant B |
|---|---|---|---|
| Quadrant D | 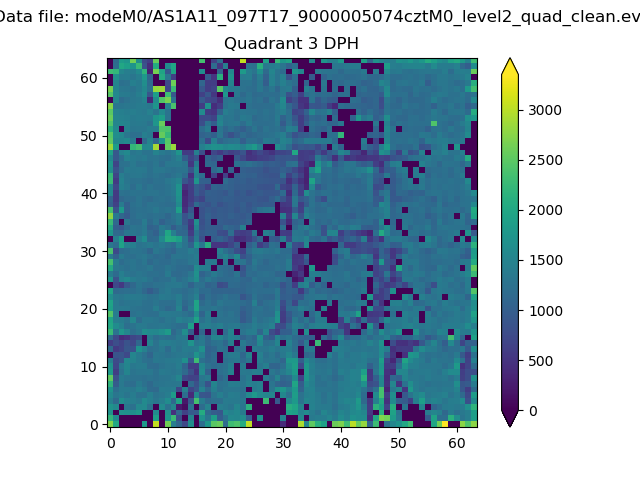 |
 |
Quadrant C |
| Plot type | Count rate plots | Images |
|---|---|---|
| Comparison with Poisson distribution Blue bars denote a histogram of data divided into 1 sec bins. Red curve is a Poisson curve with rate = median count rate of data. |
 |
 |
| Quadrant-wise count rates Data is divided into 100 sec bins |
 |
|
| Module-wise count rates for Quadrant A Data is divided into 100 sec bins |
 |
 |
| Module-wise count rates for Quadrant B Data is divided into 100 sec bins |
 |
 |
| Module-wise count rates for Quadrant C Data is divided into 100 sec bins |
 |
 |
| Module-wise count rates for Quadrant D Data is divided into 100 sec bins |
 |
 |
| Parameter | Plot |
|---|---|
| CZT HV Monitor |  |
| D_VDD | 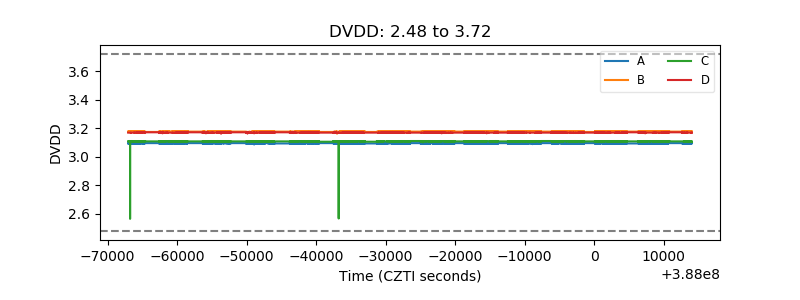 |
| Temperature 1 |  |
| Veto HV Monitor | 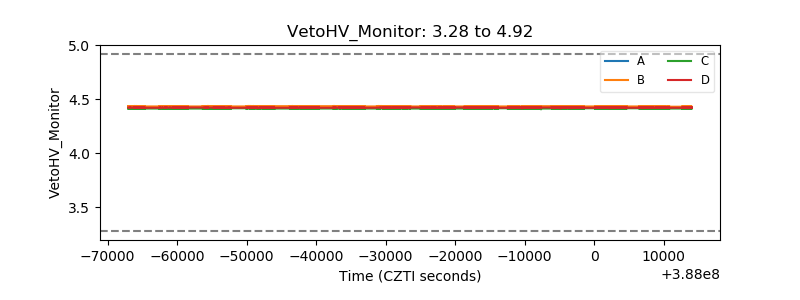 |
| Veto LLD | 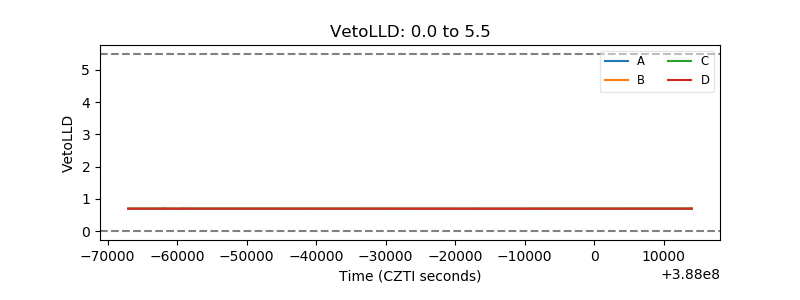 |
| Alpha Counter | 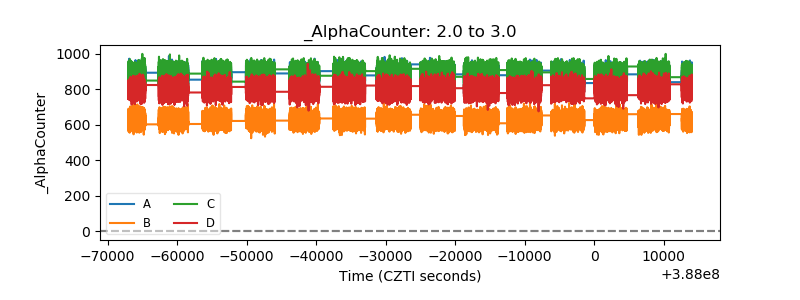 |
| _CPM_Rate |  |
| CZT Counter | 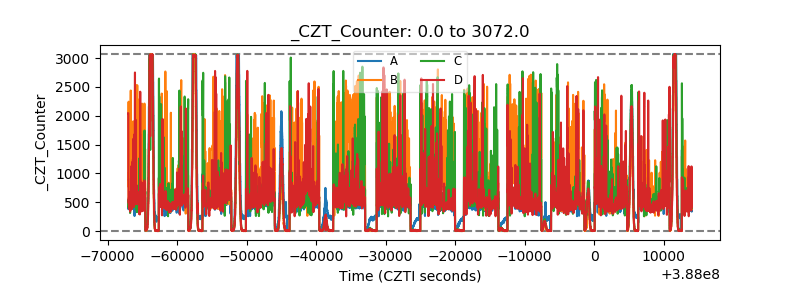 |
| +2.5 Volts monitor |  |
| +5 Volts monitor | 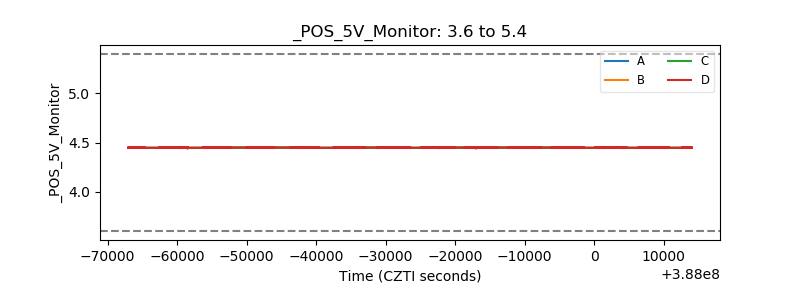 |
| _ROLL_ROT |  |
| _Roll_DEC | 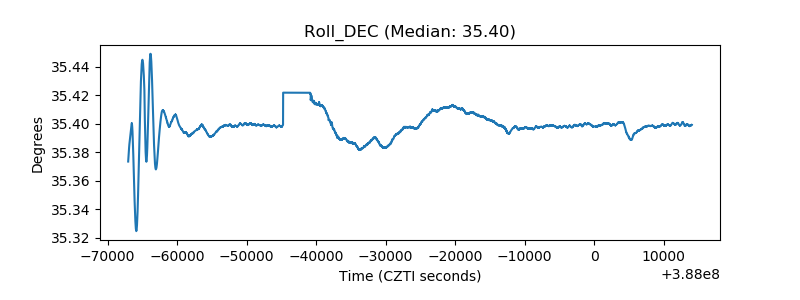 |
| _Roll_RA |  |
| Veto Counter |  |