| Param | Original file | Final file |
|---|---|---|
| Filename | modeM0/AS1A11_068T03_9000005076cztM0_level2.fits | modeM0/AS1A11_068T03_9000005076cztM0_level2_quad_clean.evt |
| Size (bytes) | 386,159,040 | 338,630,400 |
| Size | 368.3 MB | 322.9 MB |
| Events in quadrant A | 2,419,972 | 2,059,488 |
| Events in quadrant B | 2,188,012 | 1,766,360 |
| Events in quadrant C | 2,323,644 | 1,933,110 |
| Events in quadrant D | 2,009,020 | 1,742,883 |
| Mode SS | |||
|---|---|---|---|
| Quadrant | BADHDUFLAG | Total packets | Discarded packets |
| A | 0 | 818 | 0 |
| B | 0 | 818 | 0 |
| C | 0 | 818 | 0 |
| D | 0 | 818 | 0 |
| Mode M0 | |||
|---|---|---|---|
| Quadrant | BADHDUFLAG | Total packets | Discarded packets |
| A | 0 | 82862 | 0 |
| B | 0 | 141313 | 0 |
| C | 0 | 92013 | 0 |
| D | 0 | 99181 | 0 |
| Mode M9 | |||
|---|---|---|---|
| Quadrant | BADHDUFLAG | Total packets | Discarded packets |
| A | 0 | 163 | 0 |
| B | 0 | 163 | 0 |
| C | 0 | 163 | 0 |
| D | 0 | 163 | 0 |
| Quadrant | Total seconds | Saturated seconds | Saturation percentage |
|---|---|---|---|
| A | 40087 | 72 | 0.179609% |
| B | 40087 | 4971 | 12.400529% |
| C | 40087 | 734 | 1.831018% |
| D | 40087 | 1110 | 2.768977% |
Noise dominated data is calculated using 1-second bins in cleaned event files. If a bin has >2000 counts, and if more than 50% of those come from <1% of pixels, then it is considered to be noise-dominated and hence unusable.
| Quadrant | # 1 sec bins | Bins with >0 counts | Bins with >2000 counts | High rate bins dominated by noise | Noise dominated (total time) | Noise dominated (detector-on time) | Marked lightcurve |
|---|---|---|---|---|---|---|---|
| A | 56340 | 40087 | 0 | 0 | 0.00% | 0.00% |  |
| B | 56340 | 40079 | 0 | 0 | 0.00% | 0.00% |  |
| C | 56340 | 40081 | 0 | 0 | 0.00% | 0.00% | 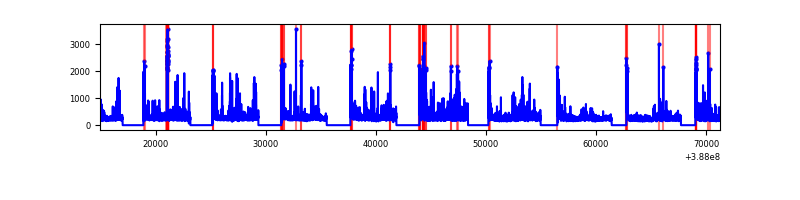 |
| D | 56340 | 40067 | 0 | 0 | 0.00% | 0.00% | 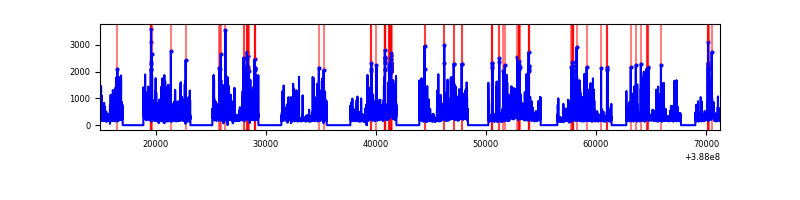 |
Top three noisy pixels from each quadrant. If the there are fewer than three noisy pixels in the level2.evt file, extra rows are filled as -1
| Pixel properties | Quadrant properties | ||||||
|---|---|---|---|---|---|---|---|
| Quadrant | DetID | PixID | Counts | Sigma | Mean | Median | Sigma |
| A | 7 | 110 | 2078 | 9.58 | 631 | 593 | 155.0 |
| A | 9 | 19 | 1949 | 8.75 | 631 | 593 | 155.0 |
| A | 0 | 29 | 1924 | 8.59 | 631 | 593 | 155.0 |
| B | 2 | 9 | 1891 | 11.63 | 579 | 554 | 114.9 |
| B | 3 | 80 | 1562 | 8.77 | 579 | 554 | 114.9 |
| B | 5 | 128 | 1534 | 8.53 | 579 | 554 | 114.9 |
| C | 1 | 81 | 1904 | 8.4 | 614 | 575 | 158.3 |
| C | 1 | 80 | 1850 | 8.05 | 614 | 575 | 158.3 |
| C | 3 | 234 | 1621 | 6.61 | 614 | 575 | 158.3 |
| D | 6 | 231 | 1463 | 6.06 | 574 | 523 | 155.0 |
| D | 6 | 38 | 1462 | 6.06 | 574 | 523 | 155.0 |
| D | 7 | 3 | 1418 | 5.77 | 574 | 523 | 155.0 |
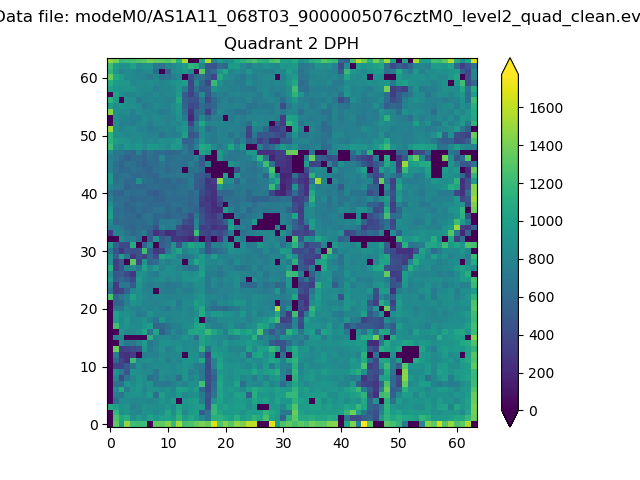
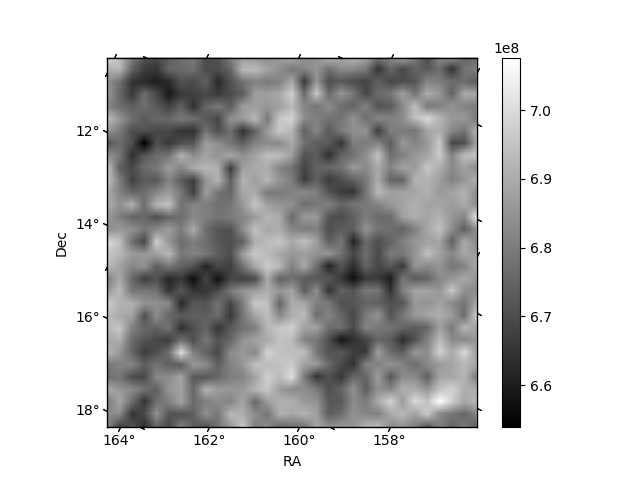
Histogram calculated using DETX and DETY for each event in the final _common_clean file
| Quadrant A | 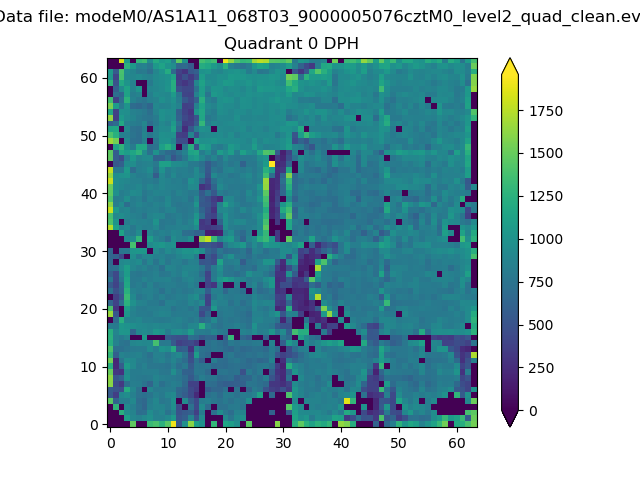 |
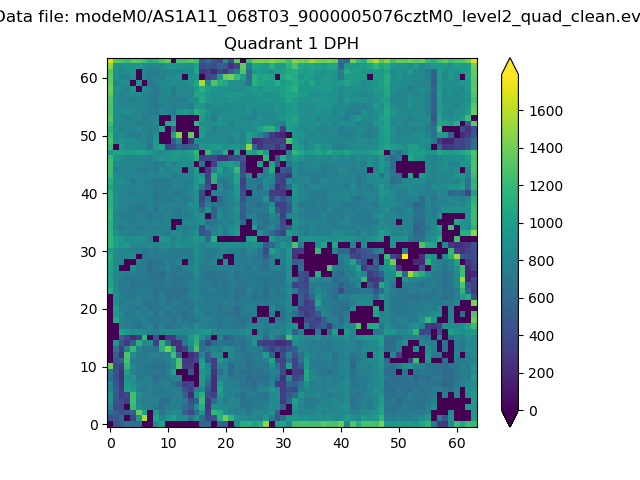 |
Quadrant B |
|---|---|---|---|
| Quadrant D | 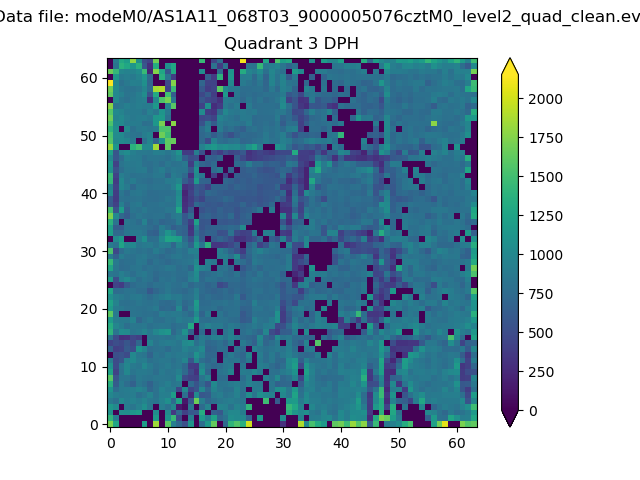 |
 |
Quadrant C |
| Plot type | Count rate plots | Images |
|---|---|---|
| Comparison with Poisson distribution Blue bars denote a histogram of data divided into 1 sec bins. Red curve is a Poisson curve with rate = median count rate of data. |
 |
 |
| Quadrant-wise count rates Data is divided into 100 sec bins |
 |
|
| Module-wise count rates for Quadrant A Data is divided into 100 sec bins |
 |
 |
| Module-wise count rates for Quadrant B Data is divided into 100 sec bins |
 |
 |
| Module-wise count rates for Quadrant C Data is divided into 100 sec bins |
 |
 |
| Module-wise count rates for Quadrant D Data is divided into 100 sec bins |
 |
 |
| Parameter | Plot |
|---|---|
| CZT HV Monitor |  |
| D_VDD | 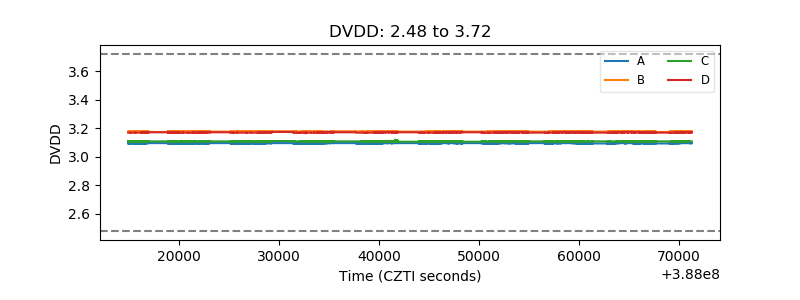 |
| Temperature 1 |  |
| Veto HV Monitor | 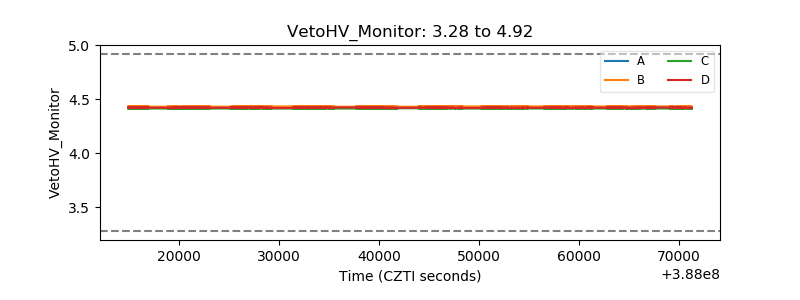 |
| Veto LLD |  |
| Alpha Counter |  |
| _CPM_Rate |  |
| CZT Counter |  |
| +2.5 Volts monitor |  |
| +5 Volts monitor | 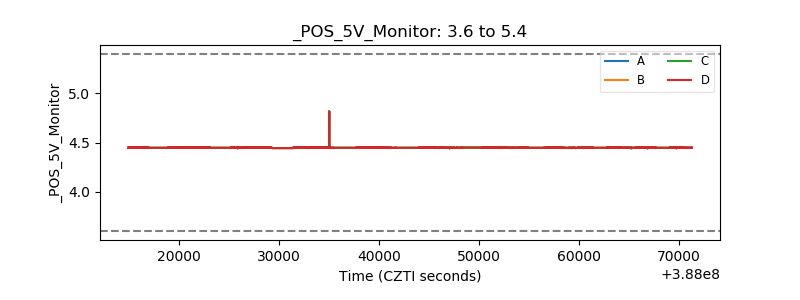 |
| _ROLL_ROT | 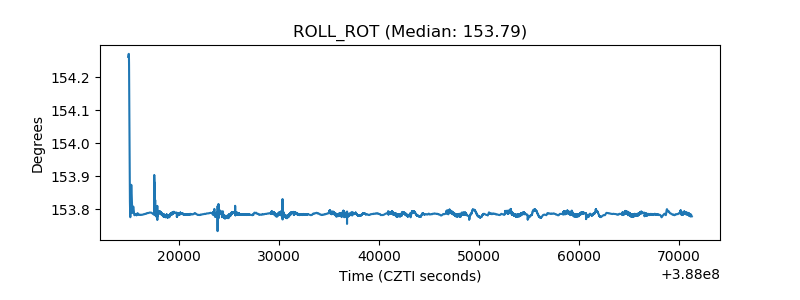 |
| _Roll_DEC | 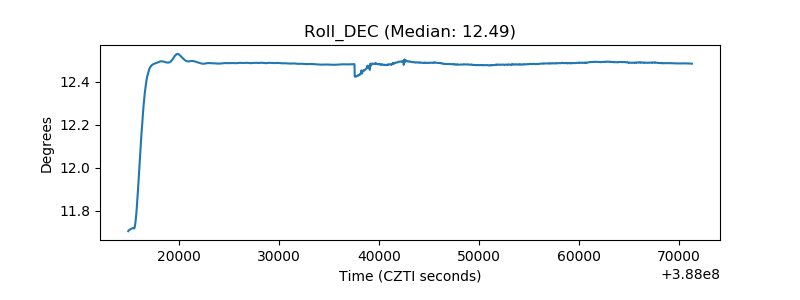 |
| _Roll_RA |  |
| Veto Counter |  |