| Param | Original file | Final file |
|---|---|---|
| Filename | modeM0/AS1A11_095T06_9000005078cztM0_level2.fits | modeM0/AS1A11_095T06_9000005078cztM0_level2_quad_clean.evt |
| Size (bytes) | 524,845,440 | 405,440,640 |
| Size | 500.5 MB | 386.7 MB |
| Events in quadrant A | 3,236,470 | 2,260,531 |
| Events in quadrant B | 3,066,146 | 2,199,514 |
| Events in quadrant C | 3,123,260 | 2,122,138 |
| Events in quadrant D | 2,719,192 | 1,945,133 |
| Mode M9 | |||
|---|---|---|---|
| Quadrant | BADHDUFLAG | Total packets | Discarded packets |
| A | 0 | 211 | 0 |
| B | 0 | 211 | 0 |
| C | 0 | 211 | 0 |
| D | 0 | 211 | 0 |
| Mode M0 | |||
|---|---|---|---|
| Quadrant | BADHDUFLAG | Total packets | Discarded packets |
| A | 0 | 116649 | 0 |
| B | 0 | 132925 | 0 |
| C | 0 | 126814 | 0 |
| D | 0 | 129972 | 0 |
| Mode SS | |||
|---|---|---|---|
| Quadrant | BADHDUFLAG | Total packets | Discarded packets |
| A | 0 | 1120 | 0 |
| B | 0 | 1120 | 0 |
| C | 0 | 1120 | 0 |
| D | 0 | 1120 | 0 |
| Quadrant | Total seconds | Saturated seconds | Saturation percentage |
|---|---|---|---|
| A | 54639 | 187 | 0.342246% |
| B | 54639 | 2075 | 3.797654% |
| C | 54639 | 946 | 1.731364% |
| D | 54639 | 1014 | 1.855817% |
Noise dominated data is calculated using 1-second bins in cleaned event files. If a bin has >2000 counts, and if more than 50% of those come from <1% of pixels, then it is considered to be noise-dominated and hence unusable.
| Quadrant | # 1 sec bins | Bins with >0 counts | Bins with >2000 counts | High rate bins dominated by noise | Noise dominated (total time) | Noise dominated (detector-on time) | Marked lightcurve |
|---|---|---|---|---|---|---|---|
| A | 75911 | 54640 | 0 | 0 | 0.00% | 0.00% |  |
| B | 75911 | 54632 | 0 | 0 | 0.00% | 0.00% |  |
| C | 75911 | 54637 | 0 | 0 | 0.00% | 0.00% |  |
| D | 75911 | 54633 | 0 | 0 | 0.00% | 0.00% |  |
Top three noisy pixels from each quadrant. If the there are fewer than three noisy pixels in the level2.evt file, extra rows are filled as -1
| Pixel properties | Quadrant properties | ||||||
|---|---|---|---|---|---|---|---|
| Quadrant | DetID | PixID | Counts | Sigma | Mean | Median | Sigma |
| A | 7 | 110 | 2706 | 9.1 | 843 | 793 | 210.2 |
| A | 9 | 19 | 2674 | 8.95 | 843 | 793 | 210.2 |
| A | 0 | 29 | 2617 | 8.68 | 843 | 793 | 210.2 |
| B | 2 | 9 | 2565 | 11.4 | 809 | 773 | 157.3 |
| B | 3 | 80 | 2312 | 9.79 | 809 | 773 | 157.3 |
| B | 5 | 255 | 2167 | 8.86 | 809 | 773 | 157.3 |
| C | 1 | 81 | 2517 | 8.25 | 825 | 774 | 211.3 |
| C | 3 | 203 | 2451 | 7.94 | 825 | 774 | 211.3 |
| C | 3 | 202 | 2433 | 7.85 | 825 | 774 | 211.3 |
| D | 6 | 67 | 1953 | 6.03 | 776 | 708 | 206.4 |
| D | 1 | 3 | 1923 | 5.89 | 776 | 708 | 206.4 |
| D | 7 | 3 | 1922 | 5.88 | 776 | 708 | 206.4 |
Histogram calculated using DETX and DETY for each event in the final _common_clean file
| Quadrant A | 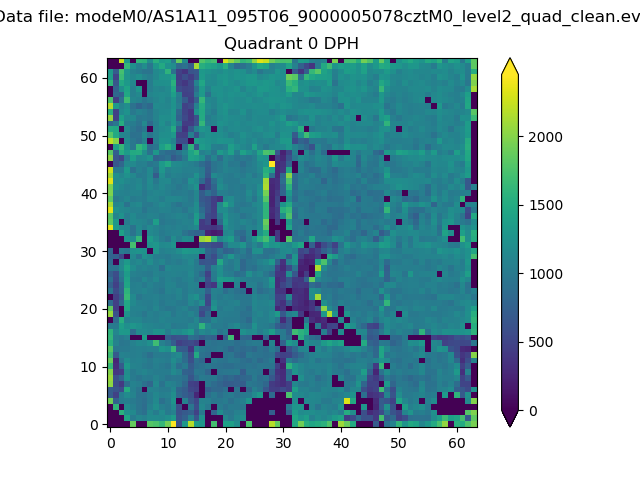 |
 |
Quadrant B |
|---|---|---|---|
| Quadrant D |  |
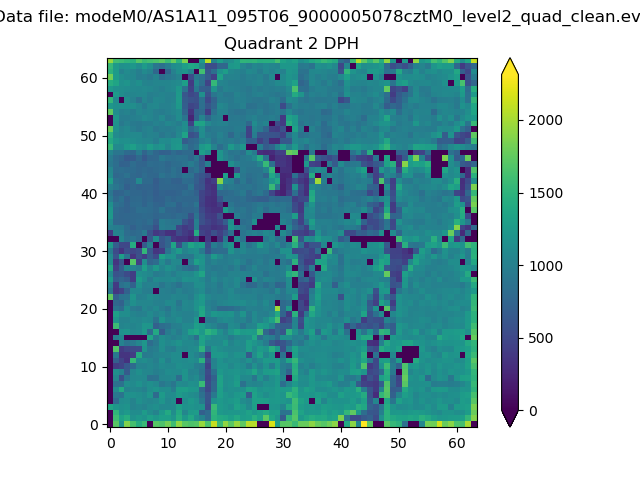 |
Quadrant C |
| Plot type | Count rate plots | Images |
|---|---|---|
| Comparison with Poisson distribution Blue bars denote a histogram of data divided into 1 sec bins. Red curve is a Poisson curve with rate = median count rate of data. |
 |
 |
| Quadrant-wise count rates Data is divided into 100 sec bins |
 |
|
| Module-wise count rates for Quadrant A Data is divided into 100 sec bins |
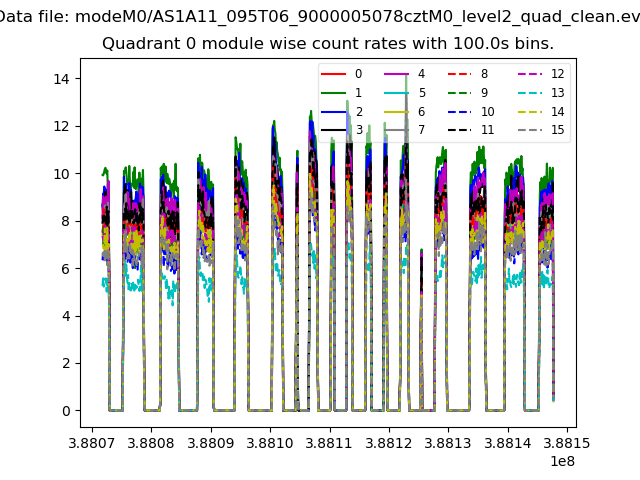 |
 |
| Module-wise count rates for Quadrant B Data is divided into 100 sec bins |
 |
 |
| Module-wise count rates for Quadrant C Data is divided into 100 sec bins |
 |
 |
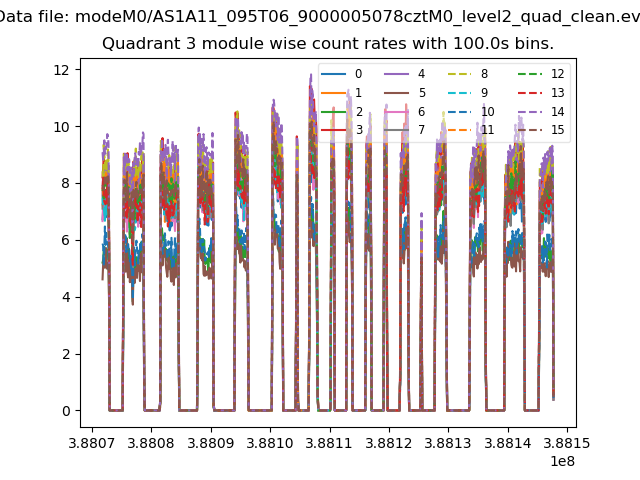
| Module-wise count rates for Quadrant D Data is divided into 100 sec bins |
 |
 |
| Parameter | Plot |
|---|---|
| CZT HV Monitor |  |
| D_VDD | 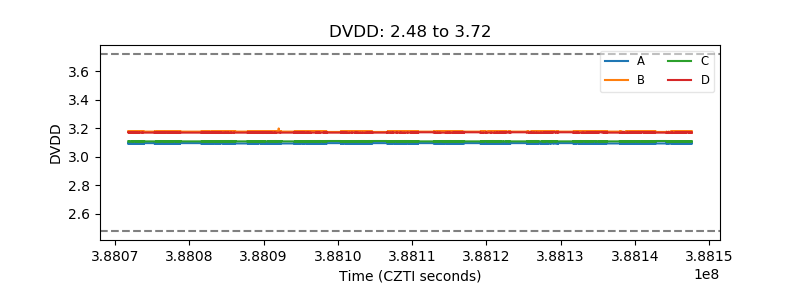 |
| Temperature 1 | 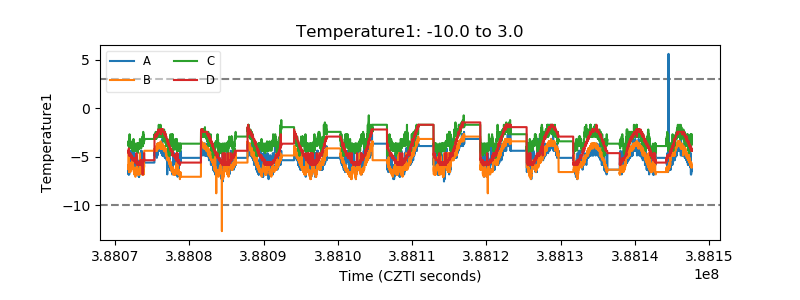 |
| Veto HV Monitor |  |
| Veto LLD | 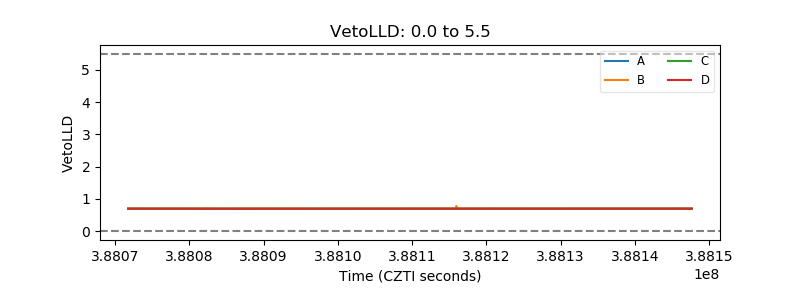 |
| Alpha Counter |  |
| _CPM_Rate |  |
| CZT Counter | 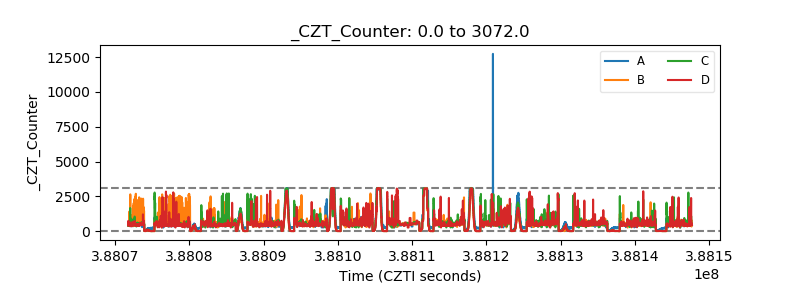 |
| +2.5 Volts monitor |  |
| +5 Volts monitor |  |
| _ROLL_ROT | 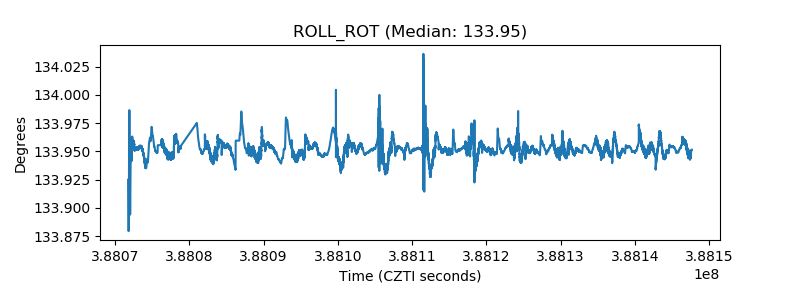 |
| _Roll_DEC |  |
| _Roll_RA | 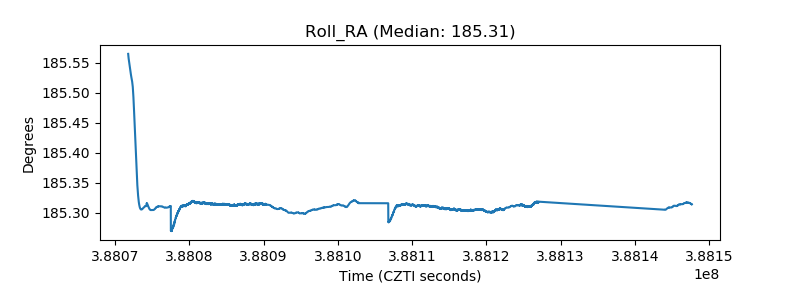 |
| Veto Counter | 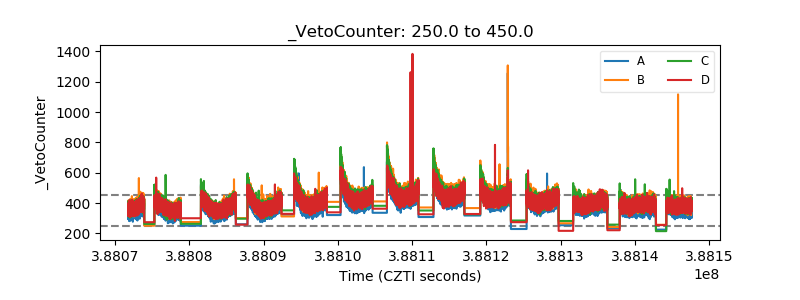 |