| Param | Original file | Final file |
|---|---|---|
| Filename | modeM0/AS1T04_095T01_9000005080cztM0_level2.fits | modeM0/AS1T04_095T01_9000005080cztM0_level2_quad_clean.evt |
| Size (bytes) | 644,065,920 | 861,768,000 |
| Size | 614.2 MB | 821.8 MB |
| Events in quadrant A | 4,055,586 | 5,785,022 |
| Events in quadrant B | 3,903,578 | 5,947,552 |
| Events in quadrant C | 3,097,248 | 4,134,408 |
| Events in quadrant D | 3,516,590 | 5,315,407 |
| Mode M0 | |||
|---|---|---|---|
| Quadrant | BADHDUFLAG | Total packets | Discarded packets |
| A | 0 | 180580 | 0 |
| B | 0 | 184886 | 0 |
| C | 0 | 340639 | 0 |
| D | 0 | 175782 | 0 |
| Mode M9 | |||
|---|---|---|---|
| Quadrant | BADHDUFLAG | Total packets | Discarded packets |
| A | 0 | 263 | 0 |
| B | 0 | 263 | 0 |
| C | 0 | 263 | 0 |
| D | 0 | 263 | 0 |
| Mode SS | |||
|---|---|---|---|
| Quadrant | BADHDUFLAG | Total packets | Discarded packets |
| A | 0 | 1468 | 0 |
| B | 0 | 1468 | 0 |
| C | 0 | 1468 | 0 |
| D | 0 | 1468 | 0 |
| Quadrant | Total seconds | Saturated seconds | Saturation percentage |
|---|---|---|---|
| A | 71701 | 4470 | 6.234223% |
| B | 71701 | 3149 | 4.391849% |
| C | 71701 | 24274 | 33.854479% |
| D | 71701 | 1932 | 2.694523% |
Noise dominated data is calculated using 1-second bins in cleaned event files. If a bin has >2000 counts, and if more than 50% of those come from <1% of pixels, then it is considered to be noise-dominated and hence unusable.
| Quadrant | # 1 sec bins | Bins with >0 counts | Bins with >2000 counts | High rate bins dominated by noise | Noise dominated (total time) | Noise dominated (detector-on time) | Marked lightcurve |
|---|---|---|---|---|---|---|---|
| A | 98221 | 71695 | 0 | 0 | 0.00% | 0.00% |  |
| B | 98221 | 71624 | 0 | 0 | 0.00% | 0.00% |  |
| C | 98221 | 69947 | 0 | 0 | 0.00% | 0.00% |  |
| D | 98221 | 71664 | 0 | 0 | 0.00% | 0.00% |  |
Top three noisy pixels from each quadrant. If the there are fewer than three noisy pixels in the level2.evt file, extra rows are filled as -1
| Pixel properties | Quadrant properties | ||||||
|---|---|---|---|---|---|---|---|
| Quadrant | DetID | PixID | Counts | Sigma | Mean | Median | Sigma |
| A | 7 | 110 | 3347 | 9.13 | 1057 | 998 | 257.3 |
| A | 9 | 19 | 3214 | 8.61 | 1057 | 998 | 257.3 |
| A | 0 | 29 | 3199 | 8.56 | 1057 | 998 | 257.3 |
| B | 2 | 9 | 3285 | 11.47 | 1034 | 993 | 199.8 |
| B | 3 | 80 | 2995 | 10.02 | 1034 | 993 | 199.8 |
| B | 2 | 8 | 2779 | 8.94 | 1034 | 993 | 199.8 |
| C | 1 | 81 | 2619 | 8.77 | 818 | 768 | 211.0 |
| C | 1 | 80 | 2592 | 8.64 | 818 | 768 | 211.0 |
| C | 3 | 202 | 2415 | 7.8 | 818 | 768 | 211.0 |
| D | 4 | 160 | 2603 | 6.32 | 1006 | 922 | 266.1 |
| D | 6 | 62 | 2561 | 6.16 | 1006 | 922 | 266.1 |
| D | 7 | 3 | 2552 | 6.12 | 1006 | 922 | 266.1 |
Histogram calculated using DETX and DETY for each event in the final _common_clean file
| Quadrant A |  |
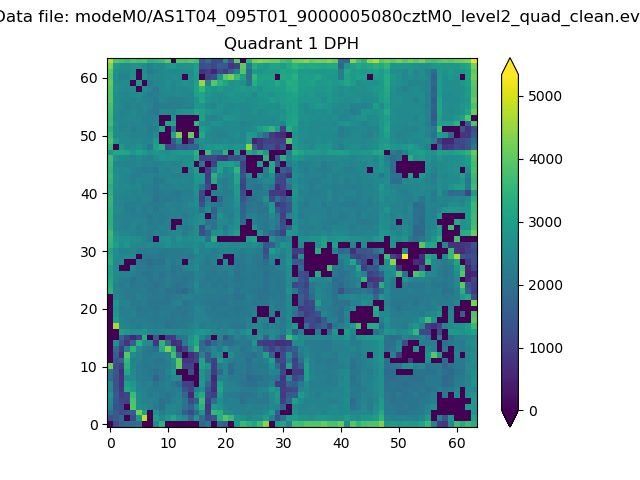 |
Quadrant B |
|---|---|---|---|
| Quadrant D |  |
 |
Quadrant C |
| Plot type | Count rate plots | Images |
|---|---|---|
| Comparison with Poisson distribution Blue bars denote a histogram of data divided into 1 sec bins. Red curve is a Poisson curve with rate = median count rate of data. |
 |
 |
| Quadrant-wise count rates Data is divided into 100 sec bins |
 |
|
| Module-wise count rates for Quadrant A Data is divided into 100 sec bins |
 |
 |
| Module-wise count rates for Quadrant B Data is divided into 100 sec bins |
 |
 |
| Module-wise count rates for Quadrant C Data is divided into 100 sec bins |
 |
 |
| Module-wise count rates for Quadrant D Data is divided into 100 sec bins |
 |
 |
| Parameter | Plot |
|---|---|
| CZT HV Monitor |  |
| D_VDD |  |
| Temperature 1 |  |
| Veto HV Monitor |  |
| Veto LLD |  |
| Alpha Counter |  |
| _CPM_Rate |  |
| CZT Counter |  |
| +2.5 Volts monitor |  |
| +5 Volts monitor |  |
| _ROLL_ROT |  |
| _Roll_DEC |  |
| _Roll_RA |  |
| Veto Counter |  |